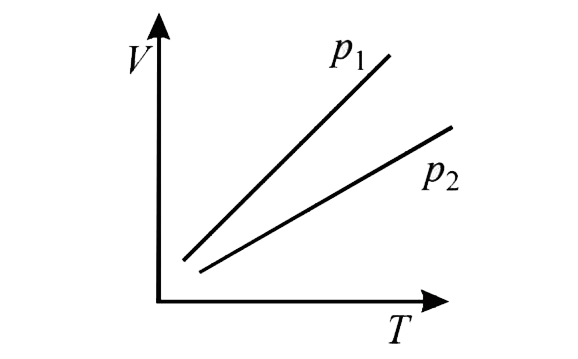
Figure 6.18 shows the V-T graph for a fixed mass of an ideal gas at pressure p1 and p2. Can you infer from the graph whether p1 is greater than p2?
We have pV=nRT
or, V=nRPT
this shows that the V-T graph is a straight line passing through the origin for any fixed pressure p(n=constant for a fixed mass).
The slope nRp Is greater for a smaller value of p. In fig.6.18, the graph for p2 has a higher slope.
So, p2<p1
Thus p1 is greater than p2.
Topper's Solved these Questions
- EXPANSION OF GASESBOOK - CHHAYA PUBLICATIONCHAPTER - EXPANSION OF GASESEXERCISE - EXERCISE (MULTIPLE CHOICE QUESTION)
20 Videos
- EXPANSION OF GASESBOOK - CHHAYA PUBLICATIONCHAPTER - EXPANSION OF GASESEXERCISE - EXERCISE (Very Short Answer Type Question)
6 Videos
- EXPANSION OF GASESBOOK - CHHAYA PUBLICATIONCHAPTER - EXPANSION OF GASESEXERCISE - CBSE Scanner
1 Videos
- ELASTICITY BOOK - CHHAYA PUBLICATIONCHAPTER - ELASTICITY EXERCISE - CBSE SCANNER
10 Videos
- EXPANSION OF SOLIDS AND LIQUIDSBOOK - CHHAYA PUBLICATIONCHAPTER - EXPANSION OF SOLIDS AND LIQUIDSEXERCISE - CBSE SCANNER
2 Videos
Similar Questions
The volume V versus temperature T graphs for a cetain amount of a perfect gas at two pressure p1andp2 are as shown in Fig. It follows from the graphs that p1 is greater than p2.
View SolutionThe volume V versus temperature T graphs for a certain amount of a perfect gas at two pressure p1andp2 are as shown in Fig. It follows from the graphs that p1 is greater than p2.

View Solution
Knowledge Check
The P−T graph for the given mass of an ideal gas is shown in figure. Then the volume
_E01_022_Q01.png) AincreasesBdecreasesCremains constantDdata insuficient
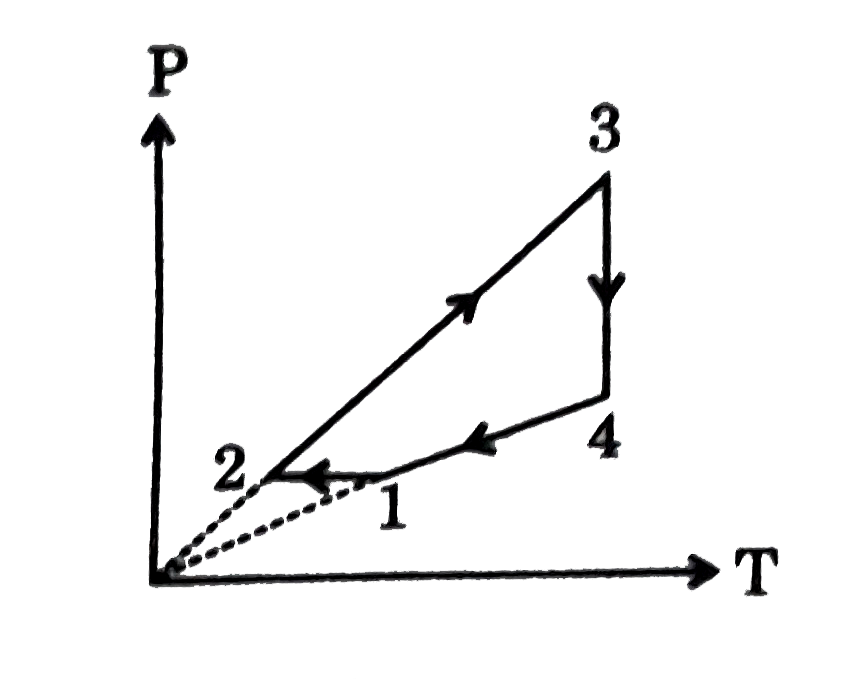
AincreasesBdecreasesCremains constantDdata insuficientConsider the following (P-T) graph for a fixed mass of gas: Correct P-V graph as:
 A
A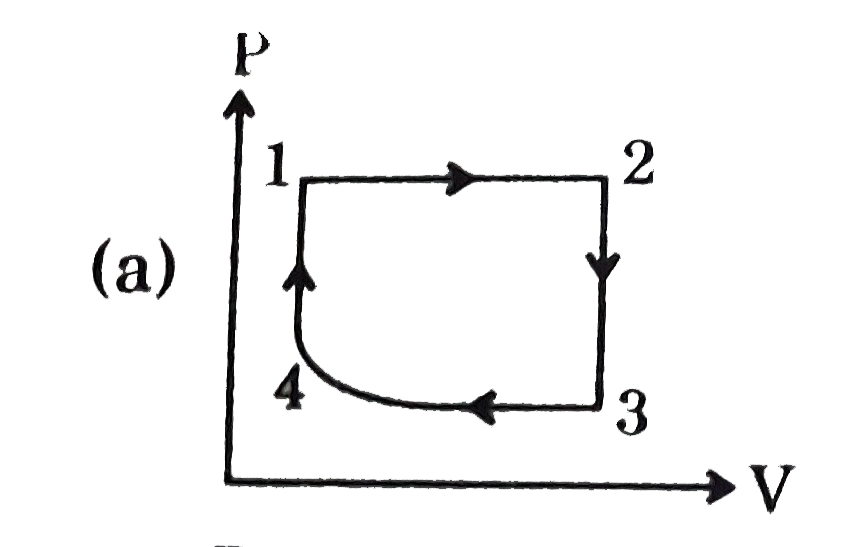 B
B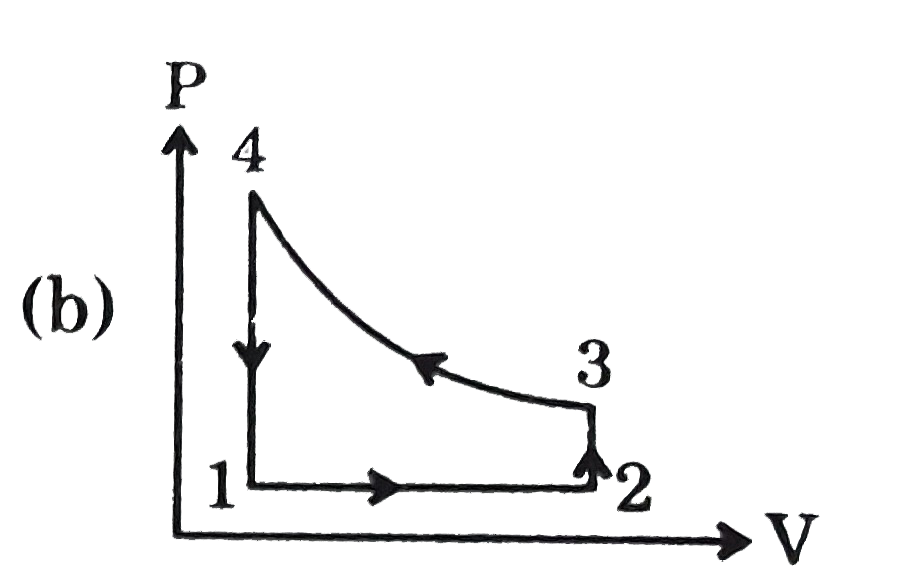 C
C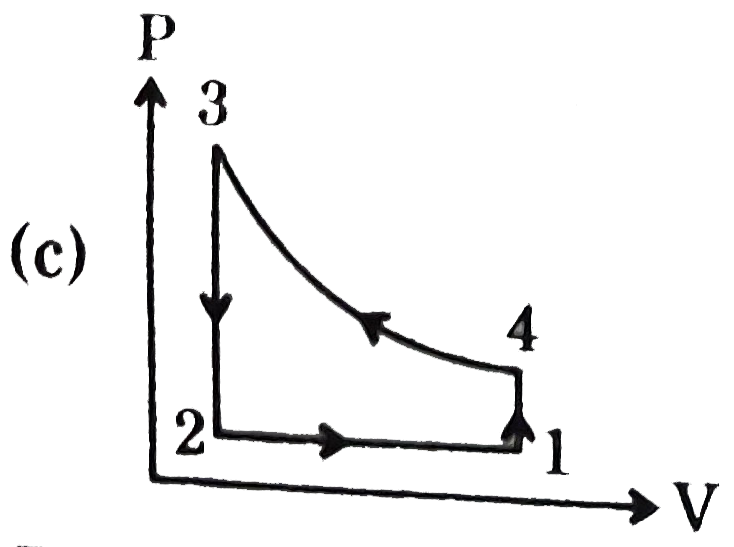 D
D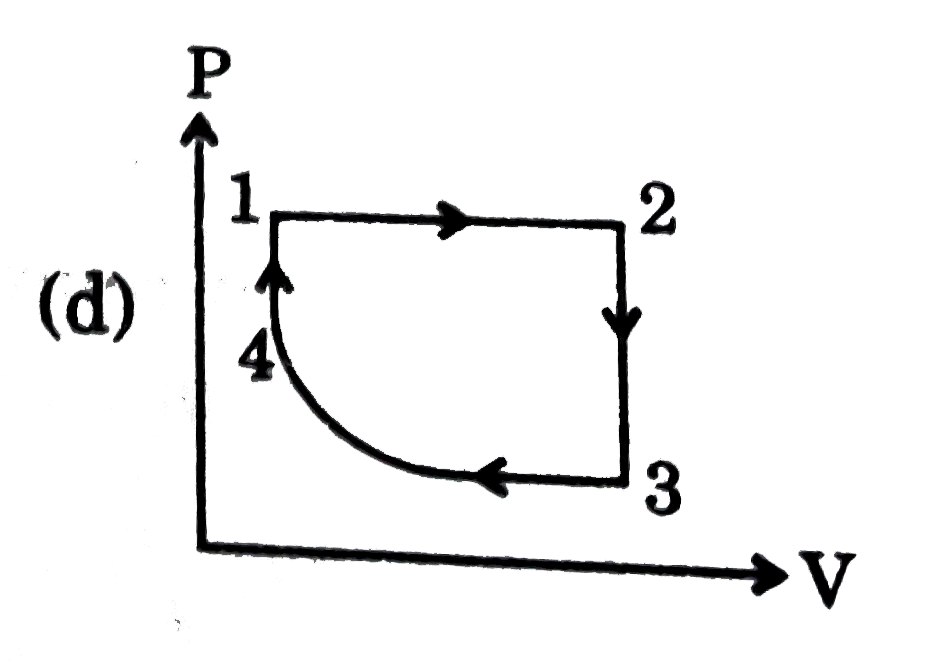
On the P−T graph of an ideal gas, choose the correct option(s):
AAdiabatic process will be a straight line.BIsochoric process will be straight line passing through the origin.Cadiabatic curve will have a positive slope.Dthe slope of adiabatic curve is proportional T.
Figure shows volume - temperature (V-T) graph for same mass of an ideal gas at two different pressures P1and P2. Hence
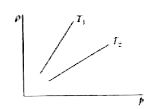
View SolutionFigure shows graphs of pressure versus density for an ideal gas at two temperatures T1 and T2 Then
View SolutionThe volume V versus temperature T graphs for a certain amount of a perfect gas at two pressure p1andp2 are as shown in Fig. Show that p1 is less than p2.

View SolutionOn the P−T graph of an ideal gas, choose the correct option(s):
View SolutionFor an ideal gas V−T curves at constant pressure P1 & P2 are shown in figure, from the figure
_E01_061_Q01.png)
View Solution
