Figure 6.19 shows the p-T graphs for a fixed mass of an ideal gas at volumes V1 and V2.Can it be concluded from the graphs that V1 is greater than V2?
pV=nRT=mMRT
or, p=mRMVT[ M=molecular weights]
So p-T graphs are straight lines passing through the origin,for any fixed V . The slope mRMV is smaller for a greater value of V. In fig.6.19 the slope for V1 is smaller than that for V2. So, V1>V2

Topper's Solved these Questions
- EXPANSION OF GASESBOOK - CHHAYA PUBLICATIONCHAPTER - EXPANSION OF GASESEXERCISE - EXERCISE (MULTIPLE CHOICE QUESTION)
20 Videos
- EXPANSION OF GASESBOOK - CHHAYA PUBLICATIONCHAPTER - EXPANSION OF GASESEXERCISE - EXERCISE (Very Short Answer Type Question)
6 Videos
- EXPANSION OF GASESBOOK - CHHAYA PUBLICATIONCHAPTER - EXPANSION OF GASESEXERCISE - CBSE Scanner
1 Videos
- ELASTICITY BOOK - CHHAYA PUBLICATIONCHAPTER - ELASTICITY EXERCISE - CBSE SCANNER
10 Videos
- EXPANSION OF SOLIDS AND LIQUIDSBOOK - CHHAYA PUBLICATIONCHAPTER - EXPANSION OF SOLIDS AND LIQUIDSEXERCISE - CBSE SCANNER
2 Videos
Similar Questions
The volume V versus temperature T graphs for a certain amount of a perfect gas at two pressure p1andp2 are as shown in Fig. It follows from the graphs that p1 is greater than p2.
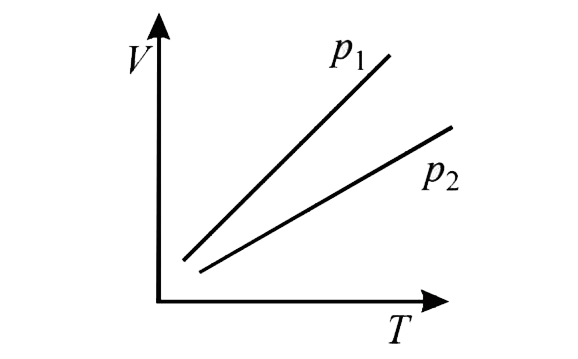
View SolutionThe volume V versus temperature T graphs for a cetain amount of a perfect gas at two pressure p1andp2 are as shown in Fig. It follows from the graphs that p1 is greater than p2.

View Solution
Knowledge Check
The P−T graph for the given mass of an ideal gas is shown in figure. Then the volume
_E01_022_Q01.png) AincreasesBdecreasesCremains constantDdata insuficient
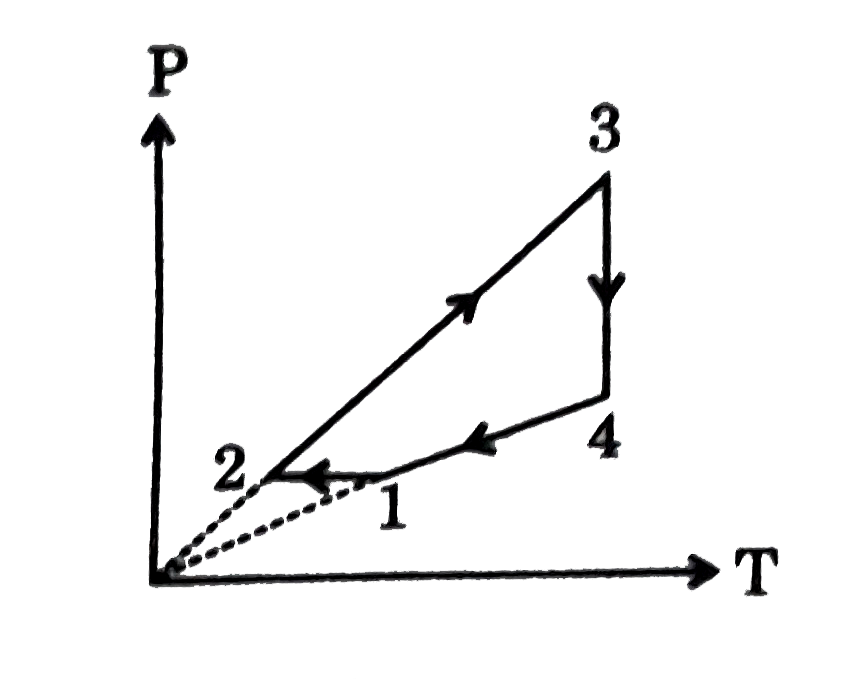
AincreasesBdecreasesCremains constantDdata insuficientConsider the following (P-T) graph for a fixed mass of gas: Correct P-V graph as:
 A
A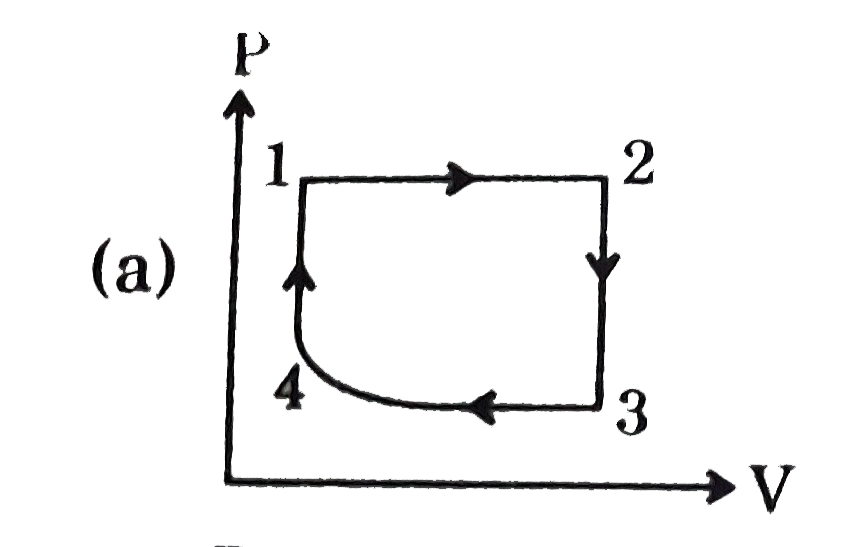 B
B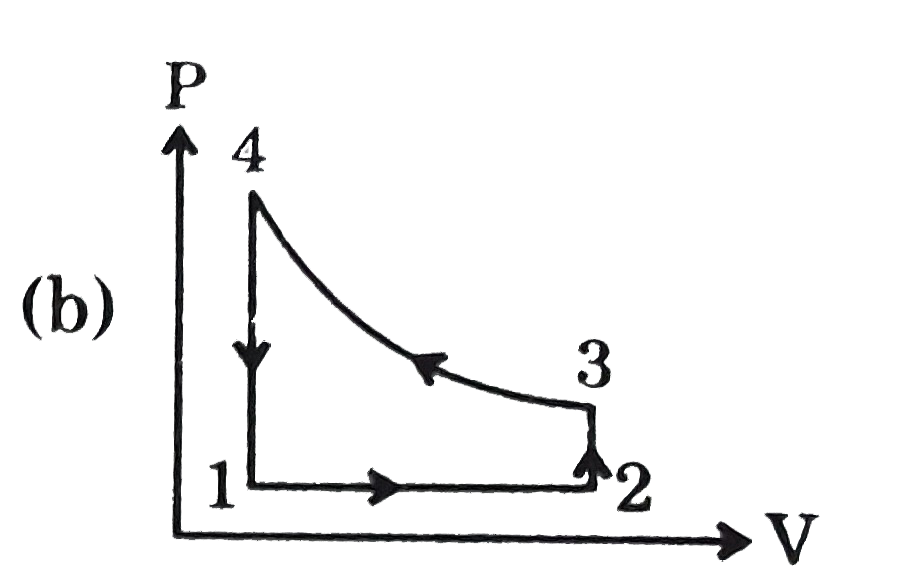 C
C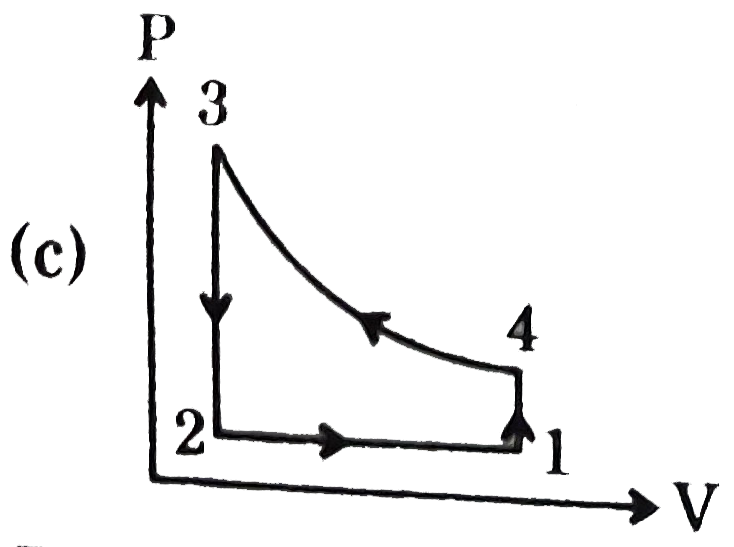 D
D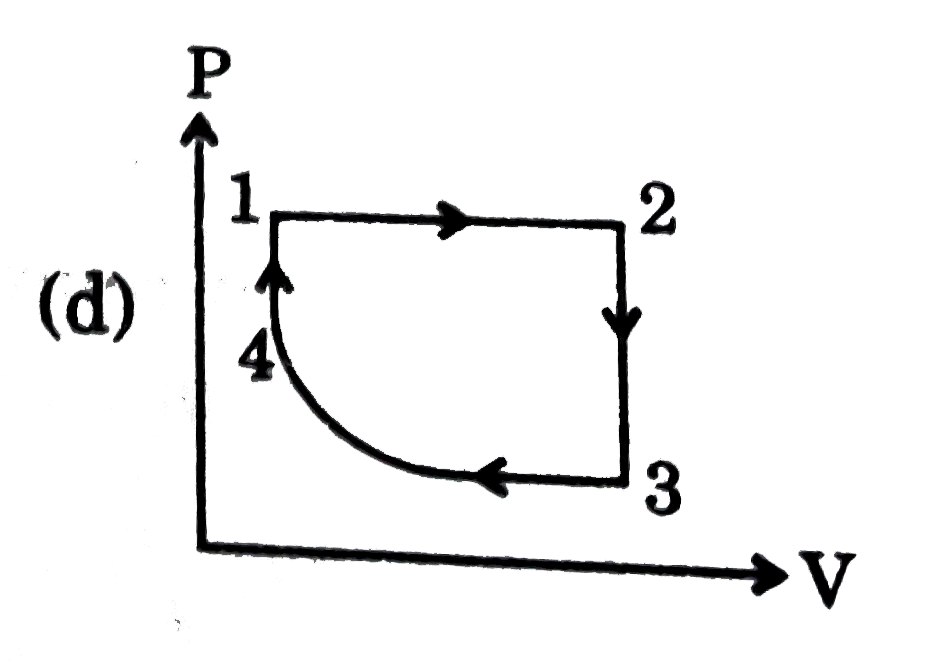
Figure shows the pressure P versus volume V graphs for a certains mass of a gas at two constant temperature T1andT2. Which of the following interface is correct?
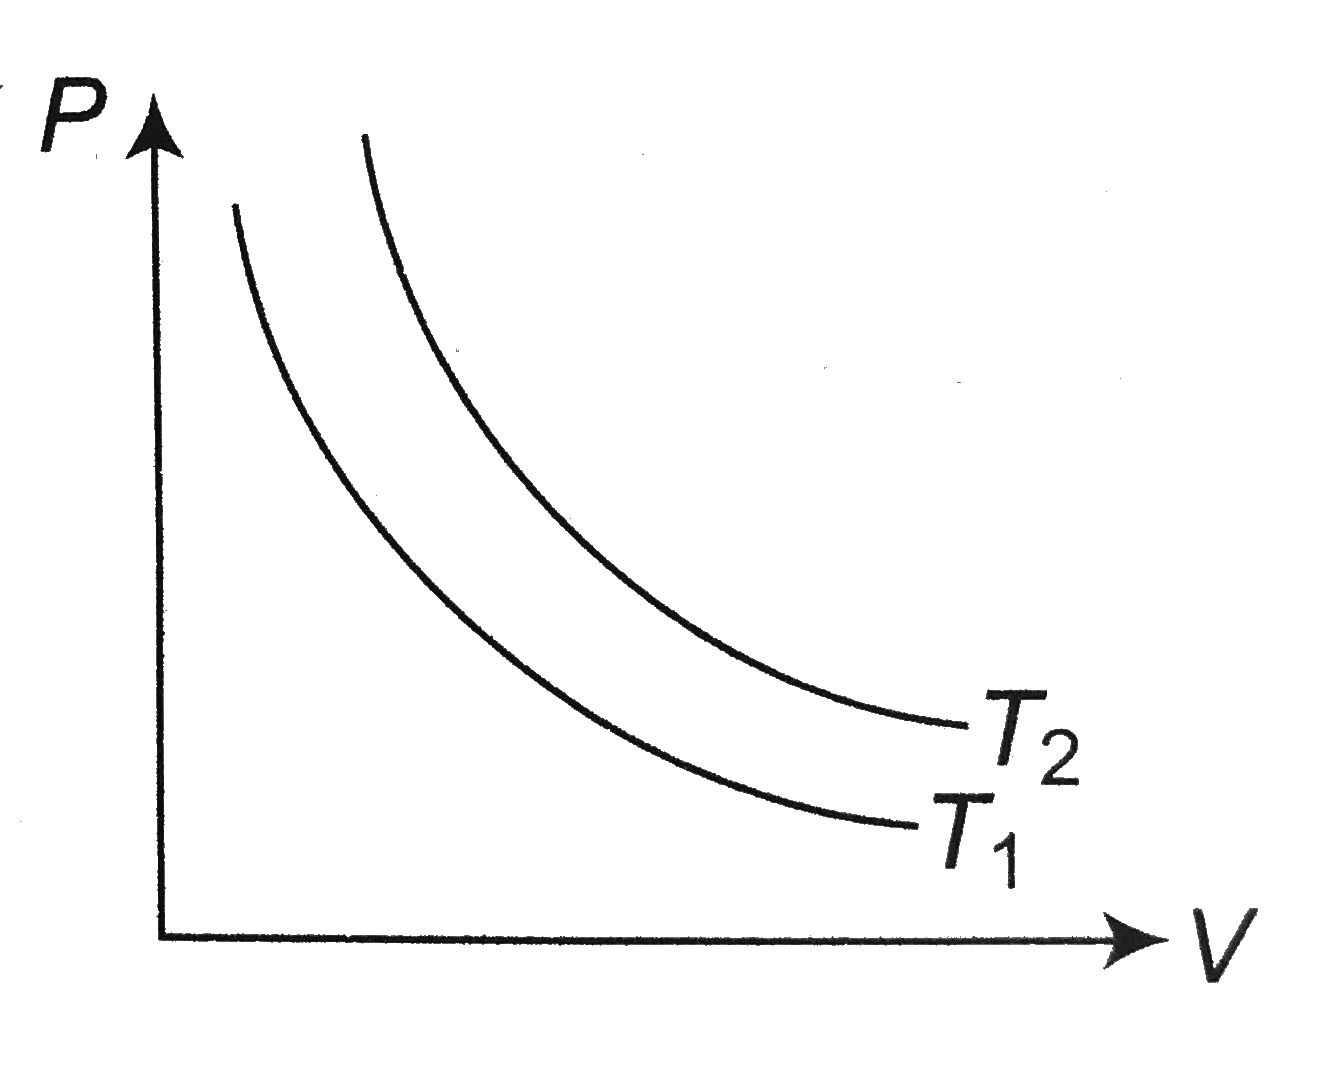 AT1=T2BT1>T2CT1<T2Dno inference can be drawn due to insufficient information
Figure shows volume - temperature (V-T) graph for same mass of an ideal gas at two different pressures P1and P2. Hence
View SolutionFigure shows a process for a given amount of an ideal gas. If volume in state 1 is V1 & in state 2 is V2, then
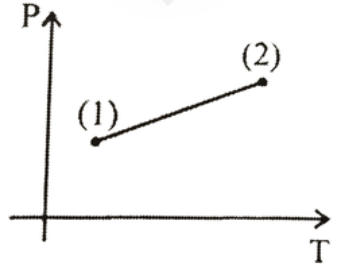
View SolutionThe volume V versus temperature T graphs for a certain amount of a perfect gas at two pressure p1andp2 are as shown in Fig. Show that p1 is less than p2.

View SolutionThe given figure shows the pressure-temperature (P-T) diagram for a fixed mass of an ideal gas undergoing cyclic process ABCA. The corresponding pressure-volume (P-V) graph for the given cyclic process will be
_PHY_E06_003.png)
View SolutionFor an ideal gas V−T curves at constant pressure P1 & P2 are shown in figure, from the figure
_E01_061_Q01.png)
View Solution
