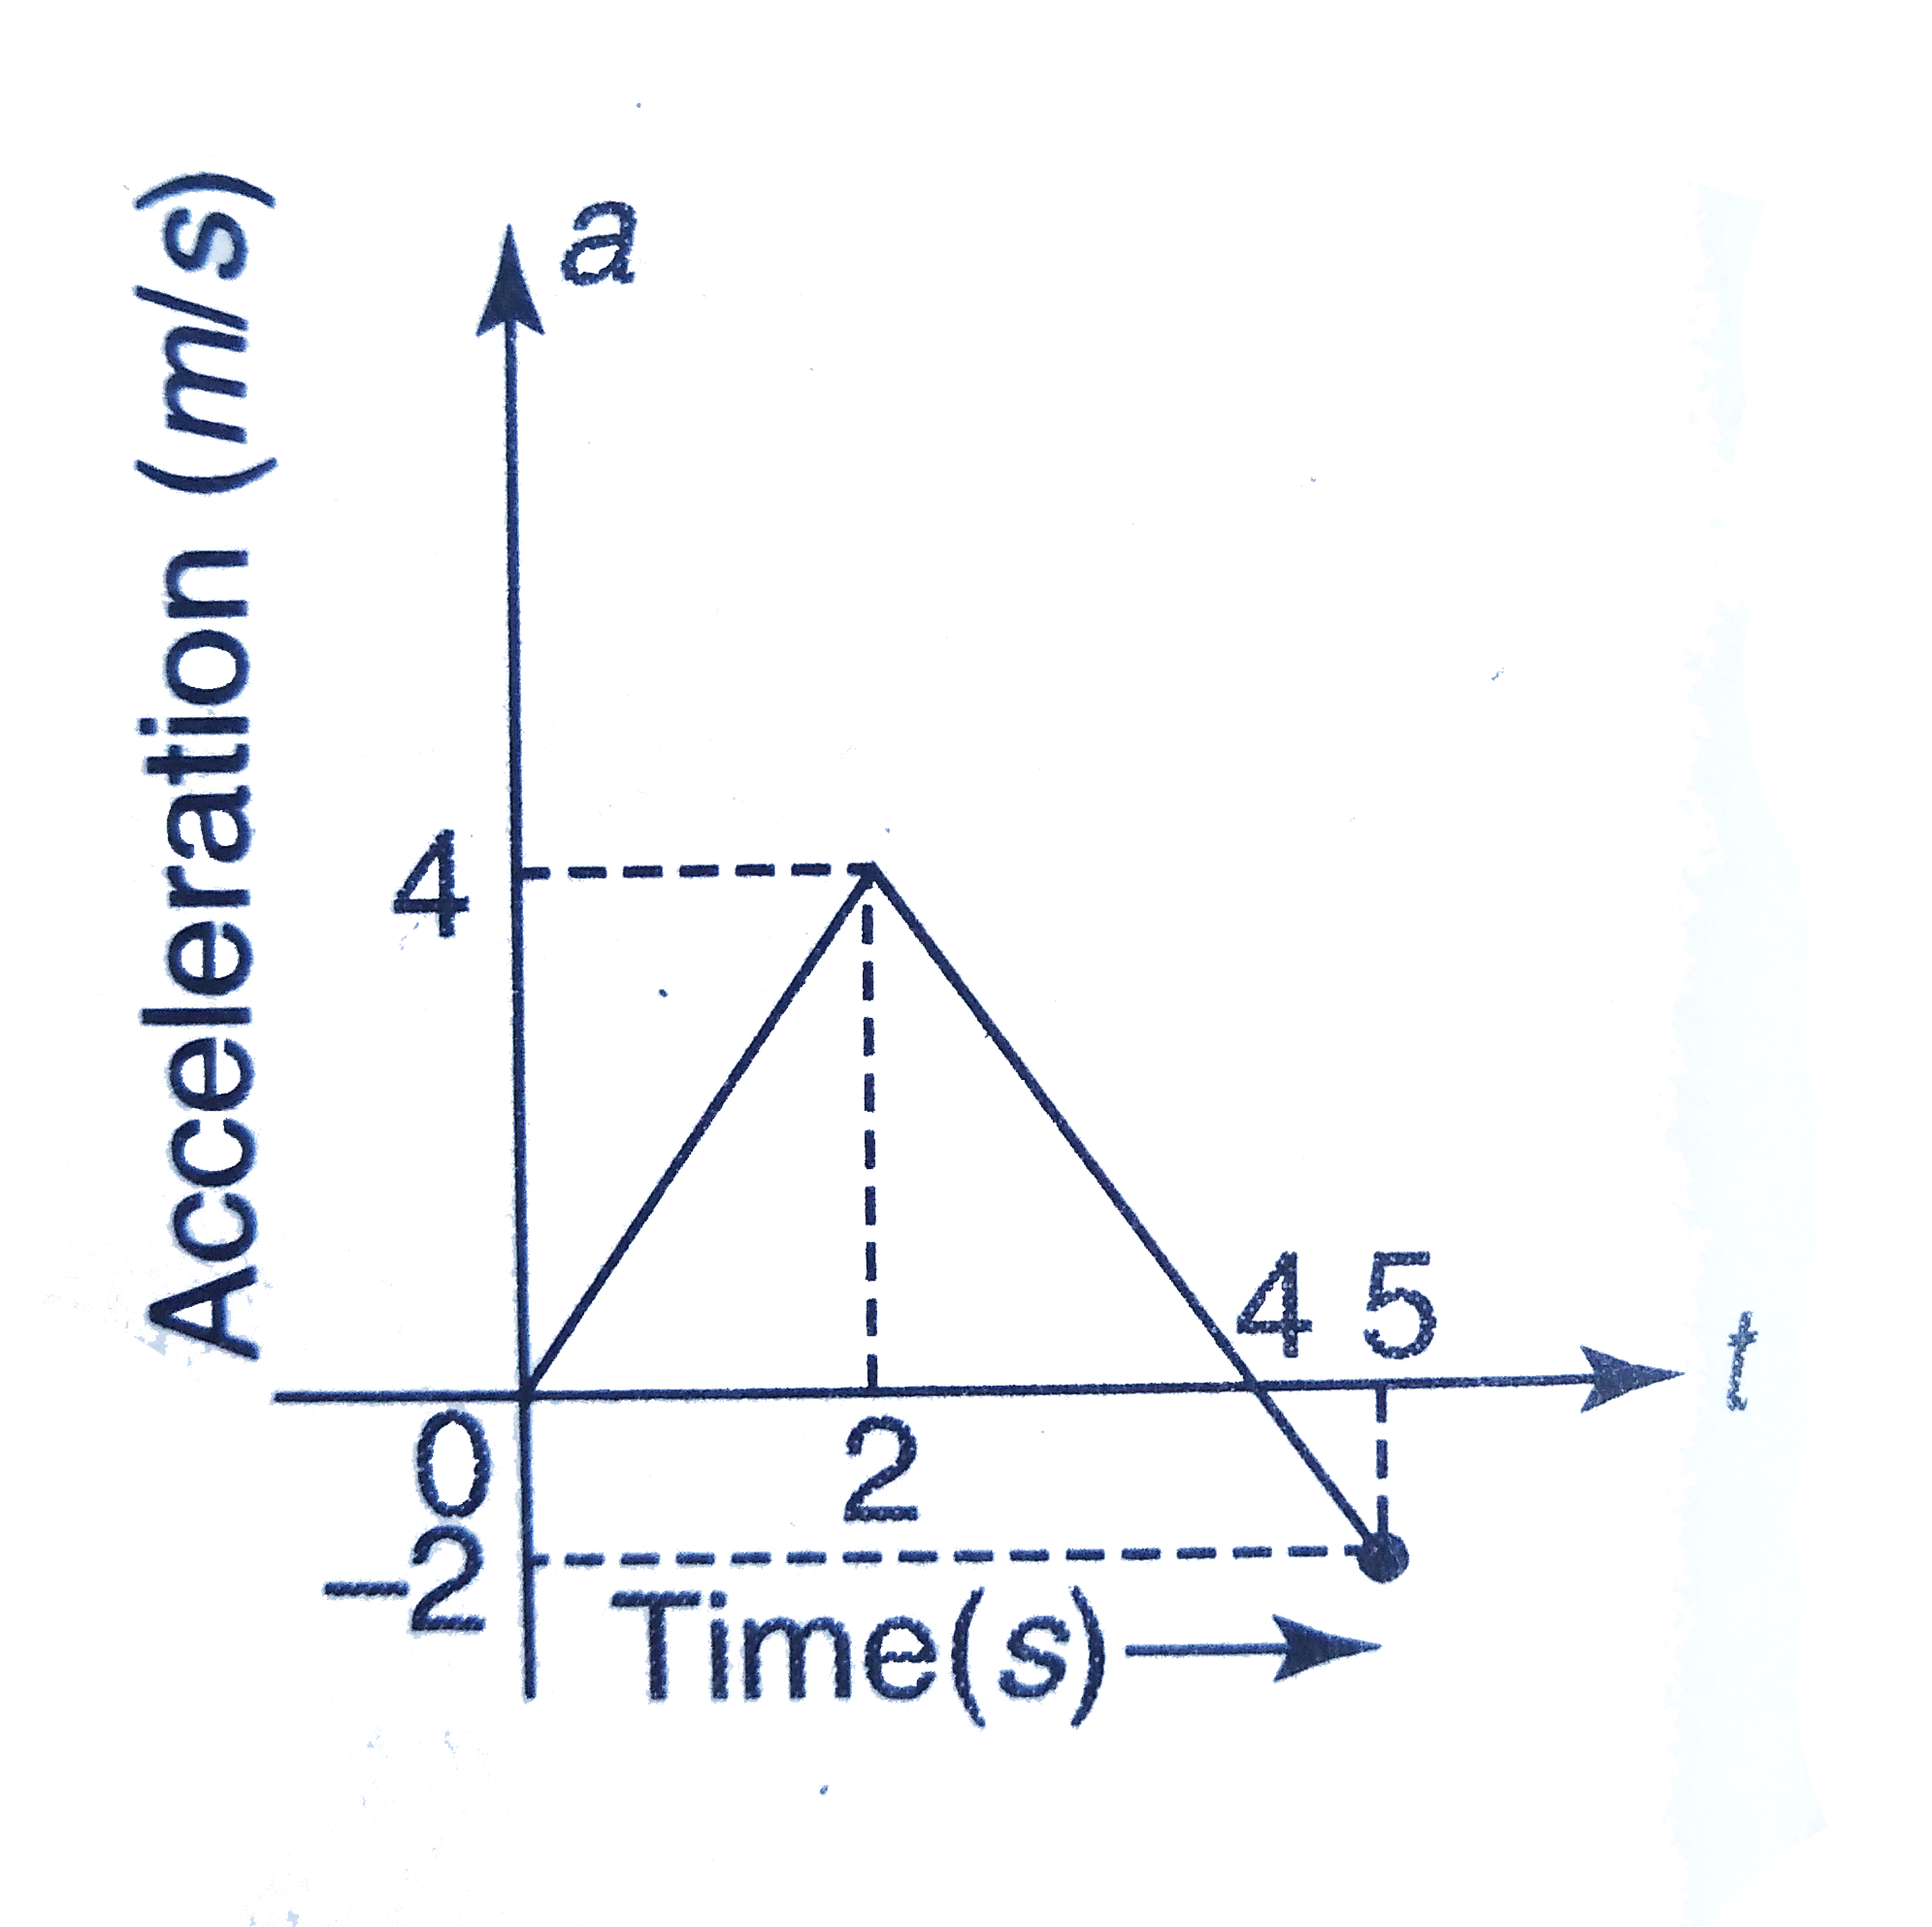
Figure shows the graph of acceleration of particle as a function of time. The maximum speed of the particle is (particle starts from rest).
7m/s
8m/s
4m/s
16m/s
The correct Answer is:B
Maximum speed will occur at t=4s, because till then a is positive. Now change in velocity is area under accleration time graph, so
v4s−0=12[4×4]=8⇒v4s=8m/s.
Topper's Solved these Questions
- BOOK - A2ZCHAPTER - GENERAL KINEMATICS AND MOTION IN ONE DIMENSIONEXERCISE - Problem Based On Mixed Concepts30videos
GENERAL KINEMATICS AND MOTION IN ONE DIMENSION
- BOOK - A2ZCHAPTER - GENERAL KINEMATICS AND MOTION IN ONE DIMENSIONEXERCISE - Assertion Reasoning20videos
GENERAL KINEMATICS AND MOTION IN ONE DIMENSION
- BOOK - A2ZCHAPTER - GENERAL KINEMATICS AND MOTION IN ONE DIMENSIONEXERCISE - Relative Motion In One Dimension20videos
GENERAL KINEMATICS AND MOTION IN ONE DIMENSION
- BOOK - A2ZCHAPTER - FLUID MECHANICSEXERCISE - Chapter Test29videos
FLUID MECHANICS
- BOOK - A2ZCHAPTER - GRAVITATIONEXERCISE - Chapter Test29videos
GRAVITATION
Similar Questions
A particle moves in the x-y plane according to the law x=t2, y = 2t. Find:
(a) velocity and acceleration of the particle as a function of time,
(b) the speed and rate of change of speed of the particle as a function of time,
(c) the distance travelled by the particle as a function of time.
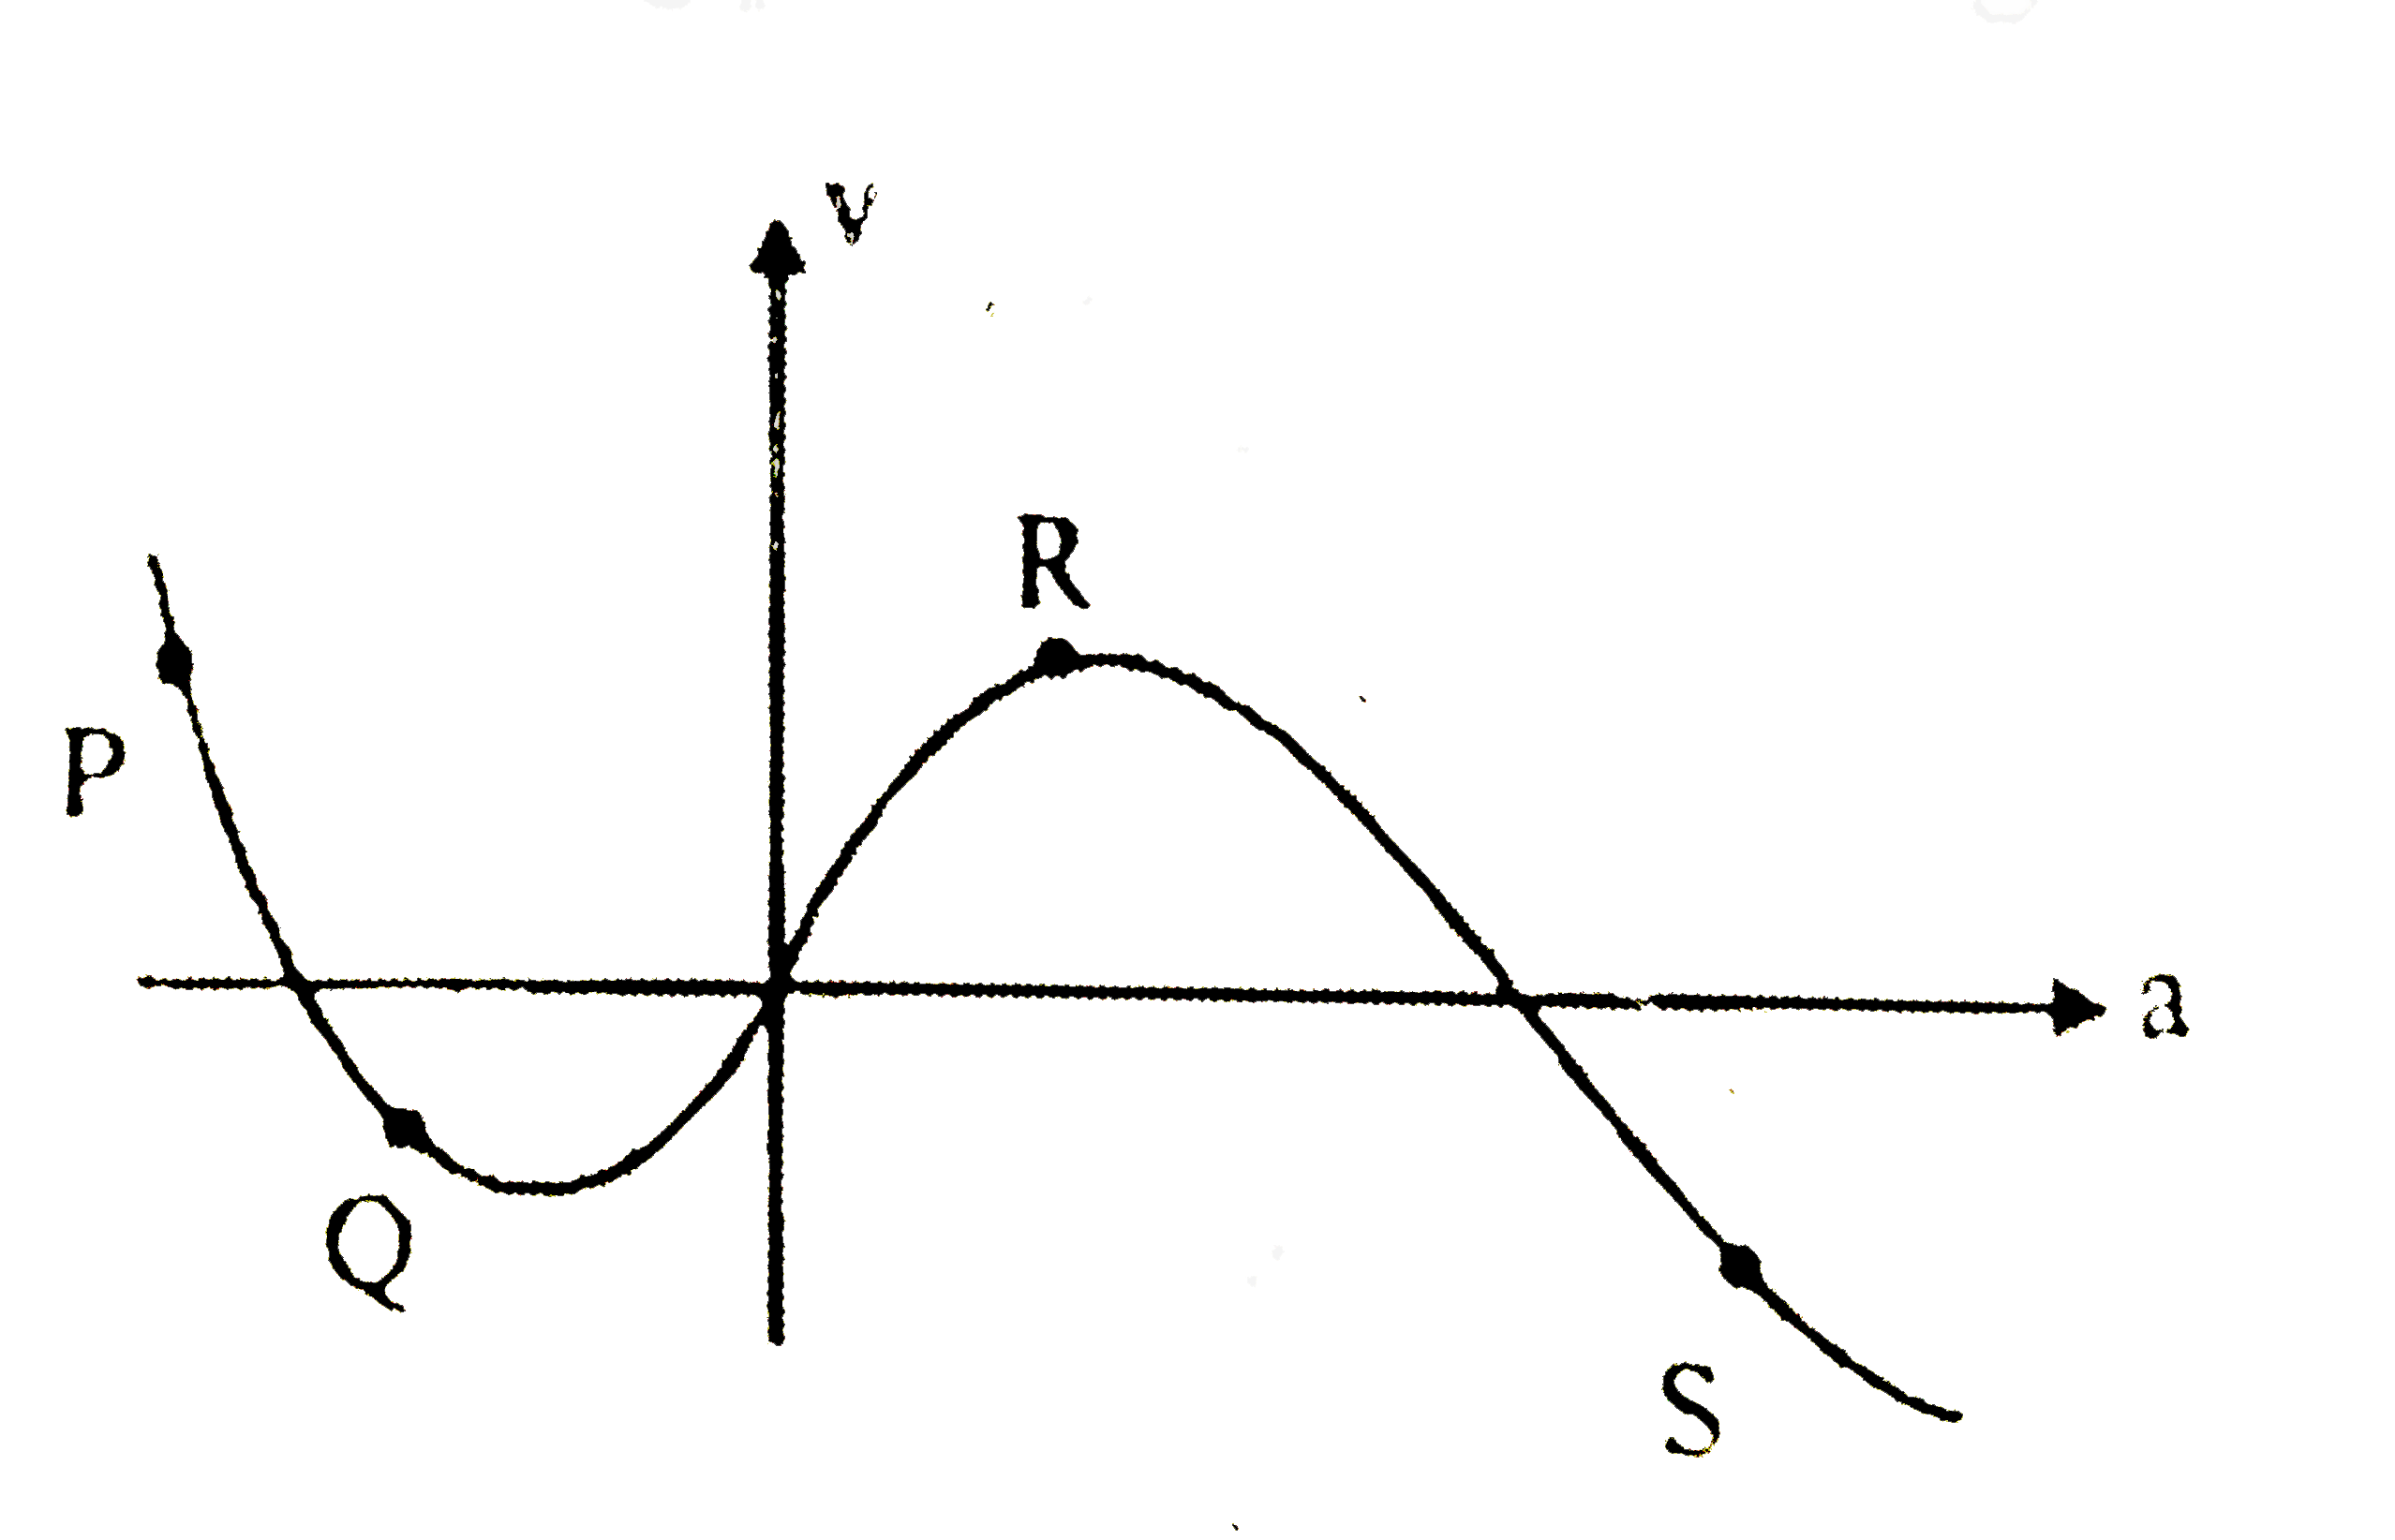
(d) the radius of curvature of the particle as a function of time.View SolutionAcceleration-velocity graph of a moving particle is shown in figure. The particle is
 View Solution
Knowledge Check
- Question 1 - Select One
The figure shows a velocity-time graph of a particle moving along a straight line
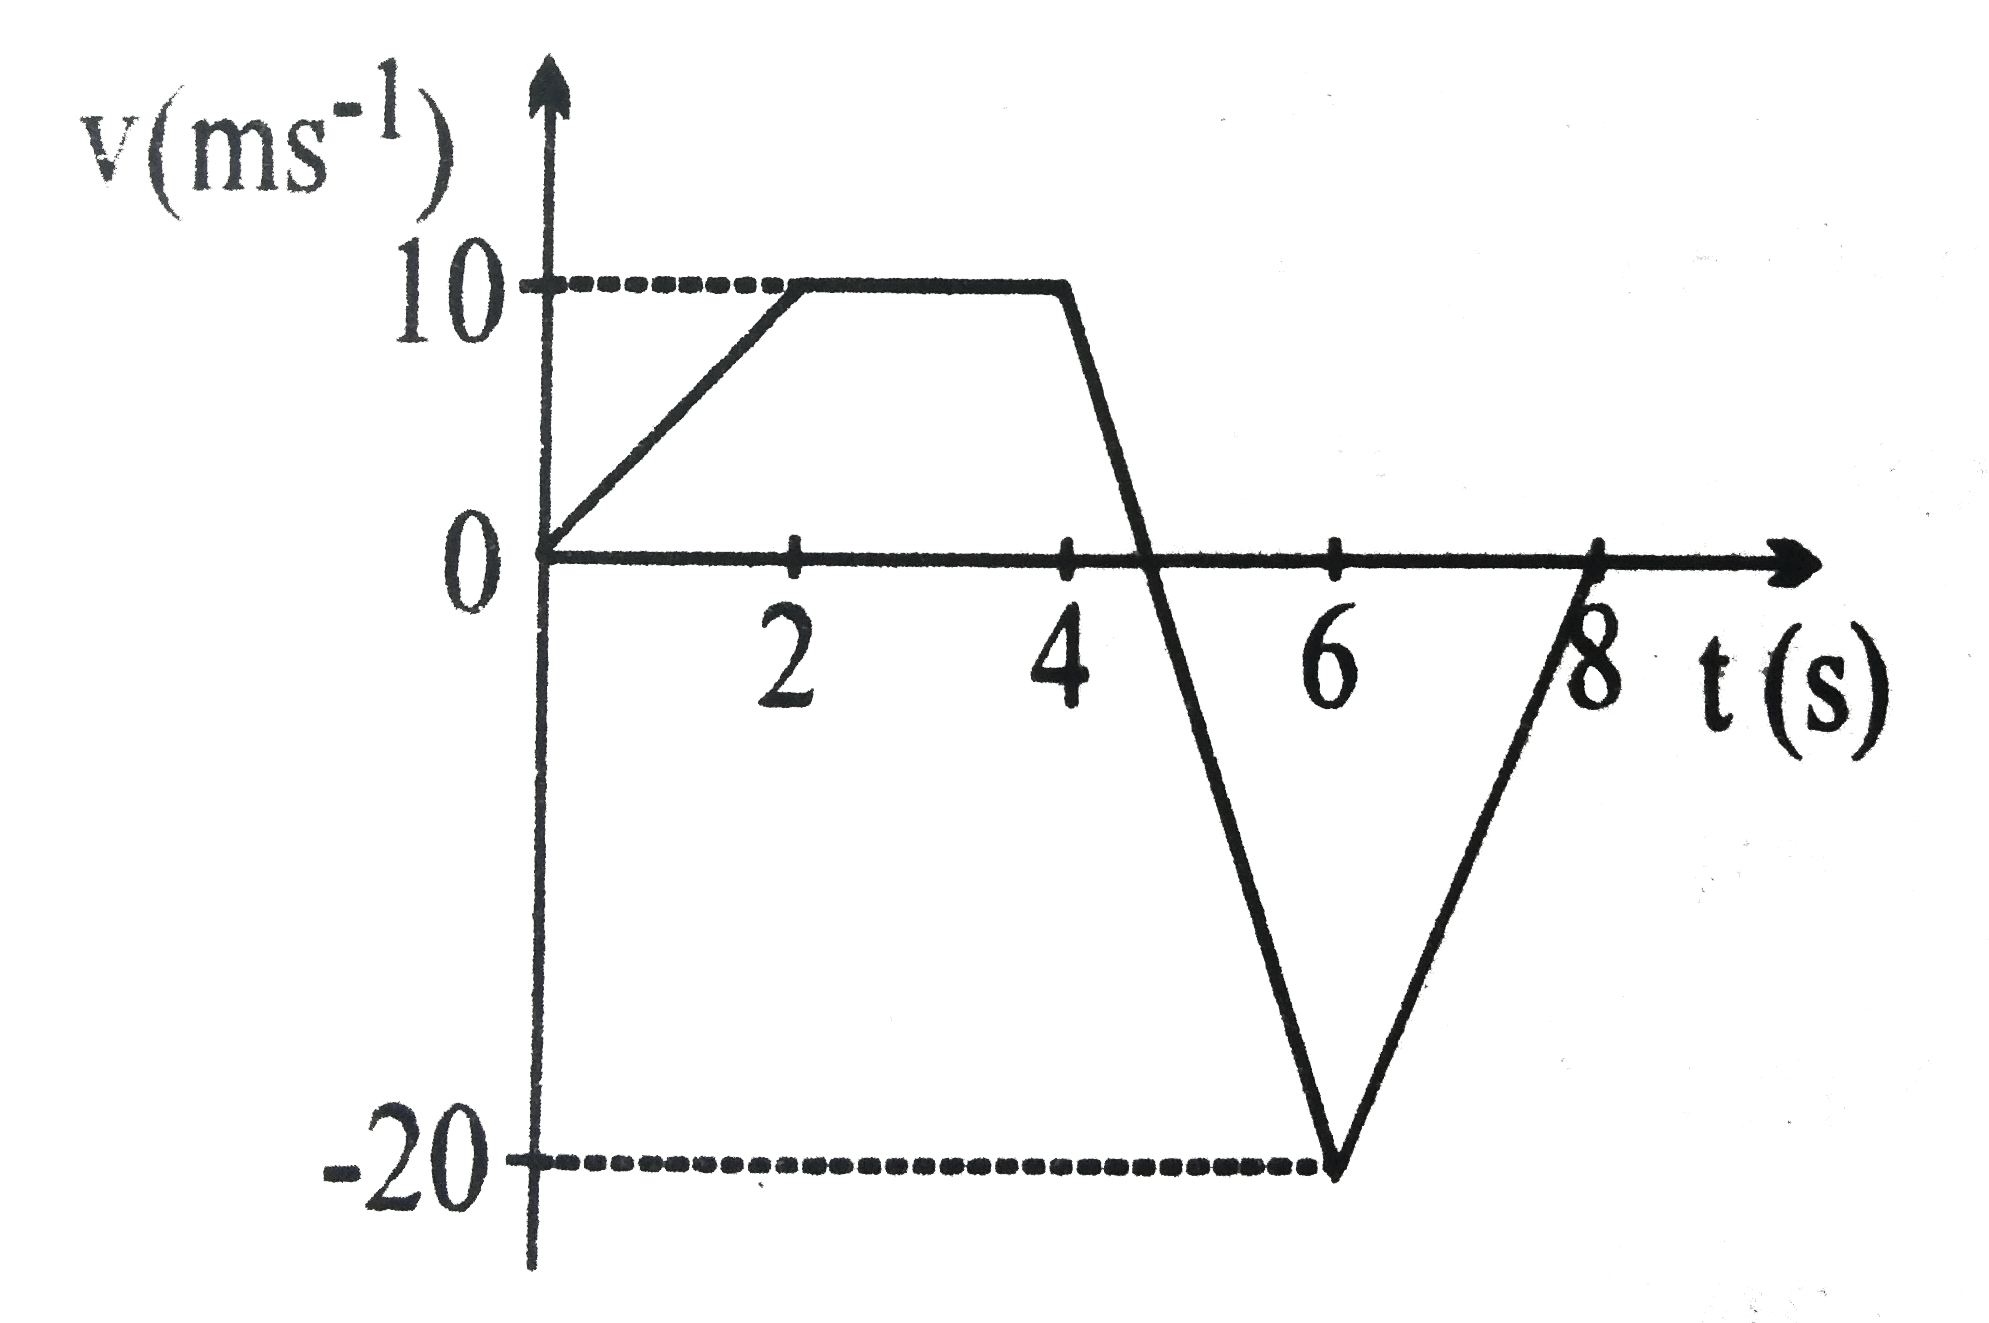
The maximum displacement of the particle isA33.3mB23.3mC18.3mDzero - Question 2 - Select One
A graph of acceleration versus time of a particle starting from rest at t =0 is shown. The speed of the particle at t=14 second is
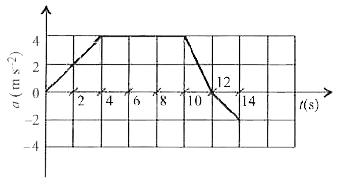 A2ms−1B34ms−1C20ms−1D42ms−1
 - Question 3 - Select One
The figure shows a velocity-time graph of a particle moving along a straight line
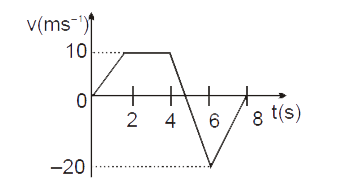
The maximum of displacement of the particle isA33.3 mB23.3 mC18.3Dzero
The figure shows a velocity-time graph of a particle moving along a straight line
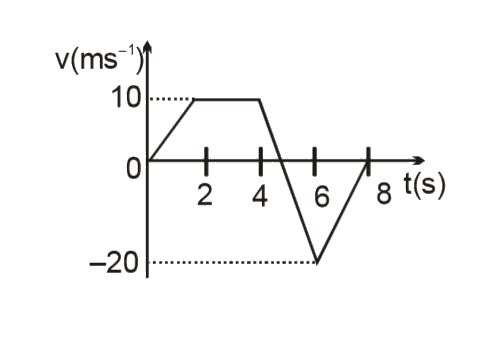
Q. The maximum of displacement of the particle isView SolutionA graph of acceleration versus time of a particle starting from rest at t=0 is as shown in figure. The speed of the particle at t=14s is
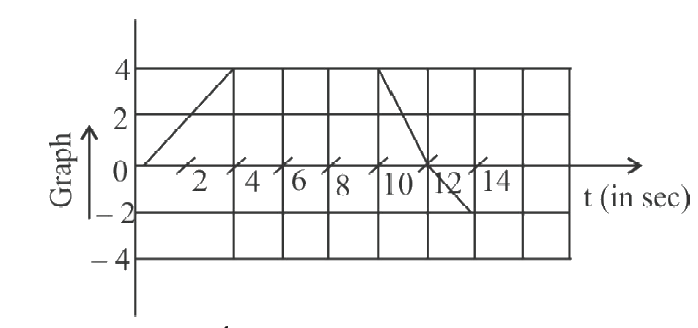 View Solution
Which of the graph shows that the particle is at rest .
View SolutionStarting from rest, acceleration of a particle is a=2t(t−1). The velocity of the particle at t=5s is
View SolutionA particle is executing SHM. Then the graph of acceleration as a function of displacement is
View Solution

