Graph shows the variation of the number of radioactive atoms left undecayed with time. Find the time corresponding to N=N0/3 ?
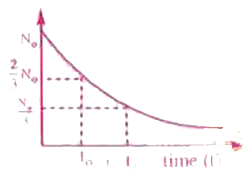
We know that N=N0e−λt
2N03=N0e−λt0⇒eλt0=32⇒λt0=ln (3/2) ......(1)
Also , N03=N0e−λt1⇒λt1=ln3
⇒t1=1λln(2)=t0ln(3)ln(3/2) [From (i)]
Similar Questions
Draw a graph showing the variation of decay rate (−dNdt) with number (N) of radioactive nuclei.
View SolutionA sample of a radioactive nucleus A disintegrates to another radioactive nucleus B, which in turn disintegrates to some other stable nucleus C. Plot of a graph showing the variation of number of atoms of nucleus B vesus time is : (Assume that at t = 0, there are no B atoms in the sample)
View Solution
Knowledge Check
- Question 1 - Select One
If N0andN are the number of radioactive particles at time t=0andt=t, then
Aλ=1tlogN0NBλ=2.303tlogNN0Cλ=t2.303logN0NDλ=2.303tlogN0N - Question 2 - Select One
The graph between number of decayed atoms N' of a radioactive element and time t is.
A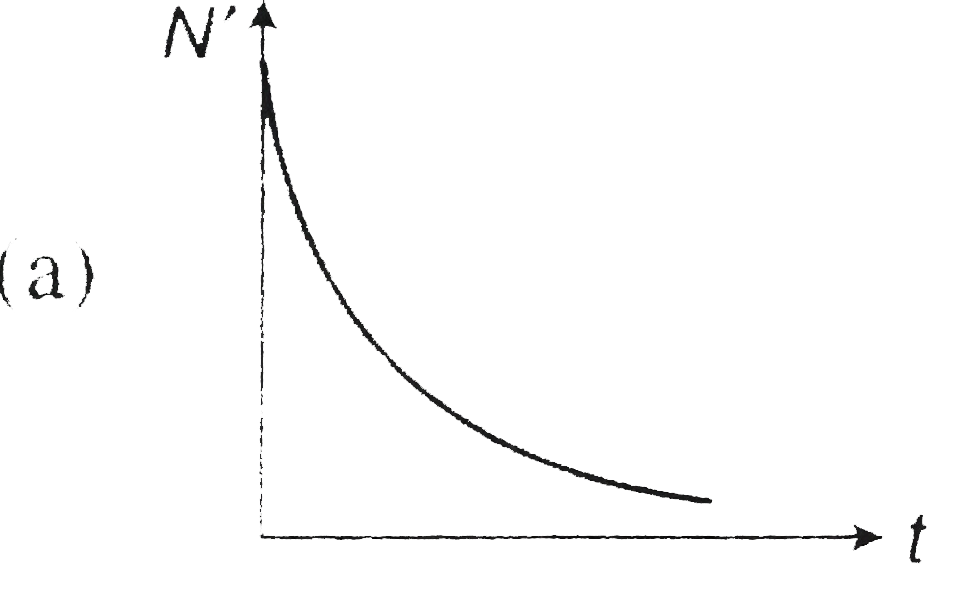 .B
.B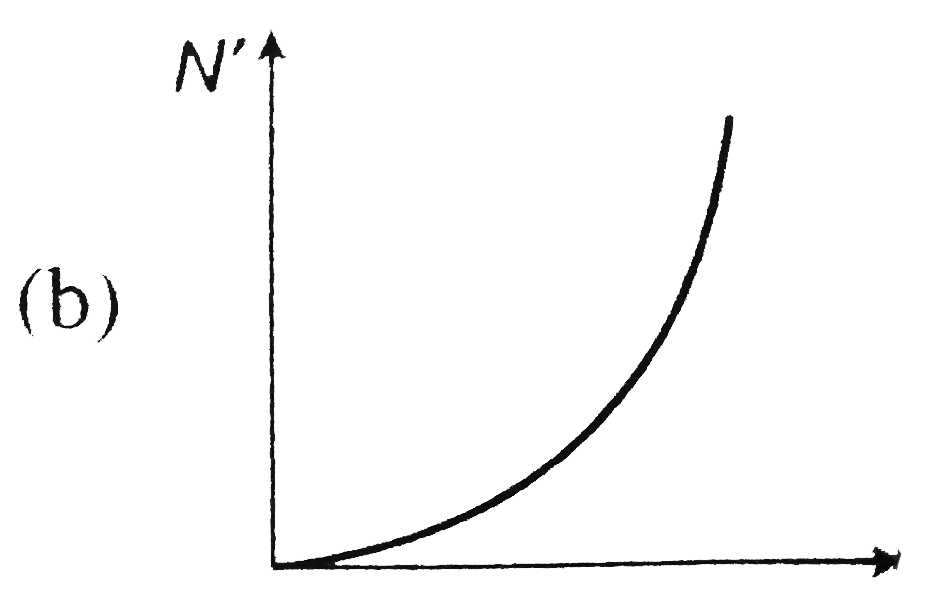 .C
.C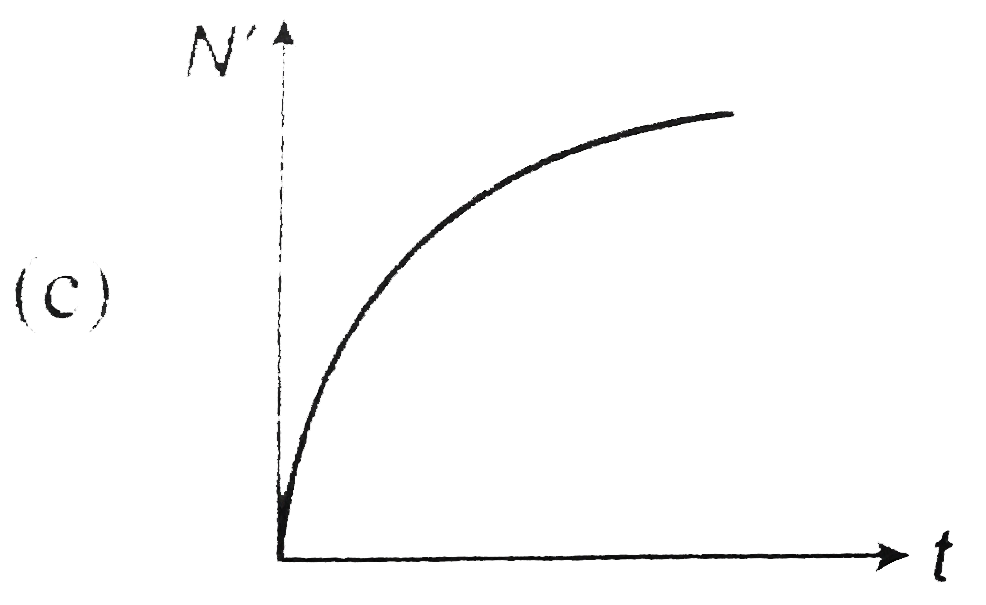 .D
.D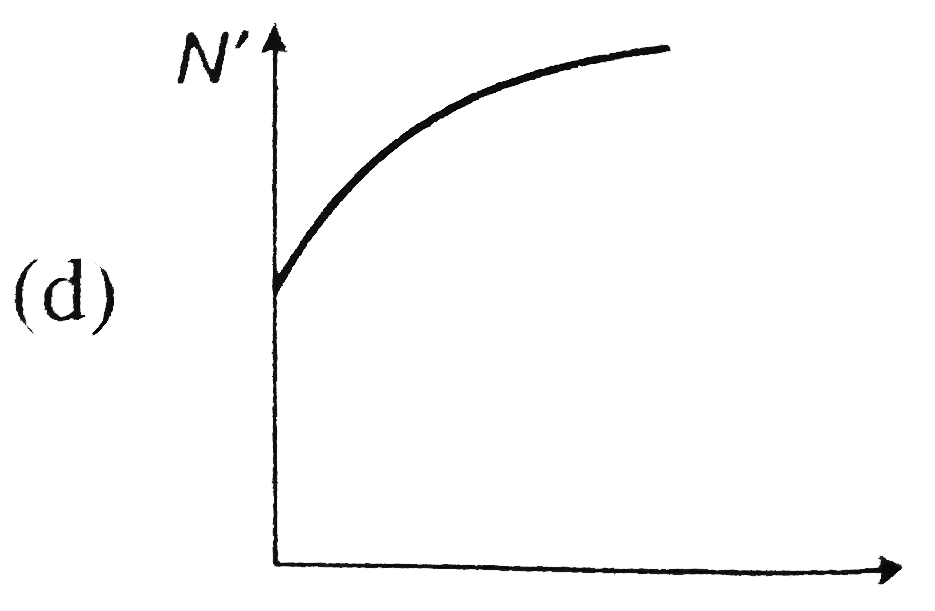 .
. - Question 3 - Select One
Which of the following graphs represents the variation of activity (A) of a radioactive substance with time (t).
A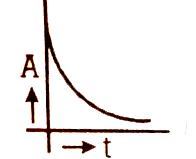 B
B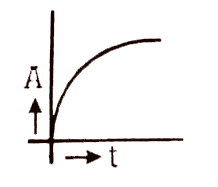 C
C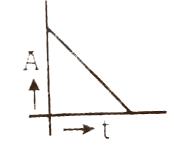 D
D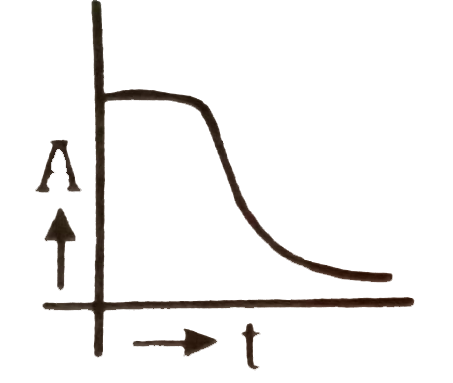
In a radioactive sample, the fraction of initial number of redioactive nuclie, which remains undecayed after n mean lives is
View SolutionThe graph between the instantaneous concentration (N) of a radioactive element and time (t) is.
View SolutionIn a radioactive sample, the fraction of initial number of redioactive nuclie, which remains undecayed after n mean lives is
View SolutionThe graph between the instantaneous concentration (N) of a radioactive element and time (t) is.
View SolutionIf 'f' denotes the ratio of the number of nuclei decayed (Nd) to the number of nuclei at t=0(N0) then for a collection of radioactive nuclei, the rate of change of 'f' with respect to time is given as :
[λ is the radioactive decay constant]View Solution

