In SHM of a particle, draw graphs showing variation in acceleration with time. Hence discuss the phase relationship between them using proper equations.
To solve the problem of drawing the graph showing the variation of acceleration with time in Simple Harmonic Motion (SHM) and discussing the phase relationship between displacement, velocity, and acceleration, we can follow these steps:
Step 1: Understand the Basic Equations of SHM
In SHM, the displacement x of a particle can be expressed as:
x(t)=Asin(ωt)
where:
- A is the amplitude,
- ω is the angular frequency,
- t is time.
Step 2: Derive the Velocity Equation
To find the velocity v, we differentiate the displacement with respect to time t:
v(t)=dxdt=ddt(Asin(ωt))=Aωcos(ωt)
Step 3: Derive the Acceleration Equation
Next, we find the acceleration a by differentiating the velocity:
a(t)=dvdt=ddt(Aωcos(ωt))=−Aω2sin(ωt)
Step 4: Analyze the Phase Relationship
From the equations derived:
- Displacement: x(t)=Asin(ωt)
- Velocity: v(t)=Aωcos(ωt)=Aωsin(ωt+π2)
- Acceleration: a(t)=−Aω2sin(ωt)=Aω2sin(ωt+π)
Phase Relationships:
- The phase difference between displacement and velocity is π2 (or 90 degrees).
- The phase difference between velocity and acceleration is π2 (or 90 degrees).
- The phase difference between displacement and acceleration is π (or 180 degrees).
Step 5: Draw the Acceleration vs. Time Graph
To draw the graph of acceleration a(t) vs. time t:
1. The equation a(t)=−Aω2sin(ωt) indicates that the acceleration is a sine wave but inverted due to the negative sign.
2. At t=0, a(0)=0.
3. The maximum negative acceleration occurs at t=T4 (where T is the time period).
4. The graph will oscillate between −Aω2 and 0, repeating every T.
Step 6: Label the Graph
- The x-axis represents time t.
- The y-axis represents acceleration a(t).
- The graph starts at the origin (0, 0), reaches its maximum negative value, returns to zero, reaches maximum positive value, and returns to zero, completing one full cycle in time T.
Summary of Phase Relationships
- Displacement and Velocity: Phase difference = π2
- Velocity and Acceleration: Phase difference = π2
- Displacement and Acceleration: Phase difference = π
In SHM, the displacement x of a particle can be expressed as:
x(t)=Asin(ωt)
where:
- A is the amplitude,
- ω is the angular frequency,
- t is time.
To find the velocity v, we differentiate the displacement with respect to time t:
v(t)=dxdt=ddt(Asin(ωt))=Aωcos(ωt)
Next, we find the acceleration a by differentiating the velocity:
a(t)=dvdt=ddt(Aωcos(ωt))=−Aω2sin(ωt)
From the equations derived:
- Displacement: x(t)=Asin(ωt)
- Velocity: v(t)=Aωcos(ωt)=Aωsin(ωt+π2)
- Acceleration: a(t)=−Aω2sin(ωt)=Aω2sin(ωt+π)
- The phase difference between displacement and velocity is π2 (or 90 degrees).
- The phase difference between velocity and acceleration is π2 (or 90 degrees).
- The phase difference between displacement and acceleration is π (or 180 degrees).
To draw the graph of acceleration a(t) vs. time t:
1. The equation a(t)=−Aω2sin(ωt) indicates that the acceleration is a sine wave but inverted due to the negative sign.
2. At t=0, a(0)=0.
3. The maximum negative acceleration occurs at t=T4 (where T is the time period).
4. The graph will oscillate between −Aω2 and 0, repeating every T.
- The x-axis represents time t.
- The y-axis represents acceleration a(t).
- The graph starts at the origin (0, 0), reaches its maximum negative value, returns to zero, reaches maximum positive value, and returns to zero, completing one full cycle in time T.
- Displacement and Velocity: Phase difference = π2
- Velocity and Acceleration: Phase difference = π2
- Displacement and Acceleration: Phase difference = π
Topper's Solved these Questions
Similar Questions
Knowledge Check
- Question 1 - Select One
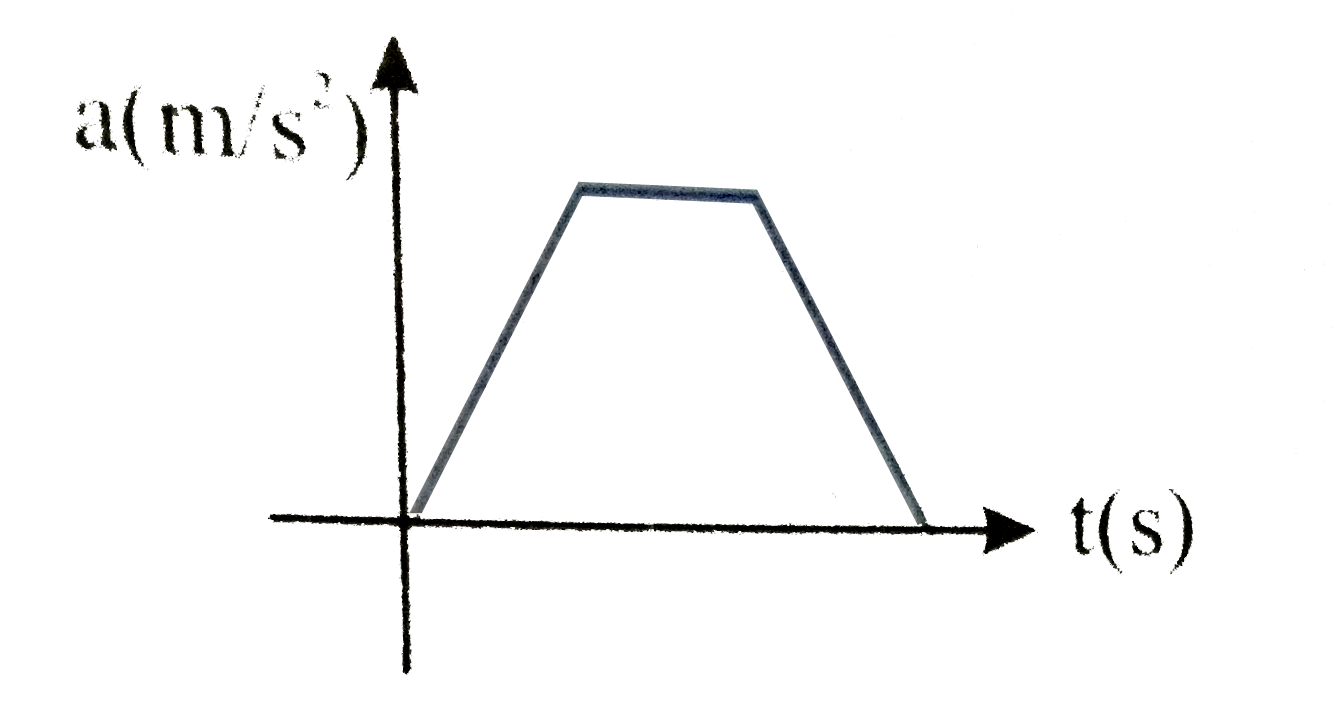
For a particle moving on a straight lint the variation of acceleration with time is given by the graph as shown. Initially the particle was at rest. Then the corresponding kinetic energy of the particle versus time graph will be
 .A
.A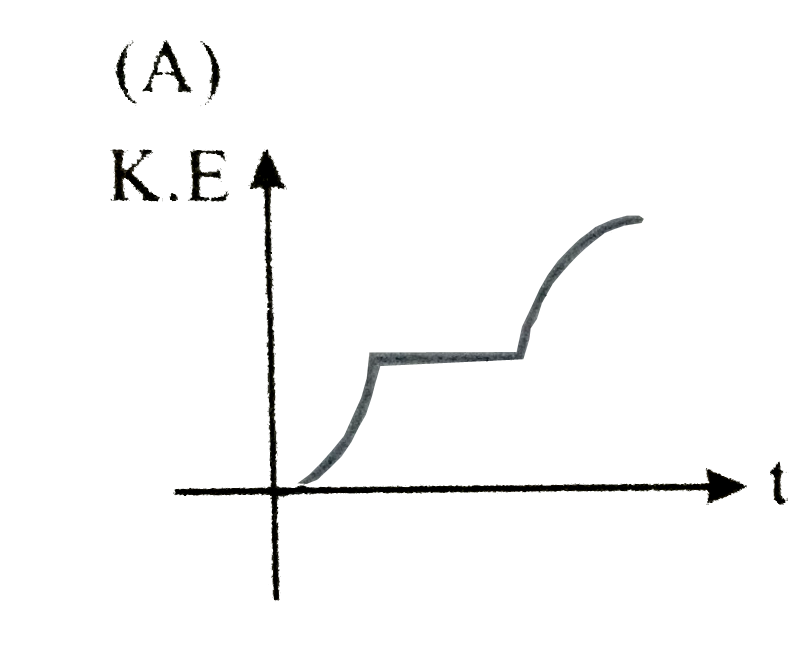 B
B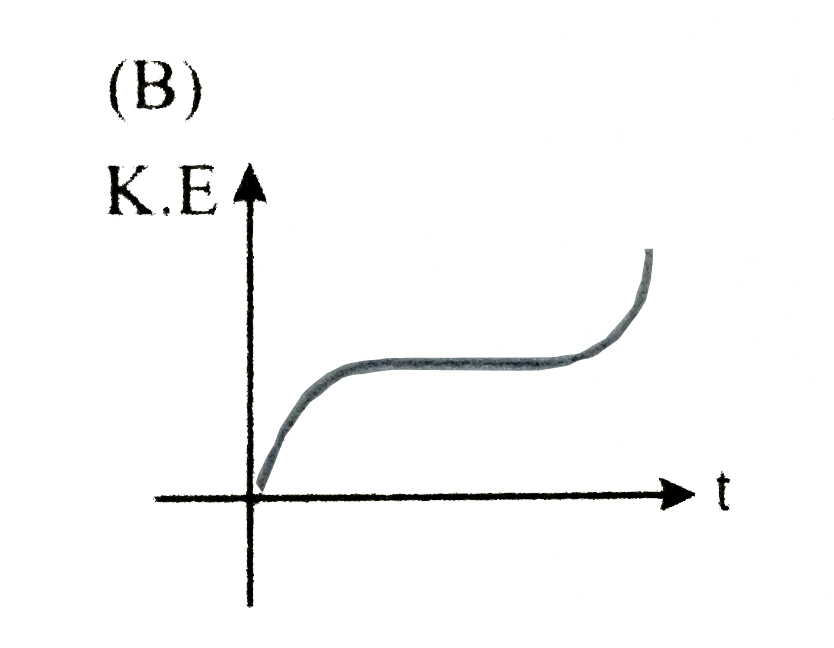 C
C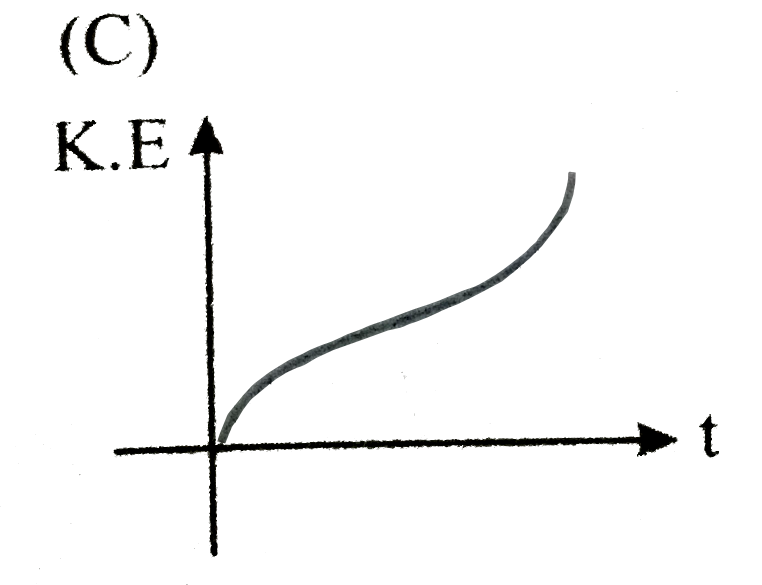 D
D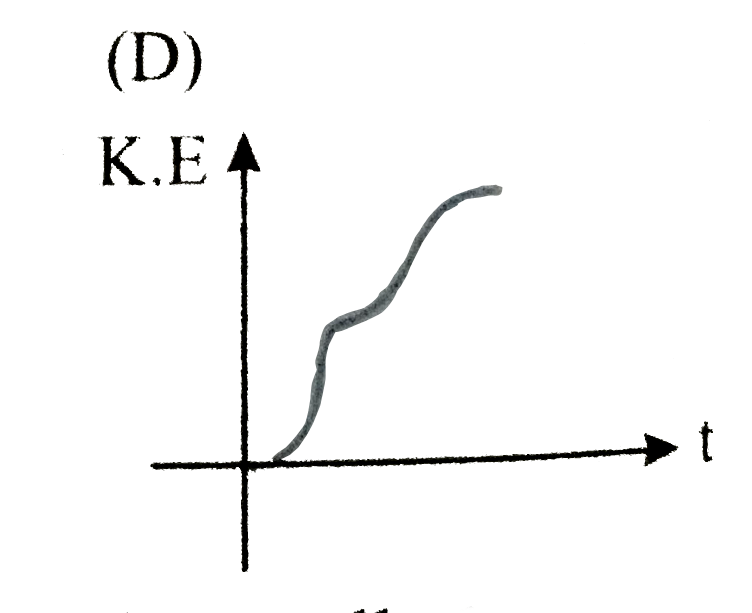
Draw graphs showing the variation of acceleration due to gravity with depth below the earth's surface.
View SolutionDraw graph showing variation of voltage and current with time over one cycle of ac.for X
View SolutionWhat is the phase relationship between diplacement, velocity and acceleration in SHM?
View SolutionWhat is the phase relationship between diplacement, velocity and acceleration in SHM?
View SolutionDraw a graph showing the variation of the gravitational acceleration due to the Earth with depth and altitude.
View SolutionA graph between velocity and displacement of a particle performing SHM is shown. Find the acceleration when the particle is at half of maximum displacement from mean position.
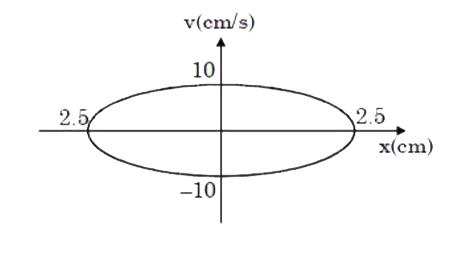 View Solution
A radioactive isotope X decays into a stable nucleus Y. Draw graphs showing the variation of rate of formation of Y versus time and the variation of population of Y versus time. Initial population of Y is zero.
View Solution

