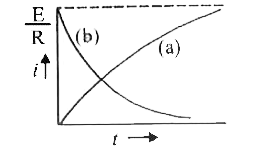
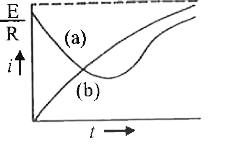
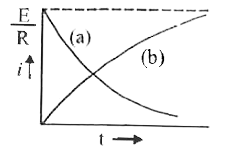
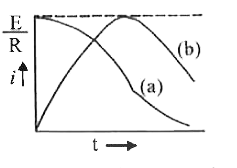
In the circuits (A) and (b) switches S1 and S2 are closed at t = 0 and are kept closed for a long time.The variation of current in the two circuits for t≥0 are roughly shown by figure (figures are schematic and not drawn to scale):

The correct Answer is:C
For capaciotr circuit, i=i0e−tRC
For inductor circuit, i=i0(1−e−RtL)
Hence graph (c) correctly depicts i versus t graph.
Topper's Solved these Questions
Similar Questions
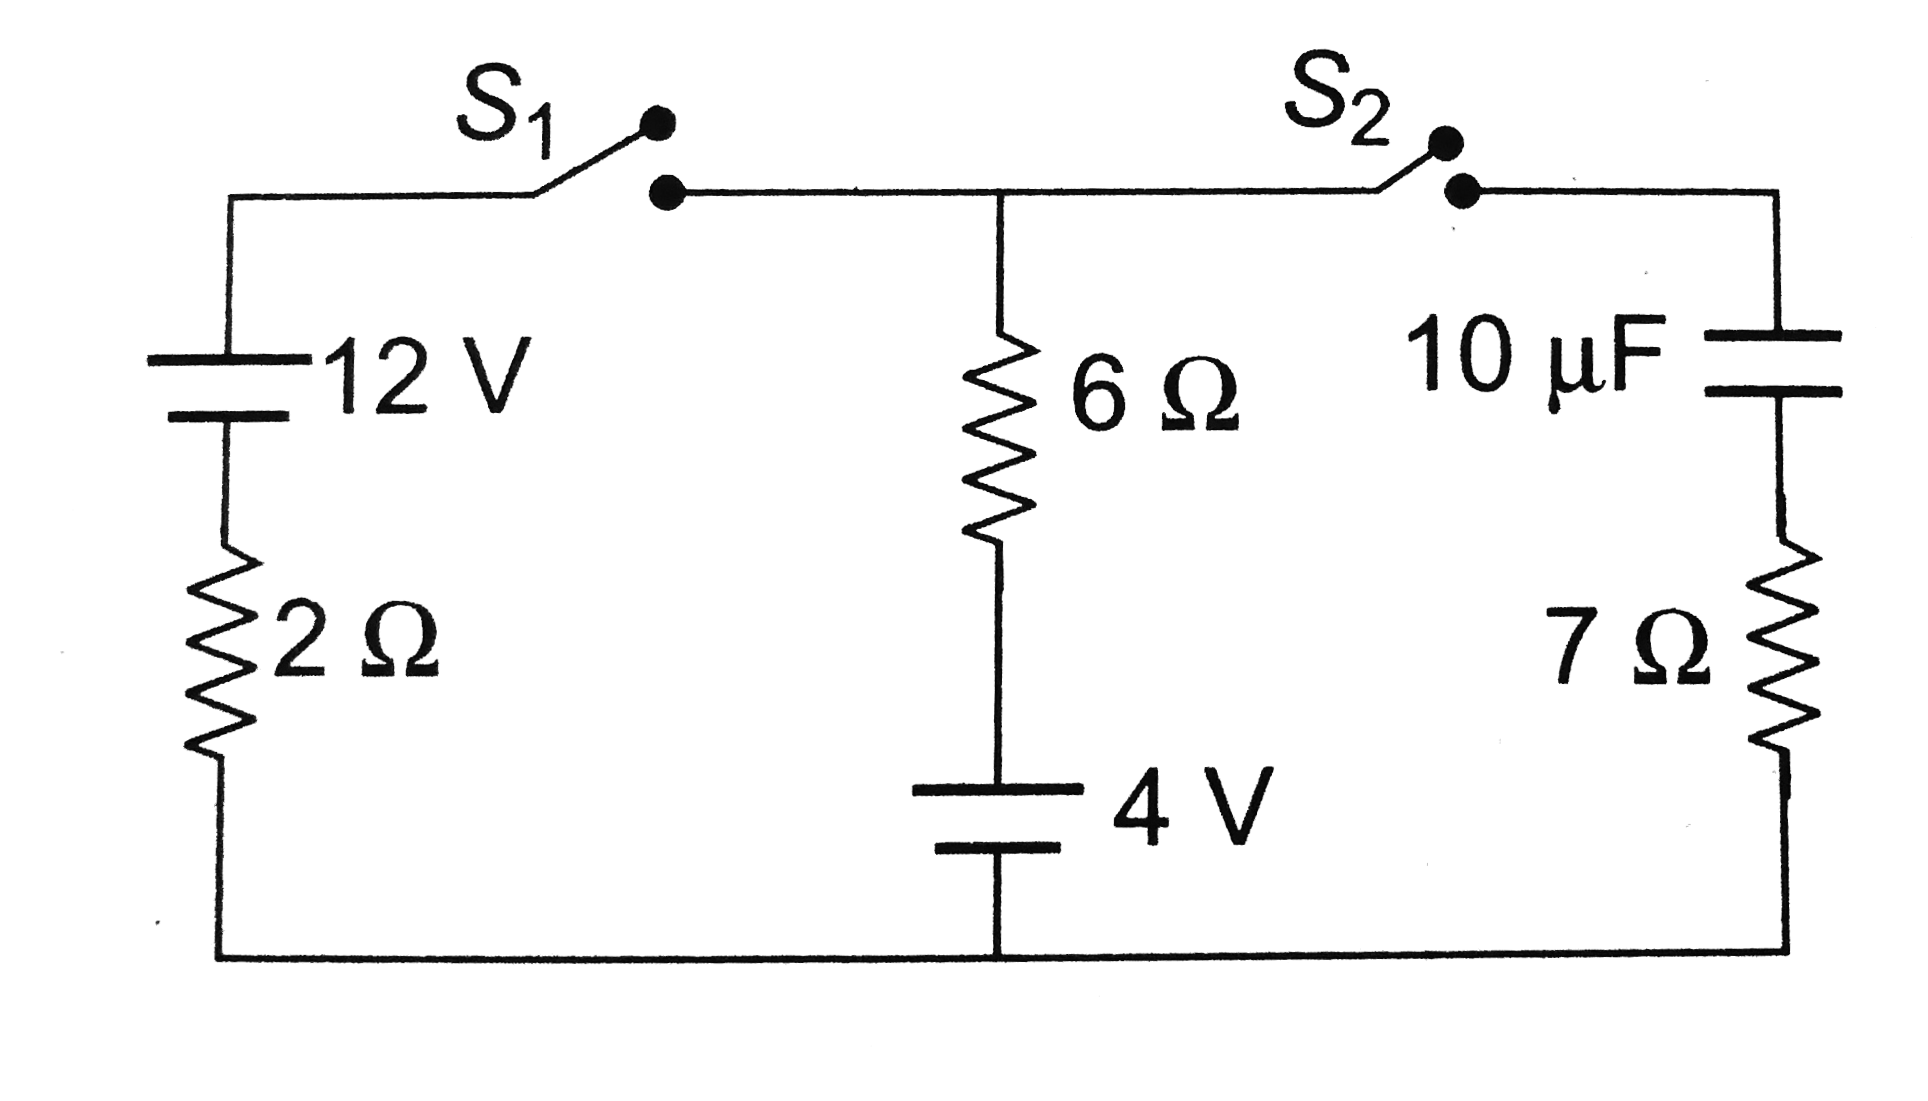
In the circuit shown in the figure, if switches S1 and S2 have been closed for a long time, then charge on the capacitor.
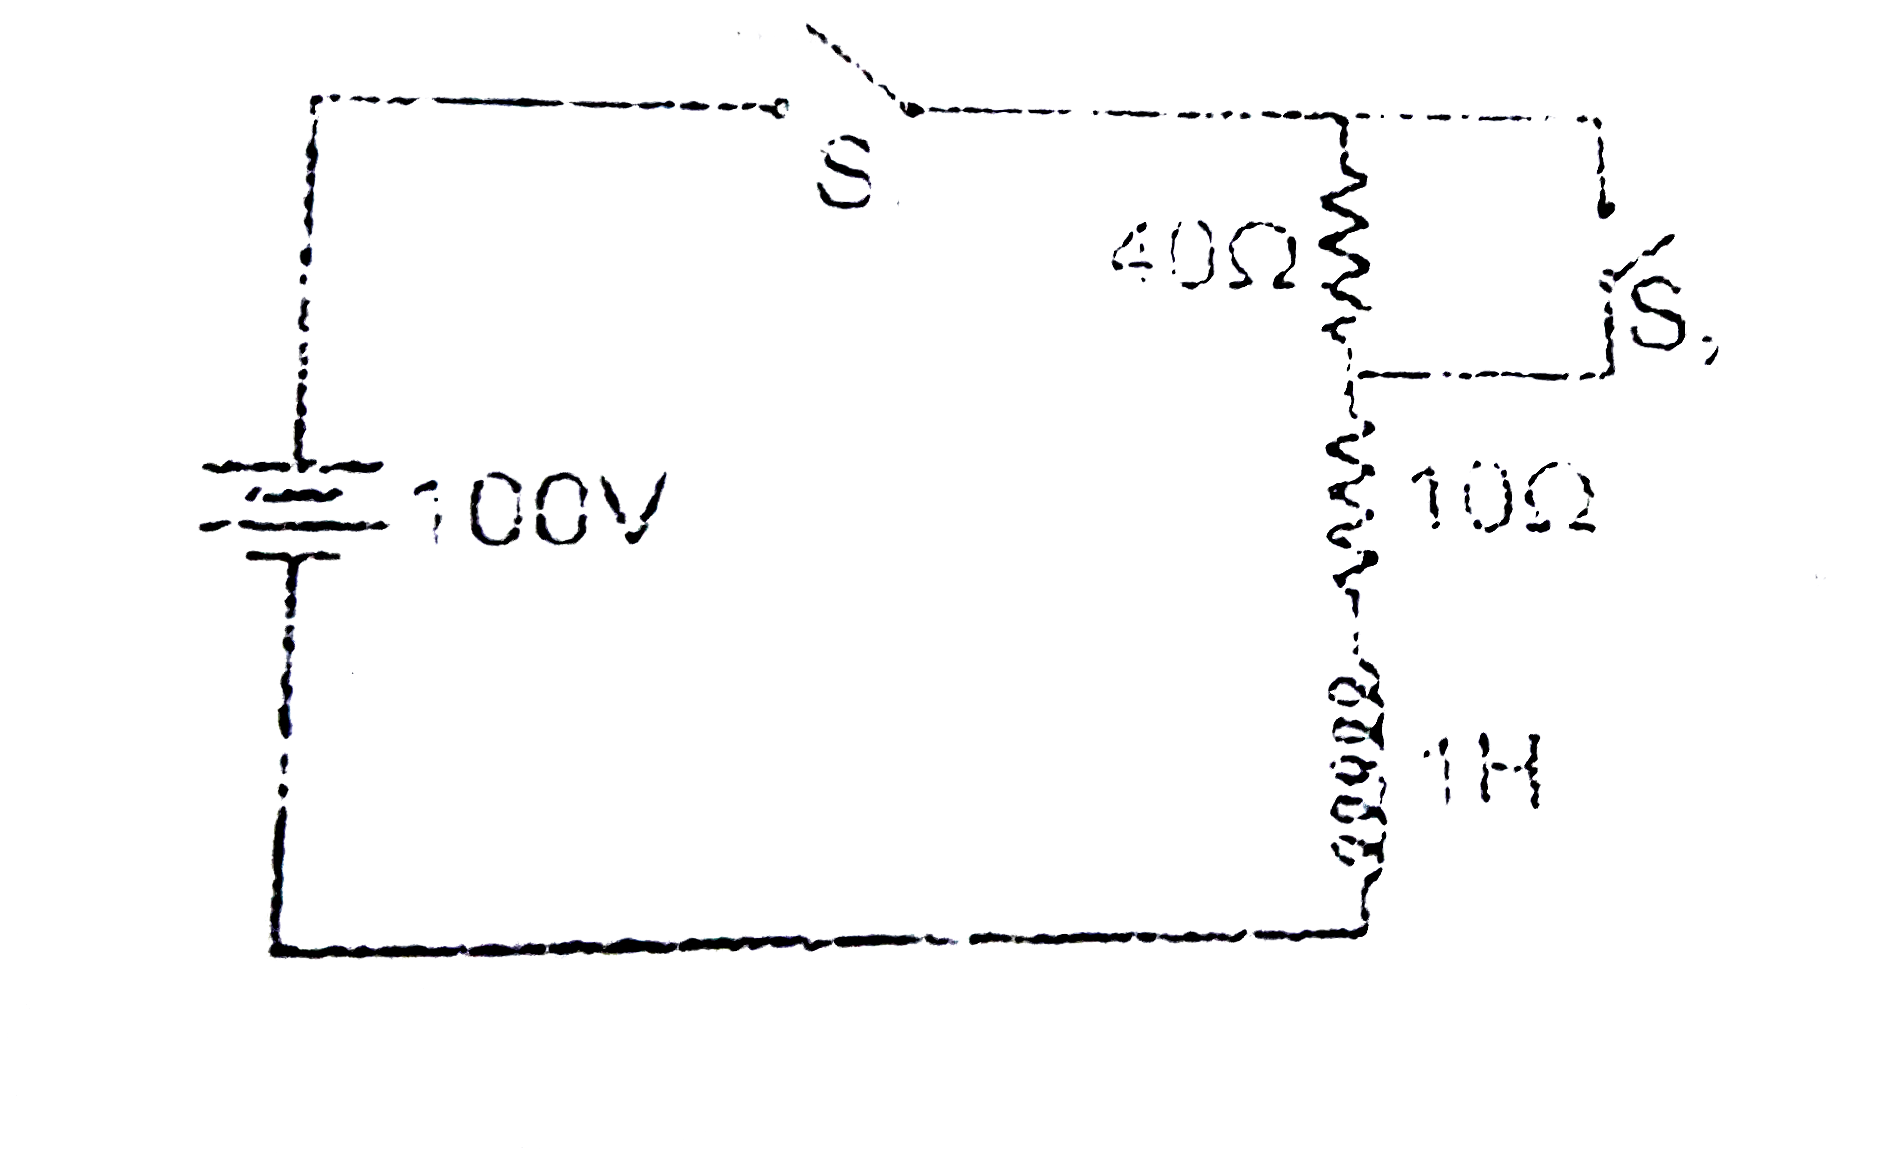
View SolutionIn the circuit diagram shown in the figure the switches S1 and S2 are closed at time t=0.After time t=(0.1)ln2sec, switch S2 is opened.The current in the circuit at time t=0.2n2sec is equal to x32amp.Find out value of x.
View Solution
Knowledge Check
In the circuit shown in the figure, if switches S1 and S2 have been closed for a long time, then charge on the capacitor.
 Ais 100μCBincreases to 200μC if one third of the gap of the capacitor's plates is filled with a dielectric (K=2) of same areaCboth (a) and (b) aboveDcharge on the capacitor remains unchanged if one third of the gap of the capacitor's plates is filled with a dielectric (K=2) of same area.
In the circuit as shown in figure the switch is closed at t=0.
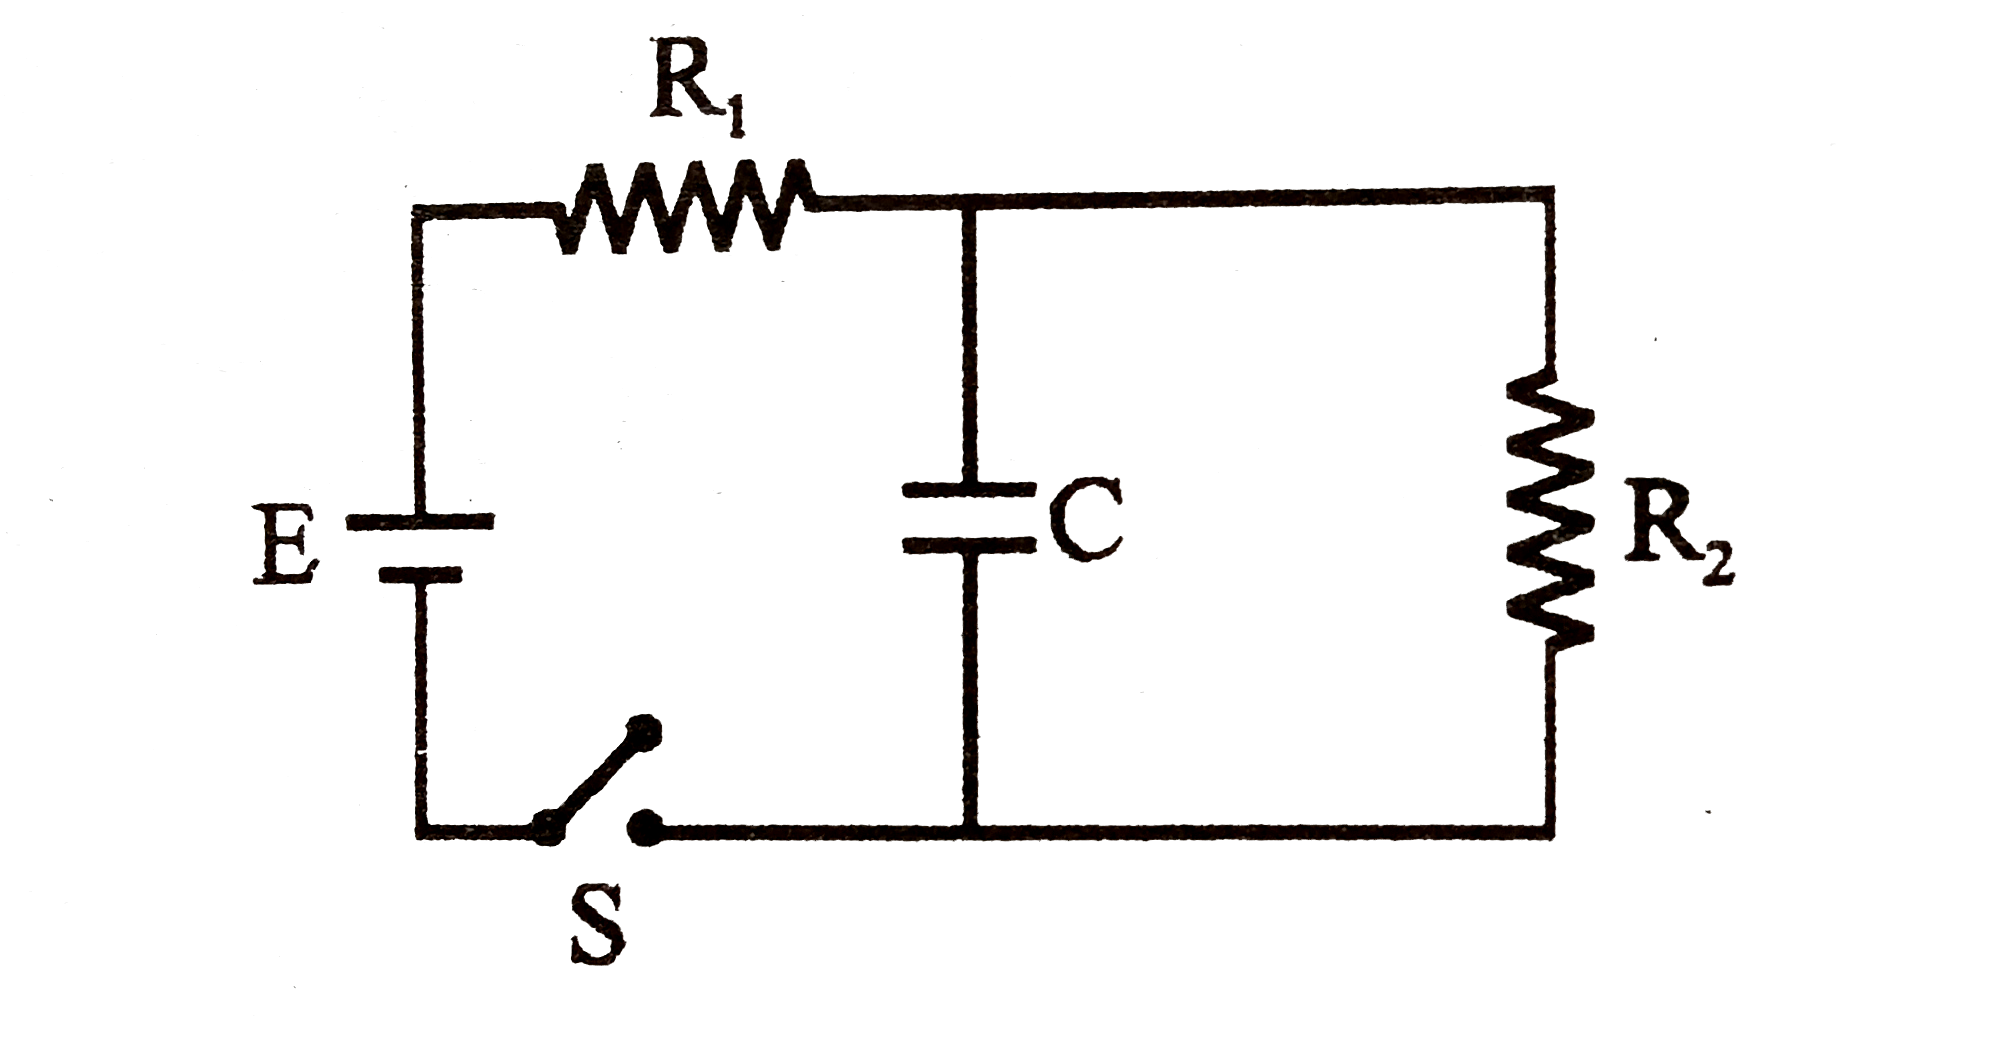
A long time after closing the switchAvoltage drop across the capacitor is EBcurent through the battery is E/R1+R2Cenegru stores in the capacitor is
12C(R2ER1+R2)2Dcurrent through the capacitor becomes zeroIn the circuit as shown in figure the switch is closed at t=0.
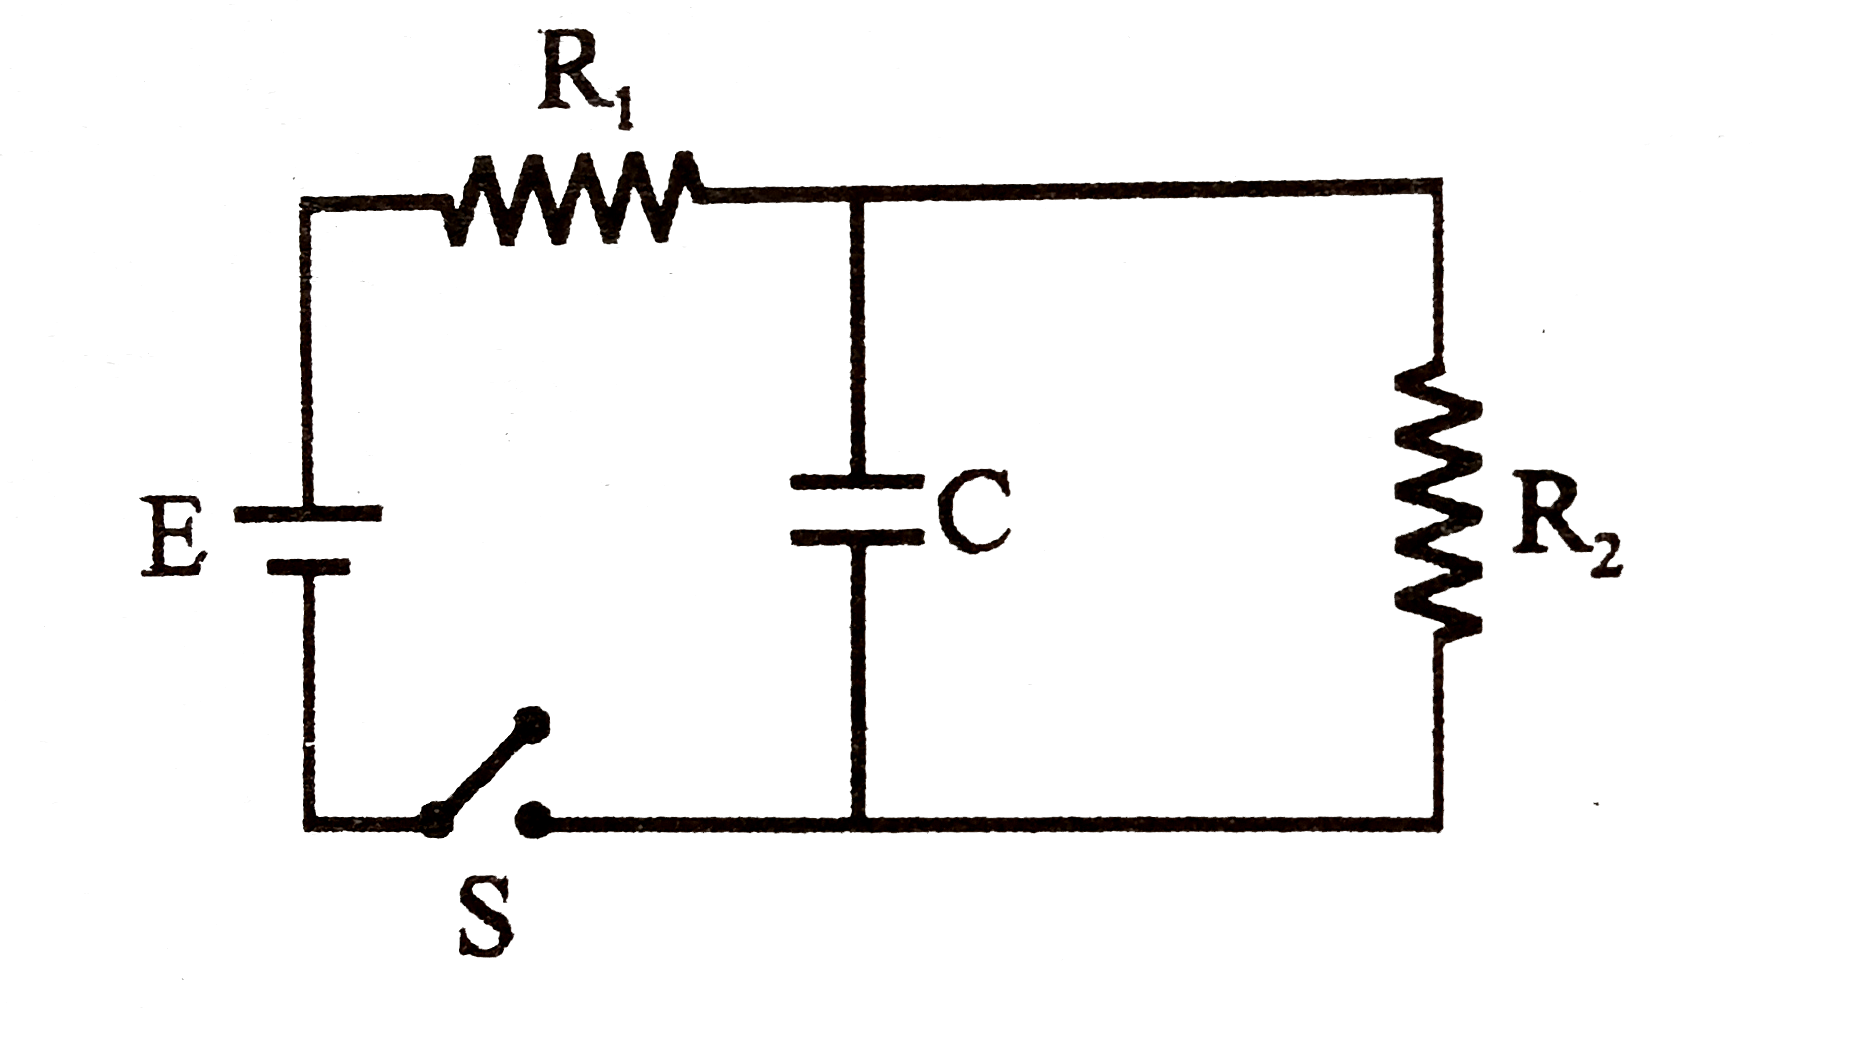
At the instant of closing the switchAthe battery delivers maximum currentBno current flows through CCvoltage drop across R2 is zeroDthe current through the battery decreases with time finally becomes zero
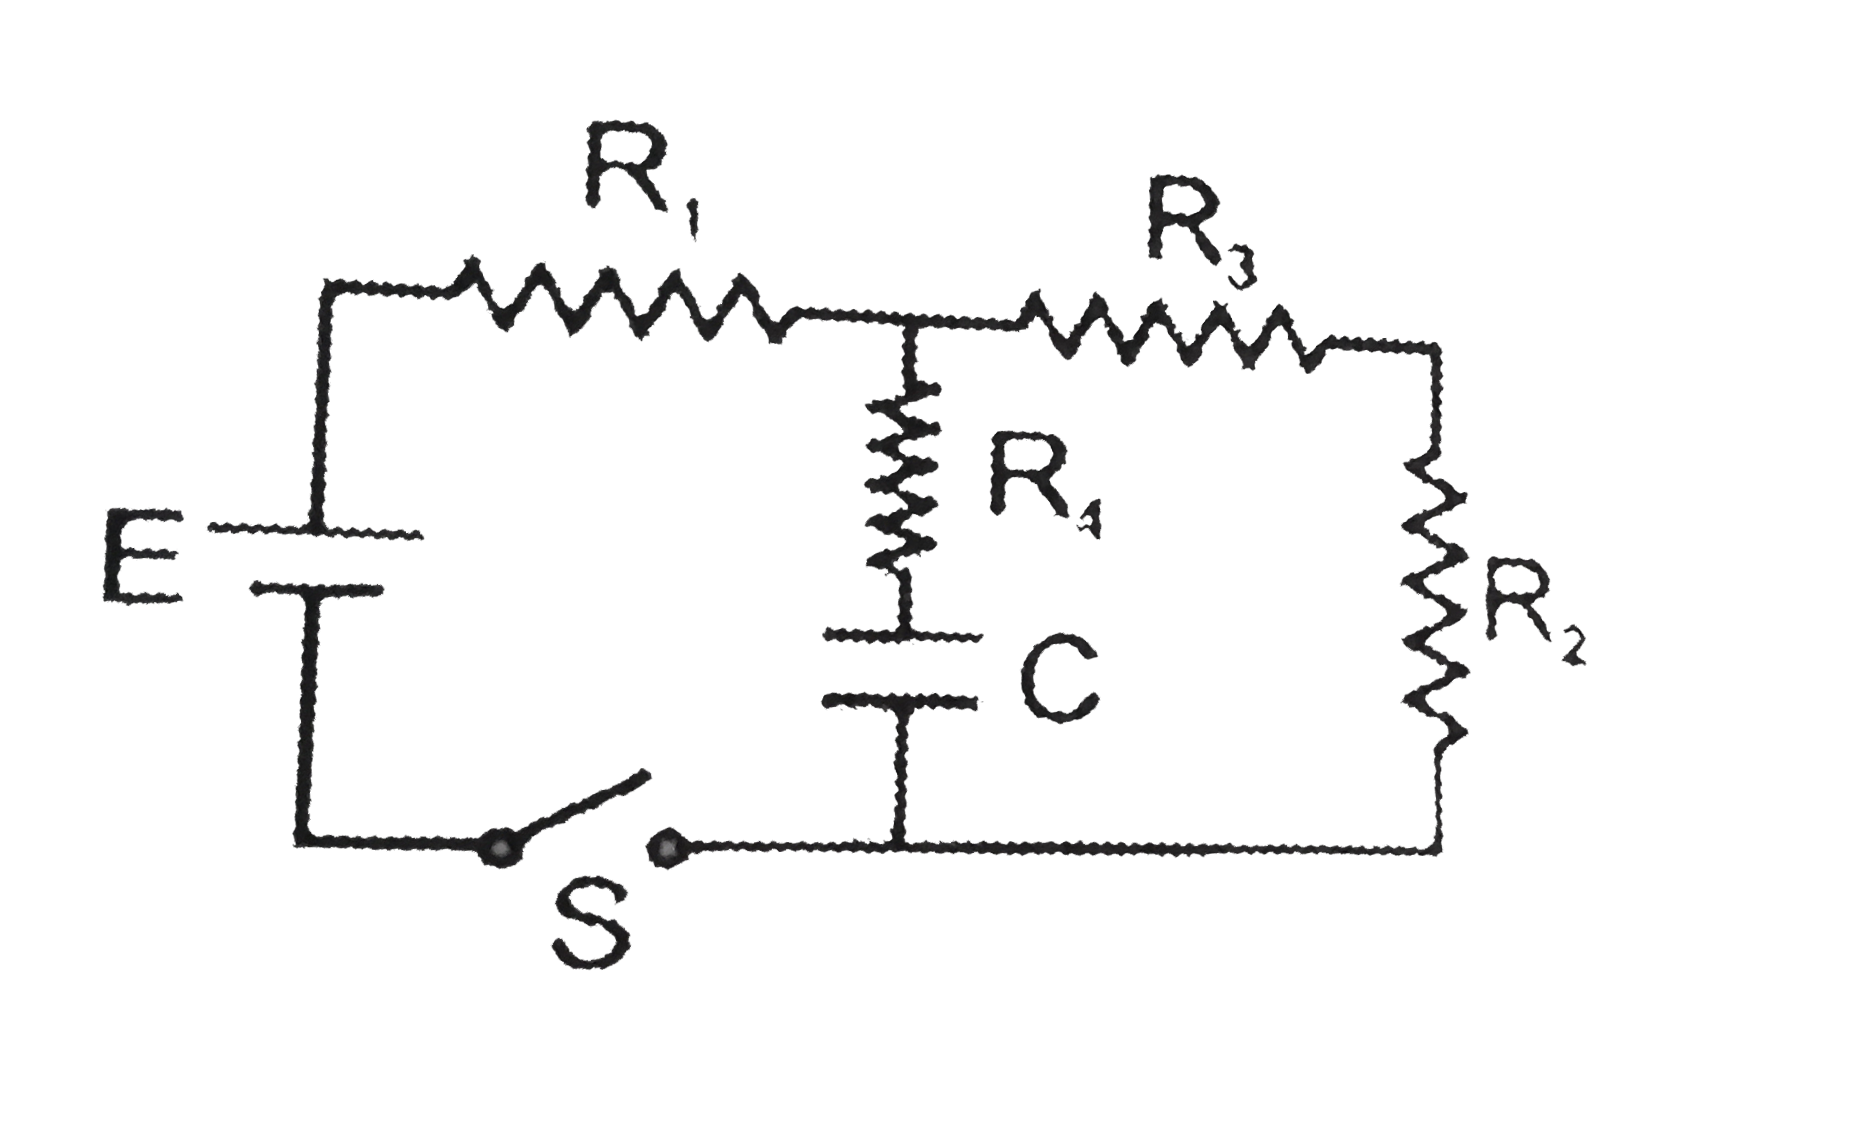
In the circuit shown in figure the switch S is closed at t = 0. A long time after closing the switch
View SolutionIn the circuit shown, switch S is closed at time t=0. Find the current through the inductor as a function of time t.
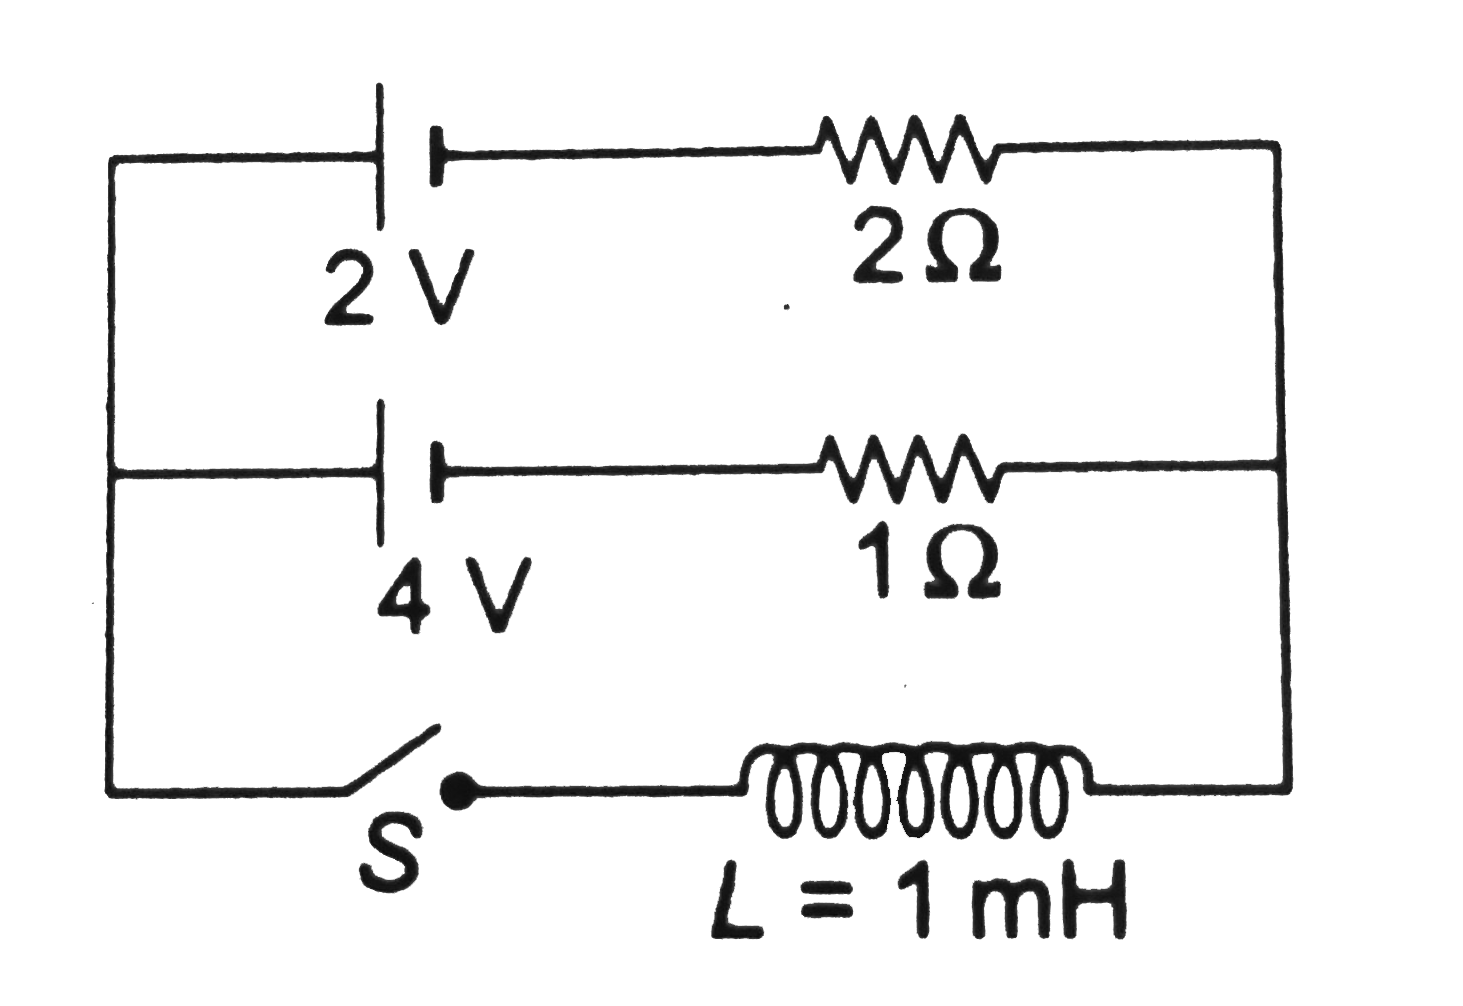
View SolutionIn the circuit shown, switch S is closed at time t=0. Find the current through the inductor as a function of time t.

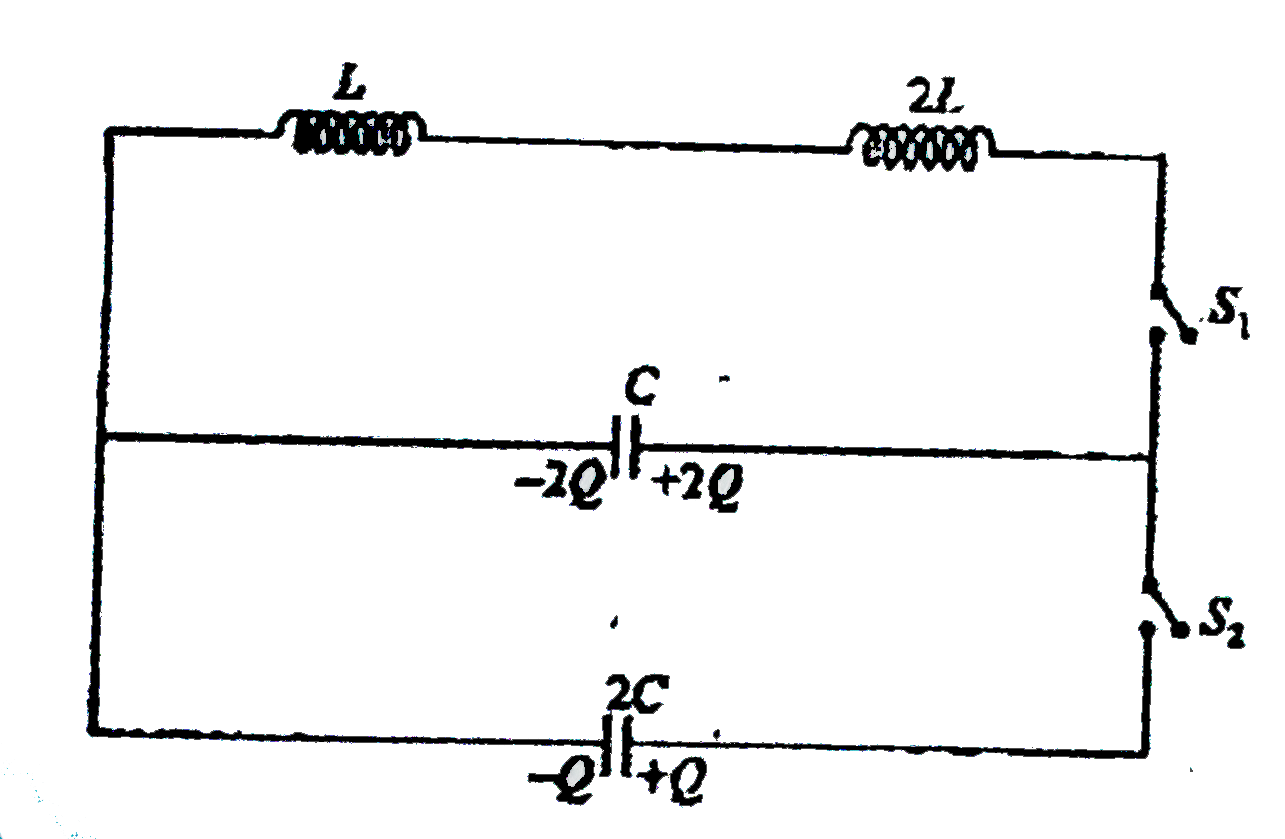
View SolutionIn circuit shown in figure-5.149 if switches S1 and S2 are closed at t=0, find the oscillation frequency of charge in this circuit. Neglect mutual induction between inductors.
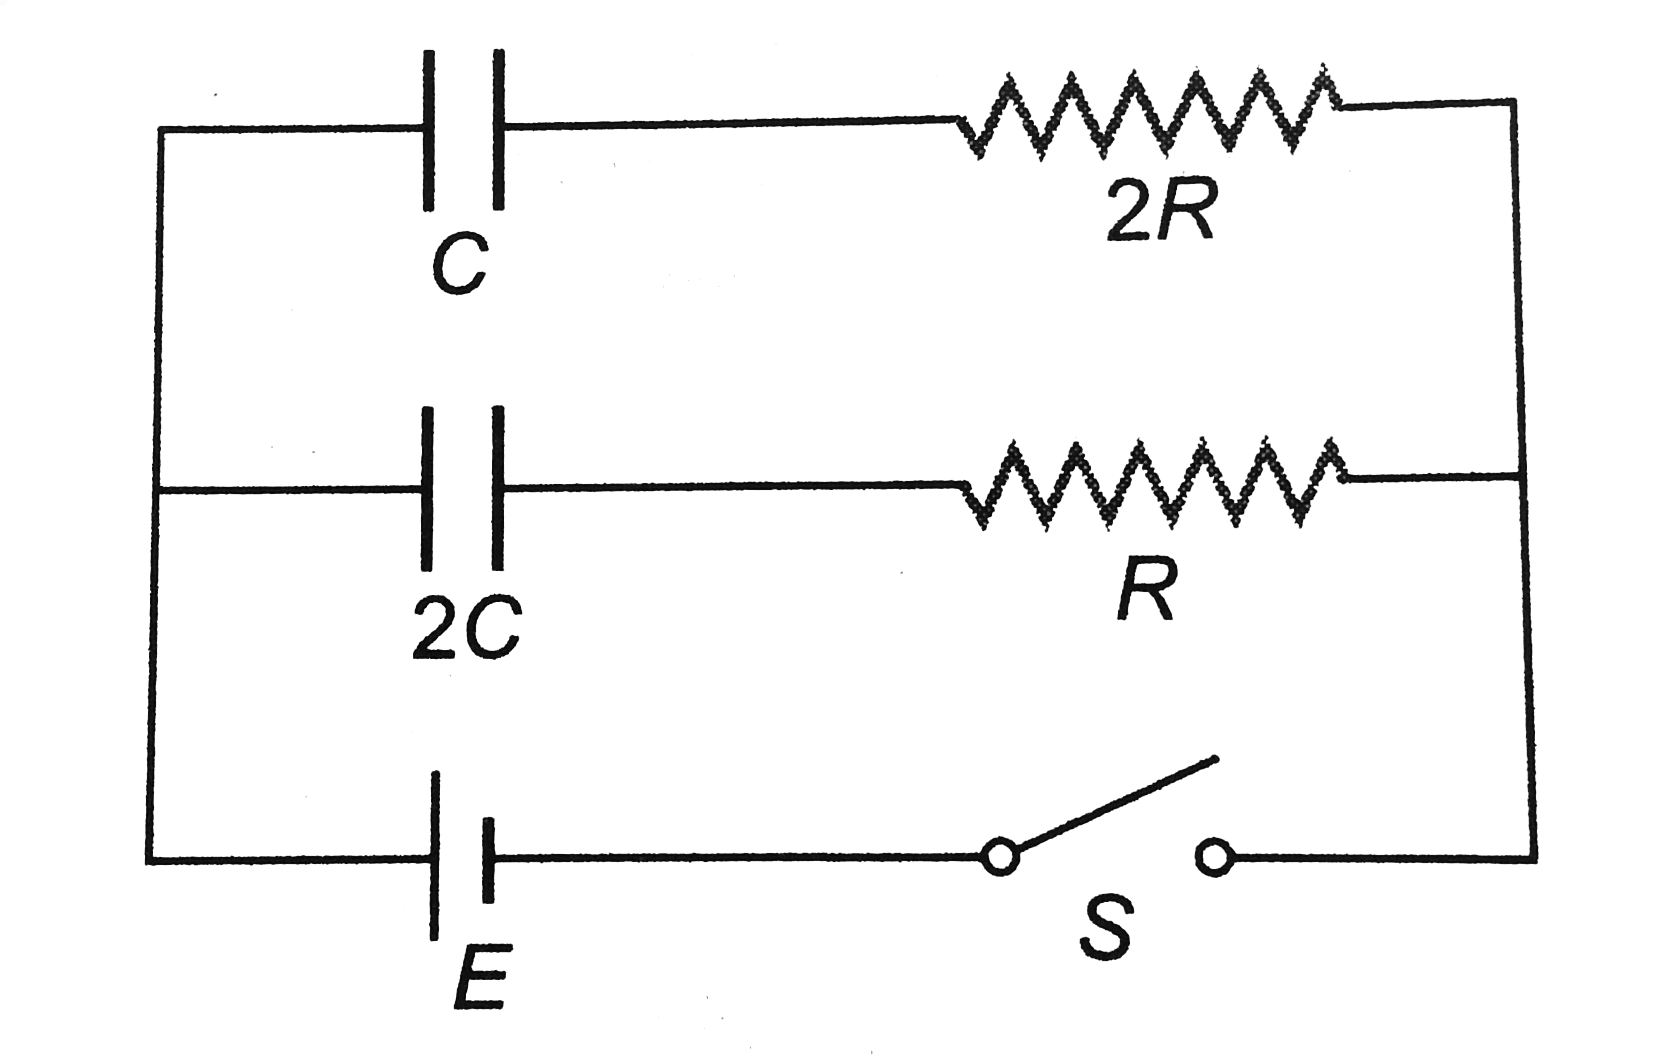
View SolutionIn the circuit shown in the figure, switch S is closed at time t=0. Select the correct statements.
View Solution
