Match the following 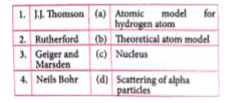 Solution in Tamil
To determine the curve corresponding to higher temperature, draw a horizontal line parallel to x axis as shown in the figure. This is the constant pressure line. The volumes V1andV2 belong to same pressure as the vertical lines from V1andV2 meet the constant pressure line.
At constant pressure, higher the volume of the gas, higher will be the temperature. From the figure, as V1>V2 we conclude T1>T2. In general the isothermal curve closer to the origin, has lower temperature.

Topper's Solved these Questions
- HEAT AND THERMODYNAMICSBOOK - FULL MARKSCHAPTER - HEAT AND THERMODYNAMICSEXERCISE - TEXTUAL EVALUATION SOLVED (I. Multiple Choice Questions)
13 Videos
- HEAT AND THERMODYNAMICSBOOK - FULL MARKSCHAPTER - HEAT AND THERMODYNAMICSEXERCISE - TEXTUAL EVALUATION SOLVED (II. Short Answer Questions)
48 Videos
- GRAVITATIONBOOK - FULL MARKSCHAPTER - GRAVITATIONEXERCISE - ADDITIONAL QUESTIONS SOLVED (Numerical Problems)
18 Videos
- KINEMATICSBOOK - FULL MARKSCHAPTER - KINEMATICSEXERCISE - ADDITIONAL QUESTIONS SOLVED (LONG ANSWER QUESTIONS)
10 Videos
Similar Questions
In hot summer after a both the body 's
View SolutionAn object contains more heat -Is it a right statement ? If not why ?
View SolutionA geo-stationary satellite is orbiting the Earth of a height of 6R above the surface of Earth R being the radius of the Earth calculate the time period of another satellite at a height of 2.5R from the surface of Earth.
View SolutionExplain the types of motion with example
View SolutionMatch the following
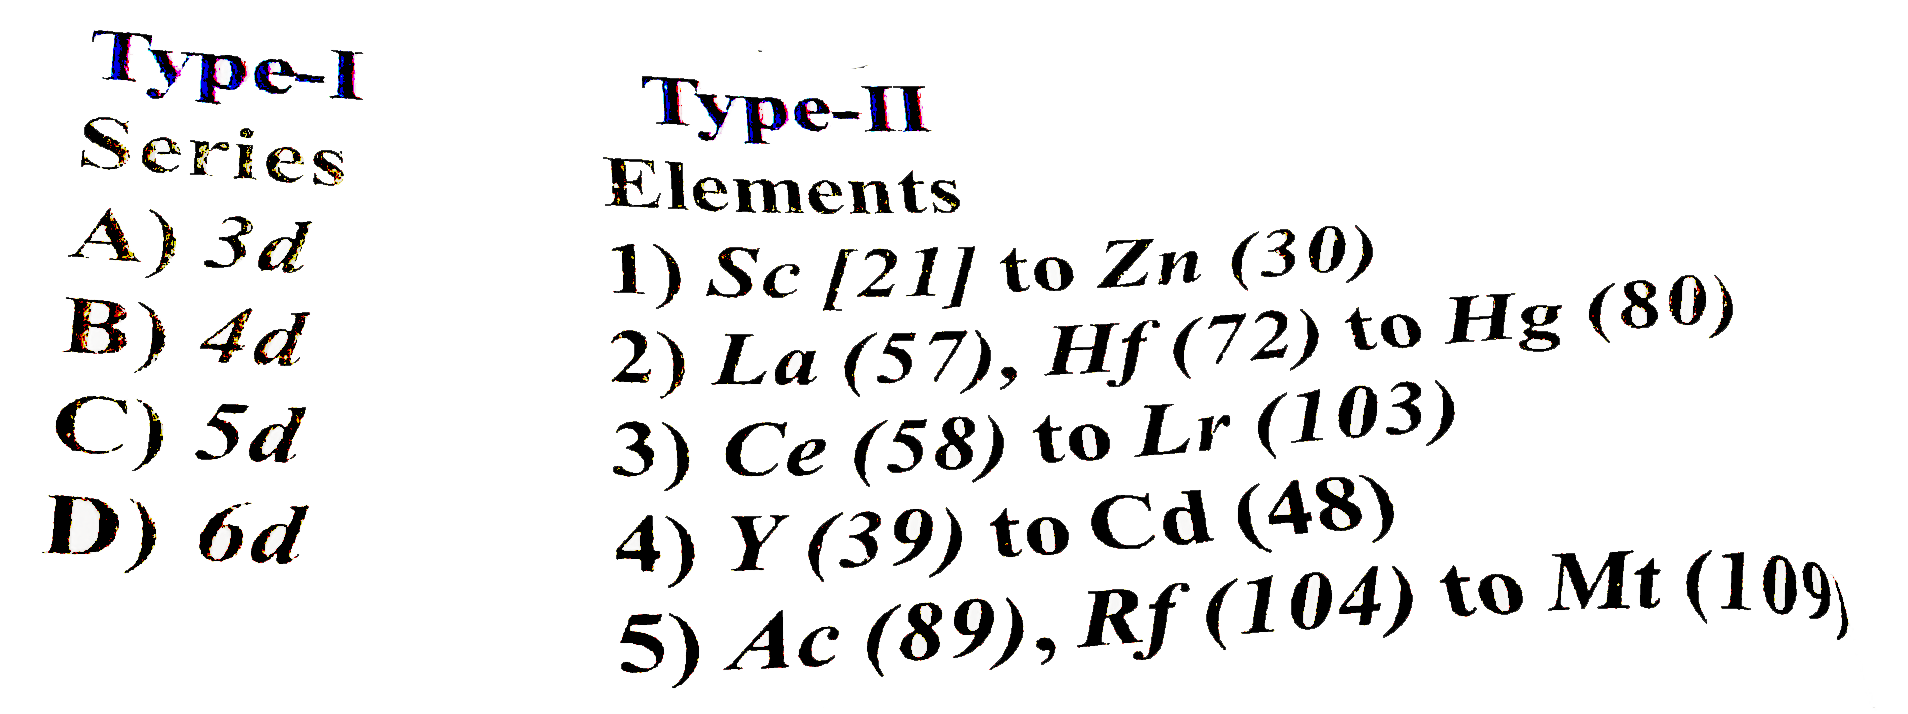
The correct match is
View SolutionMatch the following Match correc match is
View SolutionMatch the following :

The correct match is
View SolutionMatch the following :
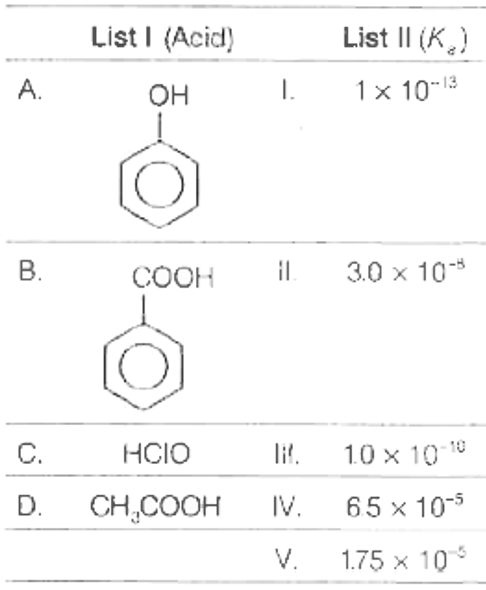
The correct match is
View SolutionMatch the following .
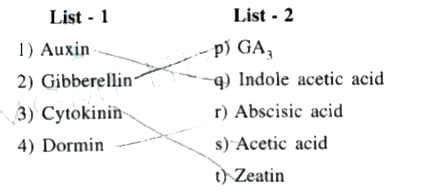
The correct match is .
View Solutionनिम्न को सुमेलित करिए

सही सुमेल है
View SolutionMatch the following
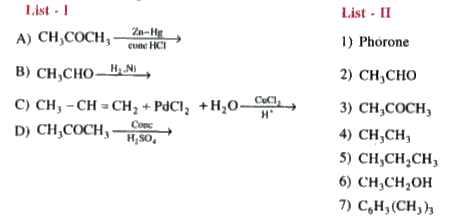
the correct match is
View SolutionMatch the following

The correct match is
View SolutionMatch the following
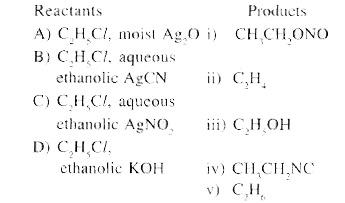
the correct match is
View SolutionMatch of the following
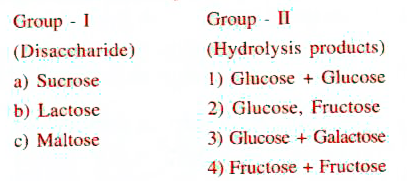
The correct match is
View Solutionनिम्न को सुमेलित कीजिए :-

सही सुमेलन को चुनिए :-
View SolutionMatch the following
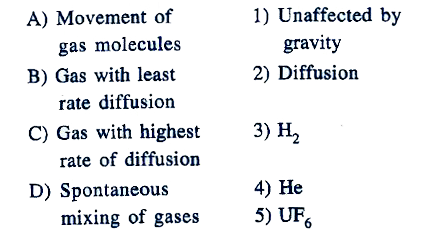
The correct match is
View Solution
