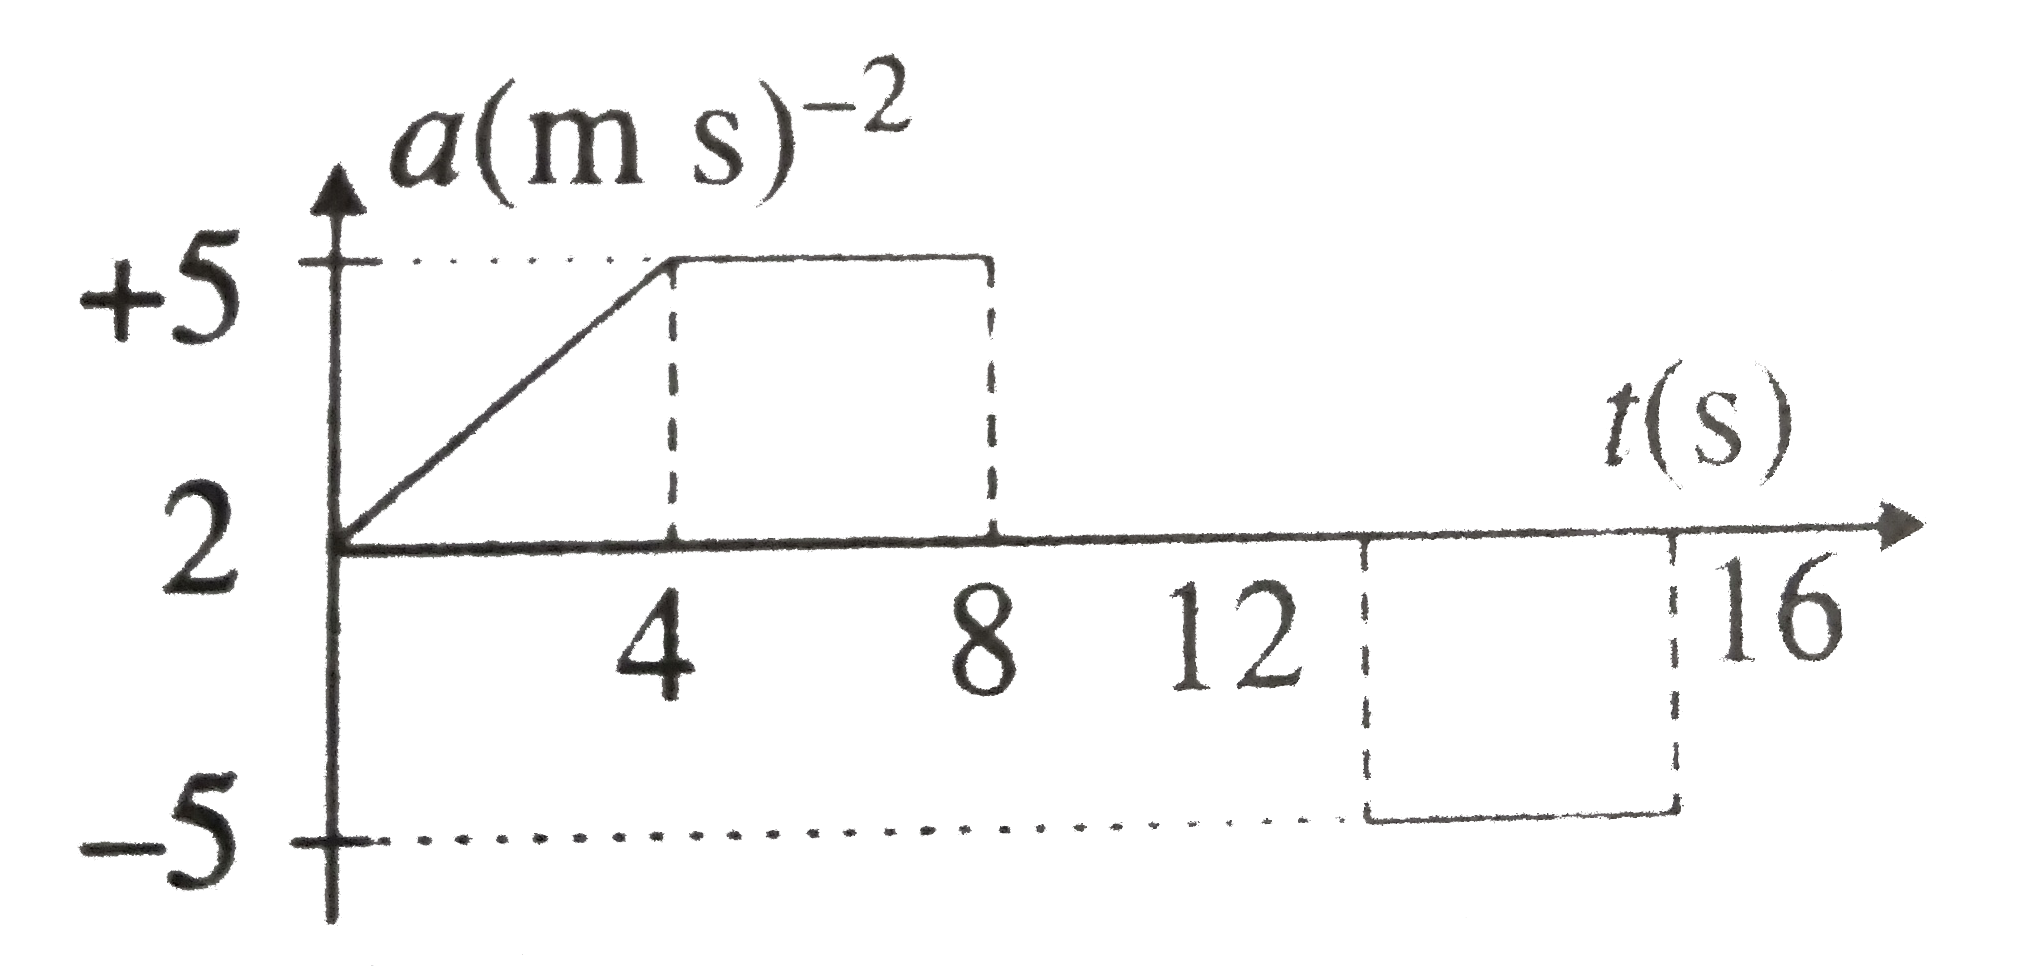
The acceleration of a particle starting from rest and travelling along a straight line is shown in figure. The maximum speed of the particle is
The correct Answer is:B
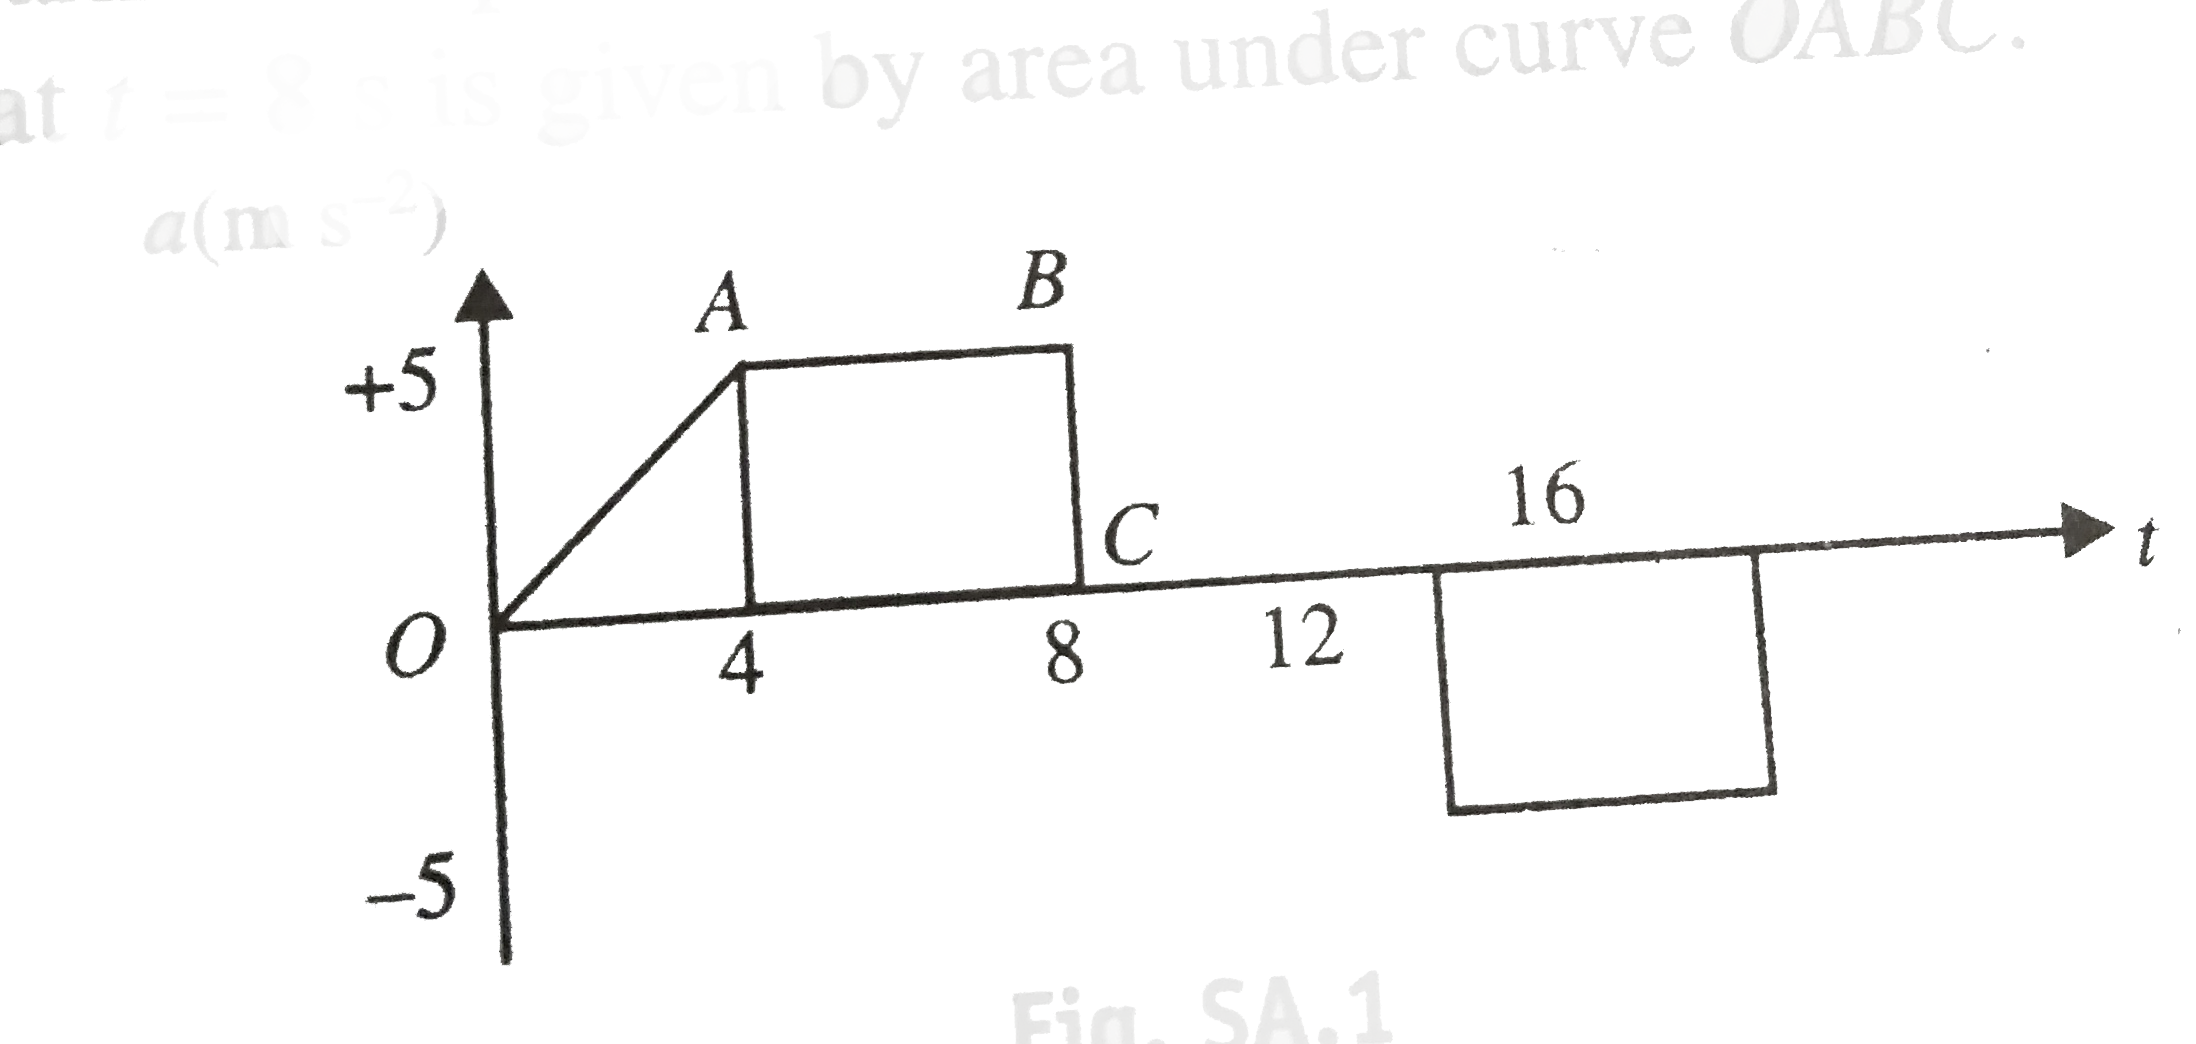
b. Maximum speed is at t = 8 s
v at t = 8 s is given by area under curve OABC.
Maximum speed
.
Topper's Solved these Questions
- MISCELLANEOUS KINEMATICSBOOK - CENGAGE PHYSICS ENGLISHCHAPTER - MISCELLANEOUS KINEMATICSEXERCISE - Multiple Correct Answer Type
26 Videos
- MISCELLANEOUS KINEMATICSBOOK - CENGAGE PHYSICS ENGLISHCHAPTER - MISCELLANEOUS KINEMATICSEXERCISE - Linked Comprehension Type
35 Videos
- LINEAR AND ANGULAR SIMPLE HARMONIC MOTIONBOOK - CENGAGE PHYSICS ENGLISHCHAPTER - LINEAR AND ANGULAR SIMPLE HARMONIC MOTIONEXERCISE - Single correct anwer type
14 Videos
- MISCELLANEOUS VOLUME 2BOOK - CENGAGE PHYSICS ENGLISHCHAPTER - MISCELLANEOUS VOLUME 2EXERCISE - INTEGER_TYPE
10 Videos
Similar Questions
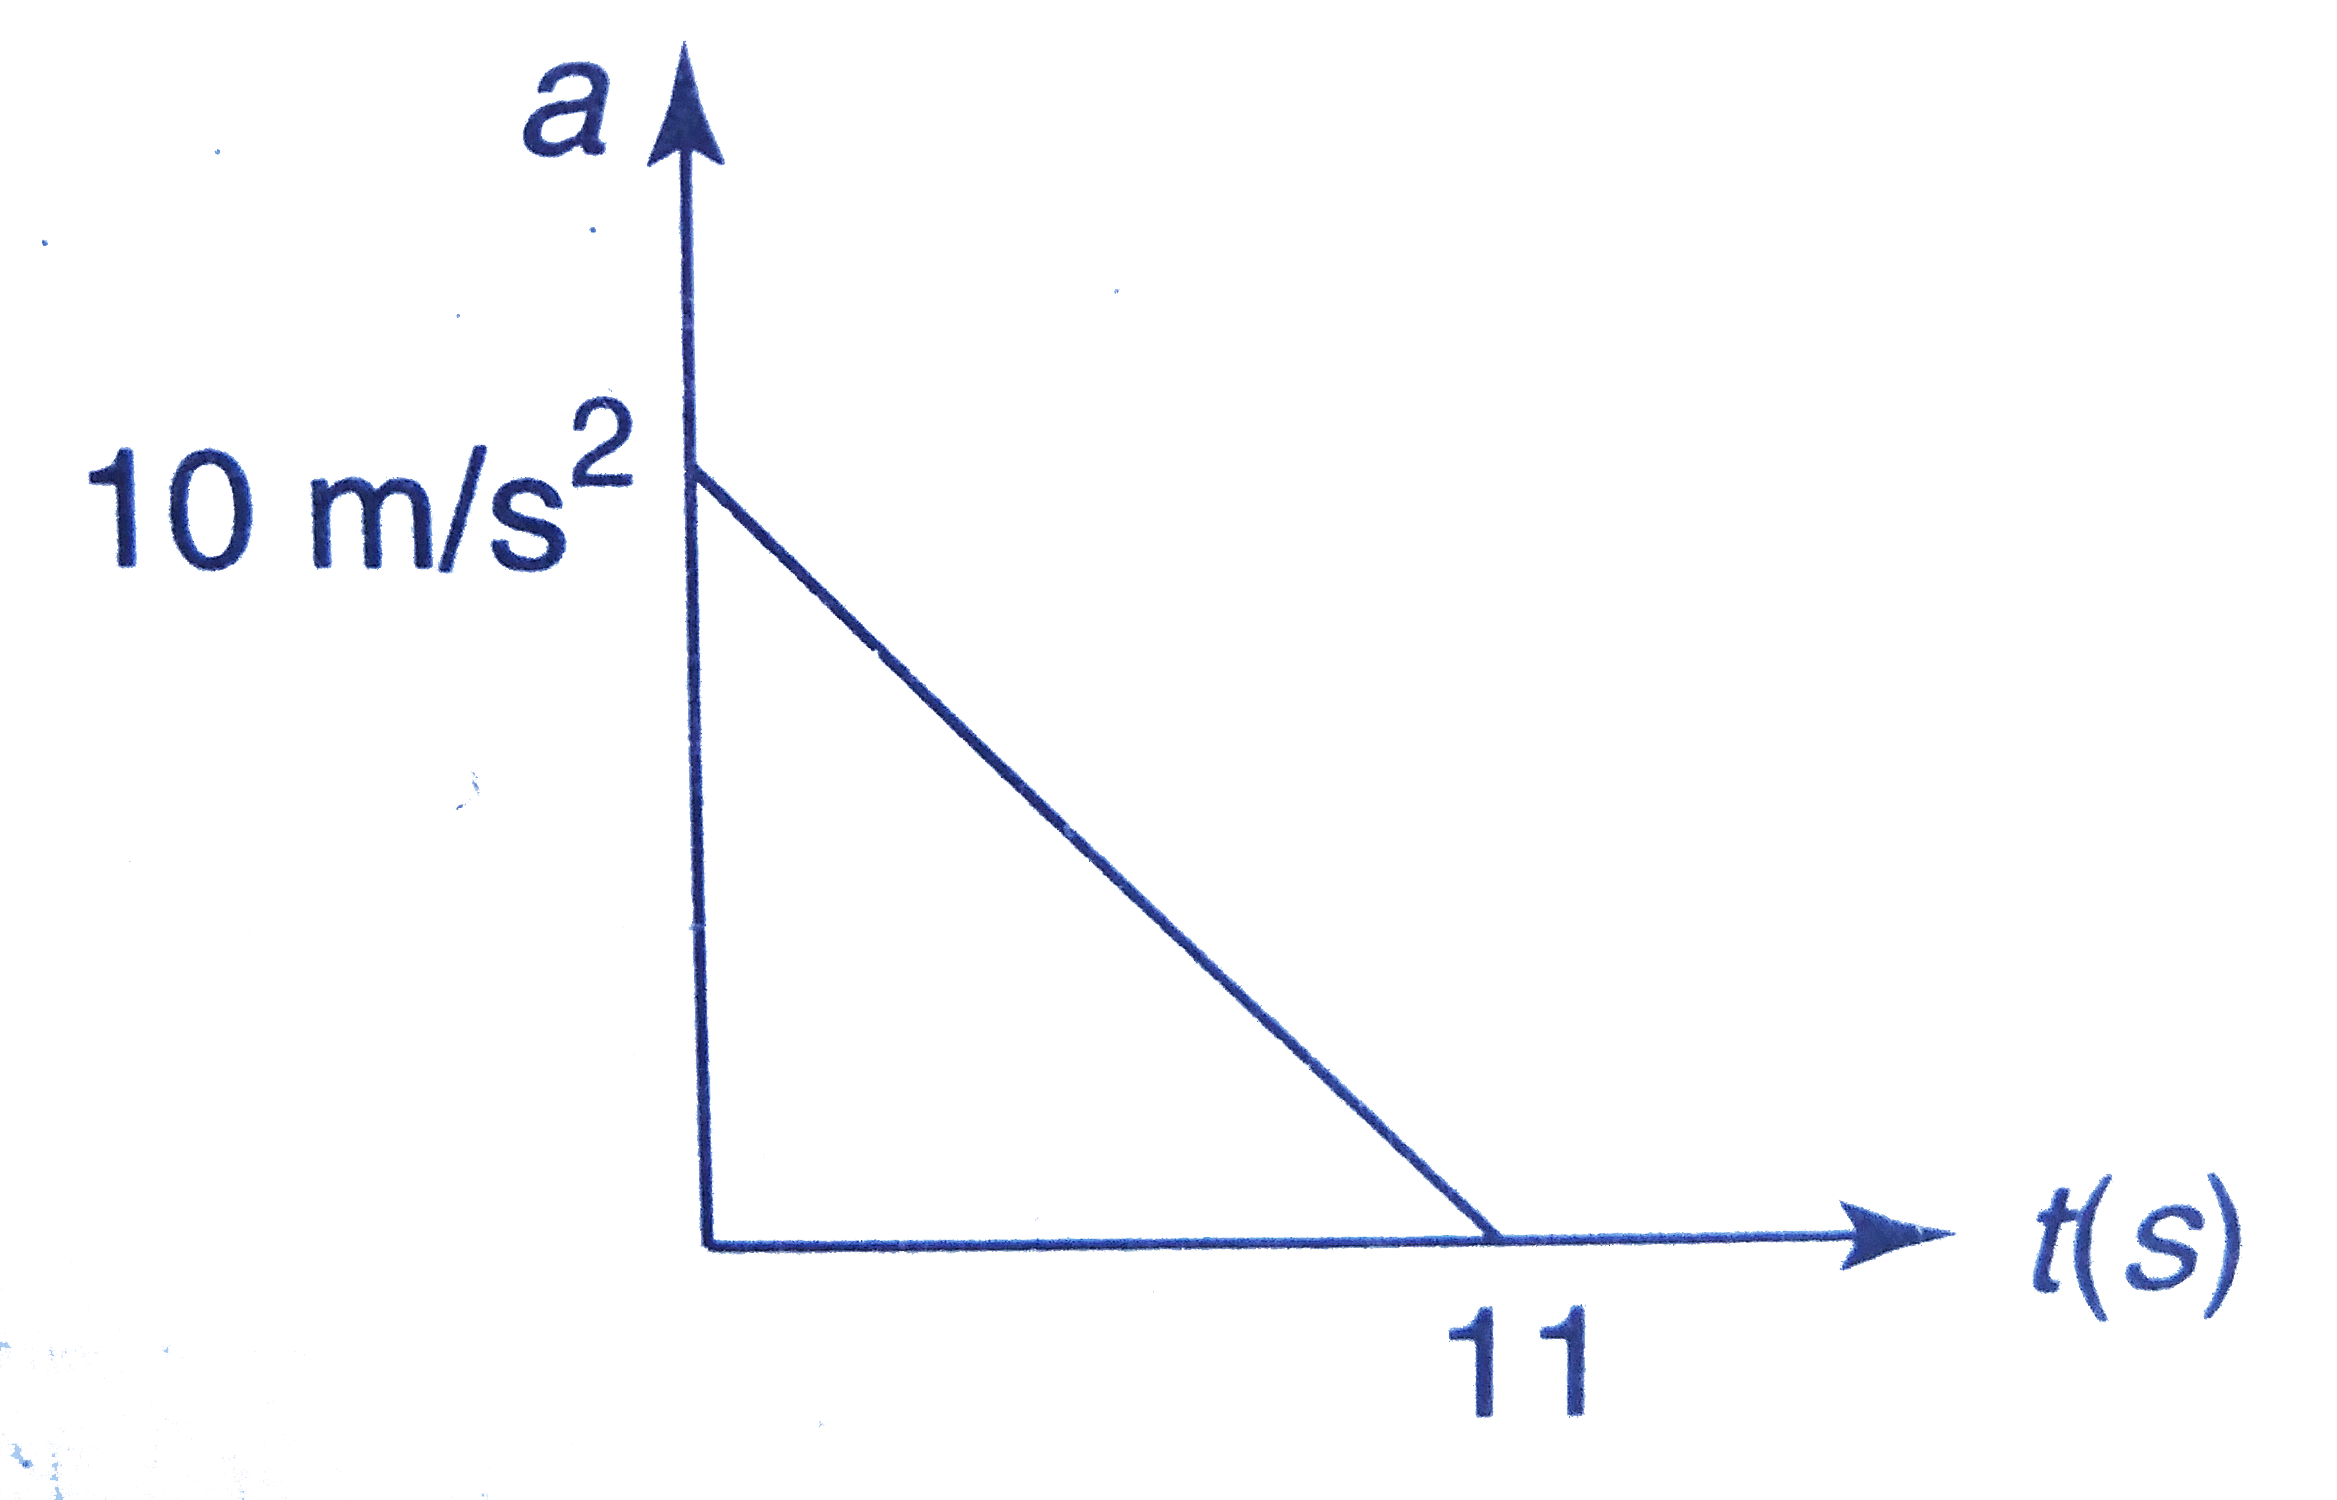
A particle starting from rest. Its acceleration (a) versus time (t) is as shown in the figure.
The maximum speed of the particle will be.
View SolutionA particle starting from rest. Its acceleration (a) versus time (t) is as shown in the figure.
The maximum speed of the particle will be.

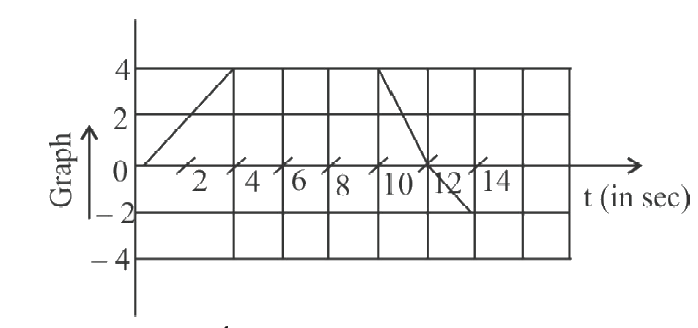
View SolutionA graph of acceleration versus time of a particle starting from rest at t=0 is as shown in figure. The speed of the particle at t=14s is
View SolutionThe x-t graph of a particle moving along a straight line is shown in figure
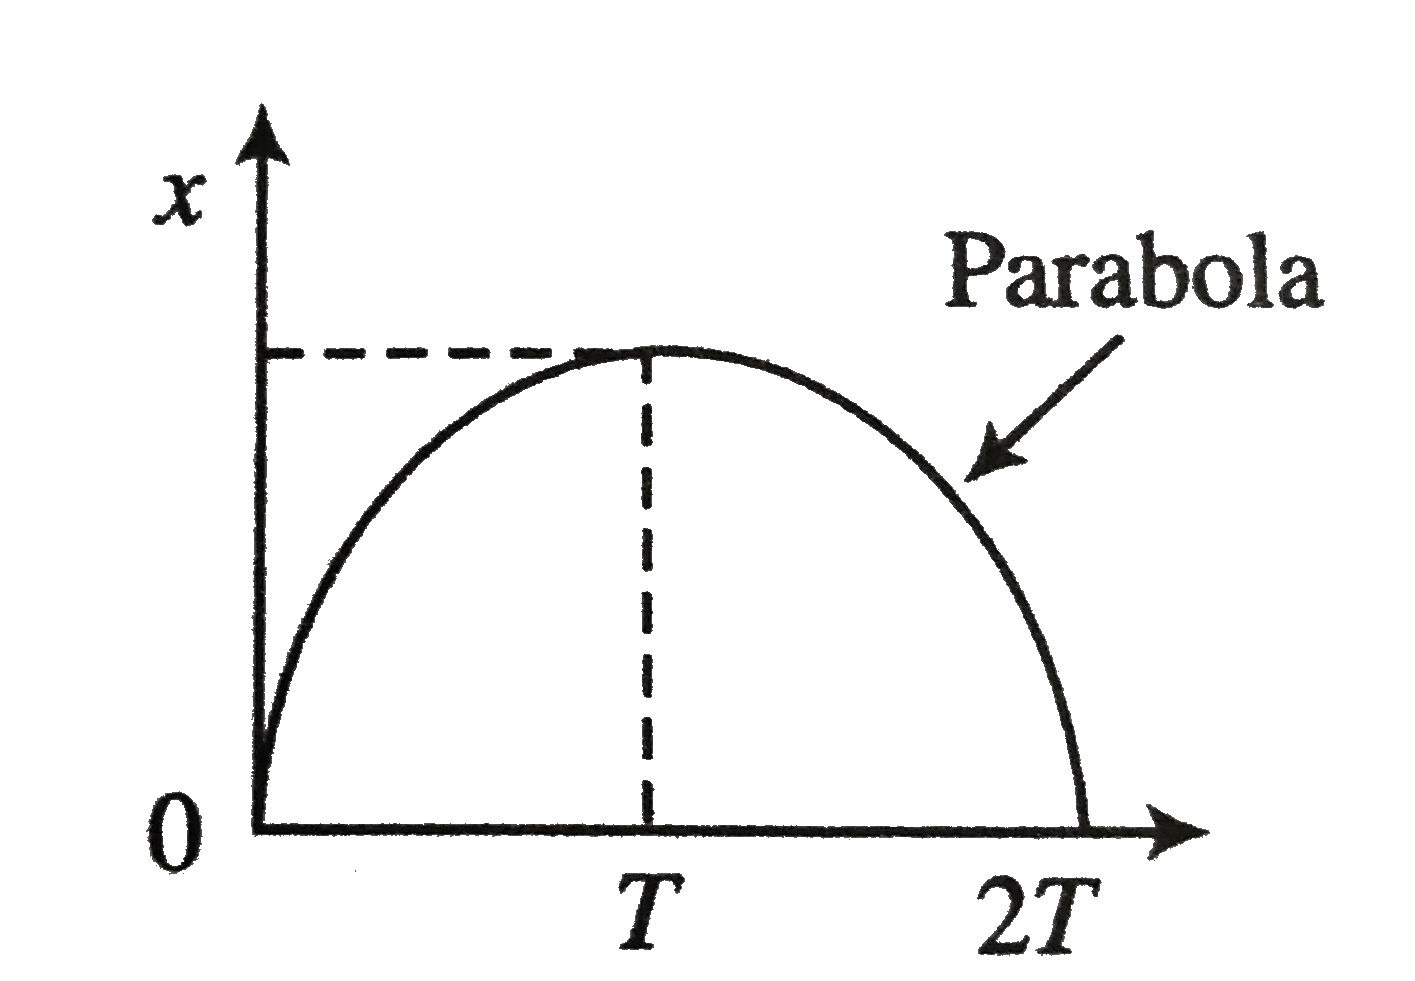
The speed-time graph of the particle is correctly shown by
View SolutionThe variation of velocity of a particle moving along a straight line is shown in the figure. The distance travelled by the particle in 4s is

View SolutionThe acceleration-time (a−t) graph of a particle moving along straight line is as shown in figure. The time at which velocity of particle becomes equal to its initial velocity is

View SolutionThe x-t graph of a particle moving along a straight line is shown in figure

The v-t graph of the particle is correctly shown by
View SolutionThe x-t graph of a particle moving along a straight line is shown in figure
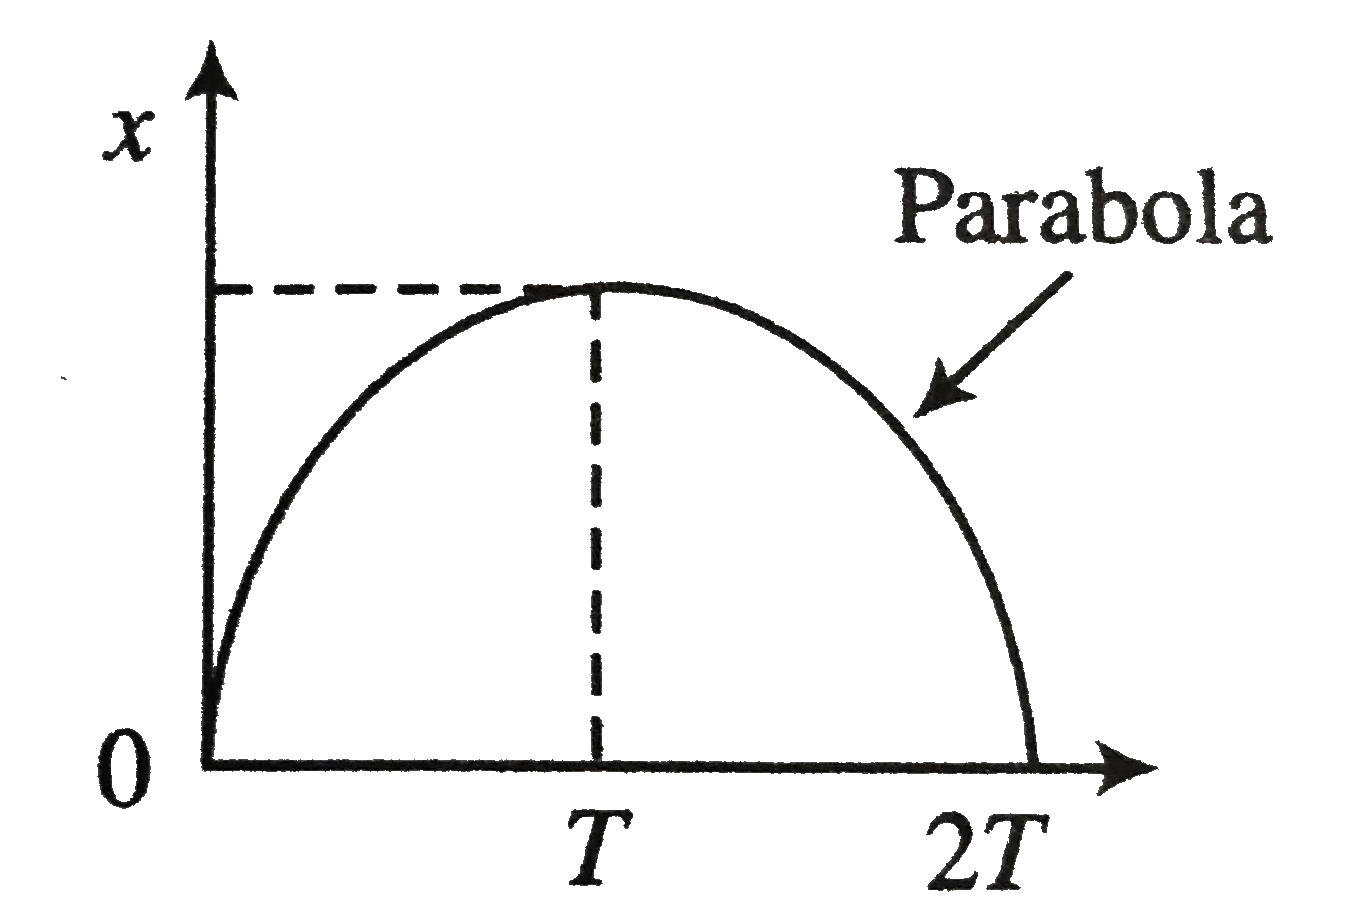
The a-t graph of the particle is correctly shown by
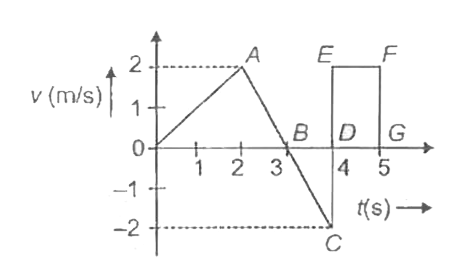
View SolutionThe velocity - time graph of a particle moving along a straight line is shown in the figure given below
The displacement of the particle in 5 second is
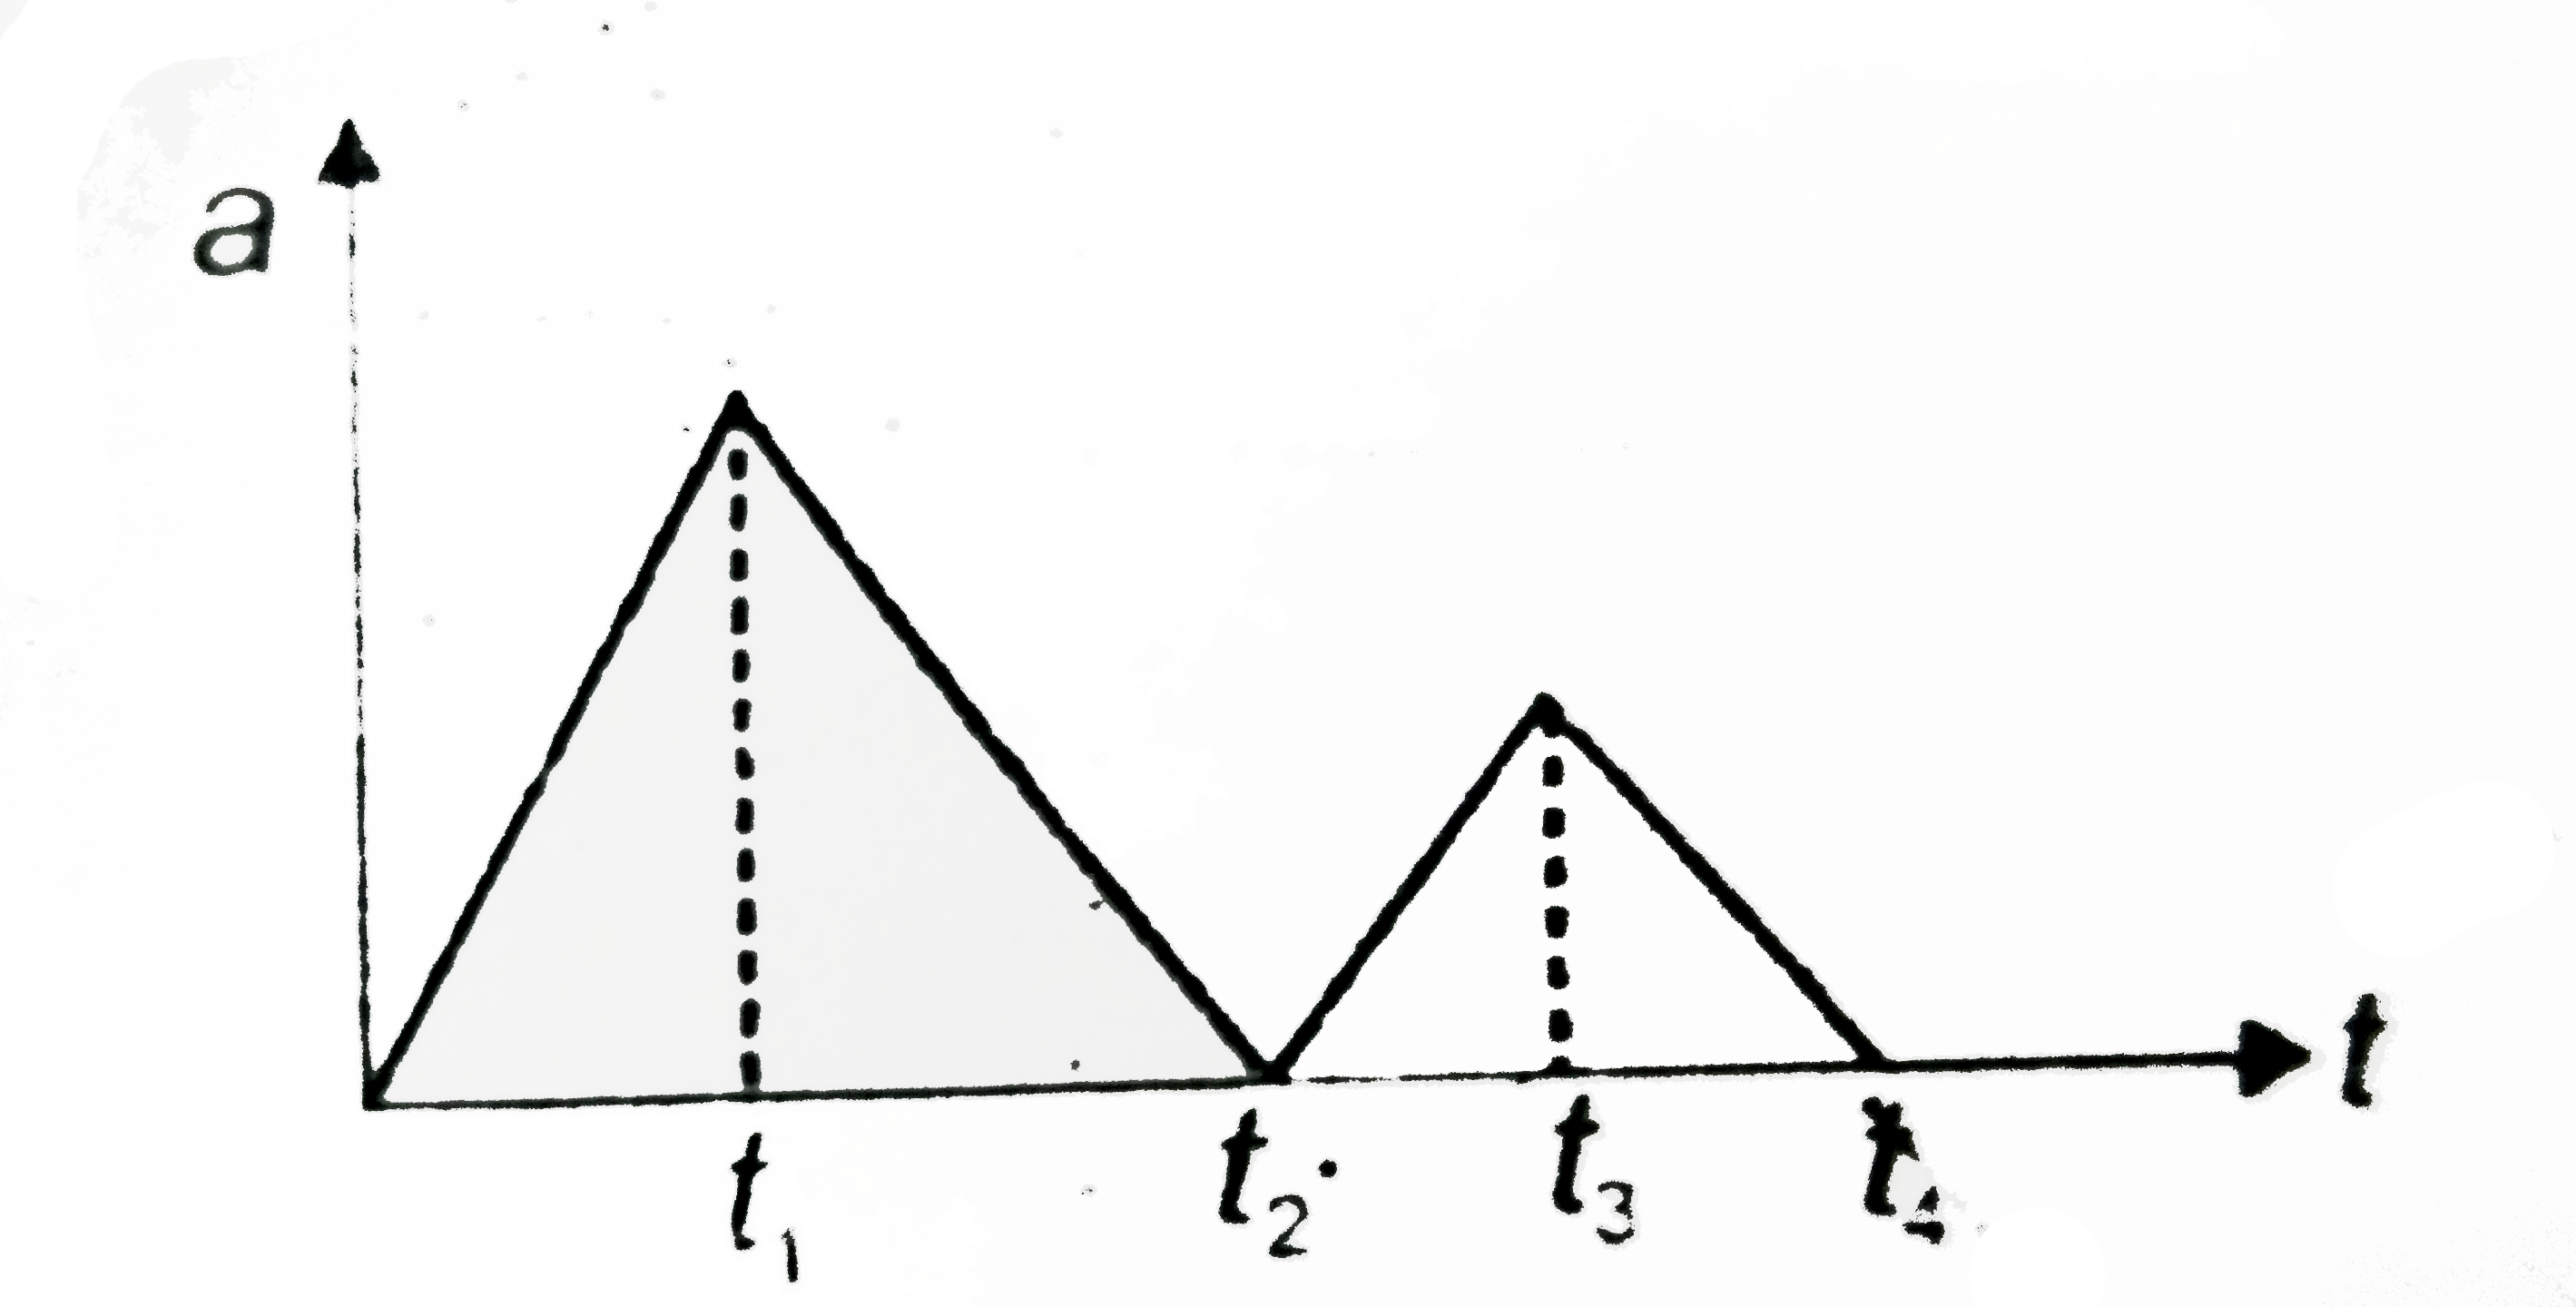
View SolutionA particle starts moving from rest on a straight line. Its acceleration a verses time t is shown in the figure. The speed of the particle is maximum at the instant
View Solution
