The diagram shows the velocity-time graph of two moving cars P and Q. The graph indicates that
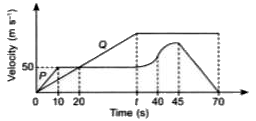
The velocity of car P is increasing at a decreasing rate from 40 s to 45 s in same direction.
Car Q is moving with a constant acceleration from 0 to 40 seconds
Acceration of the car Q is not zero at any point during whole journey .
After 20 s, P is bihind Q.
The correct Answer is:A
From 40 s to 45 s direction of car P is same but velocity is increasing at a decreasing rate of accleration .
(ii) Acceleration of car Q from 0 to t seconds is
50−020−0=2.5ms−2 i.e., constant and after t is becomes zero.
(iii) Acceleration of the car Q is zero from t to 70 s , so velocity is constant.
(iv) Distance travelled by P at the end of first 20 s =12×50×(10+20)=750m
Distance travelled by Q at the end of first 20 s =12×50×20=250m
After 20 s , Q is behind P by 250 m
Topper's Solved these Questions
- MOTION BOOK - SCIENCE OLYMPIAD FOUNDATION CHAPTER - MOTION EXERCISE - ACHIEVERS SECTION (HOTS)
5 Videos
- GRAVITATION BOOK - SCIENCE OLYMPIAD FOUNDATION CHAPTER - GRAVITATION EXERCISE - ACHIEVERS SECTION (HOTS)
5 Videos
- NSO QUESTION PAPER 2016 SET A BOOK - SCIENCE OLYMPIAD FOUNDATION CHAPTER - NSO QUESTION PAPER 2016 SET A EXERCISE - ACHIEVERS SECTION
2 Videos
Similar Questions
Knowledge Check
The diagram shows the velocity-time graph for a particle moving in a straight line. The sum of the two shaded areas represents :
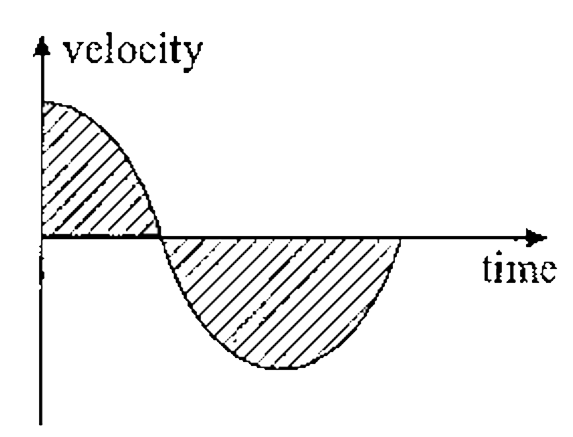 AThe increase in displacement of the particleBThe average velocity of the particleCThe average acceleration ofthe particleDThe distance moved by the particle
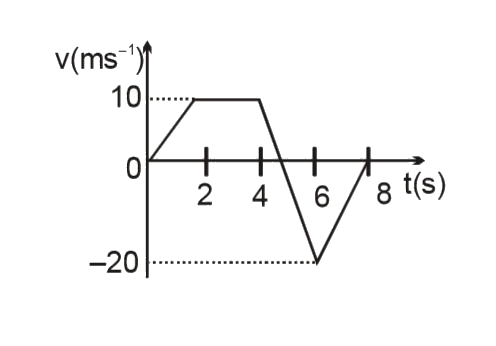
The velocity time graph of the motion of a car is given here.
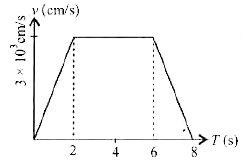 AThe distance travelled by the car in the first six seconds is 150 m.BThe deceleration of the car during the last two seconds are −15ms2.CThe distance travelled by the car in the first six second is 220 m.DThe deceleration of the car during the last two second is −20ms2
Figure shows position-time graph of two cars A and B.
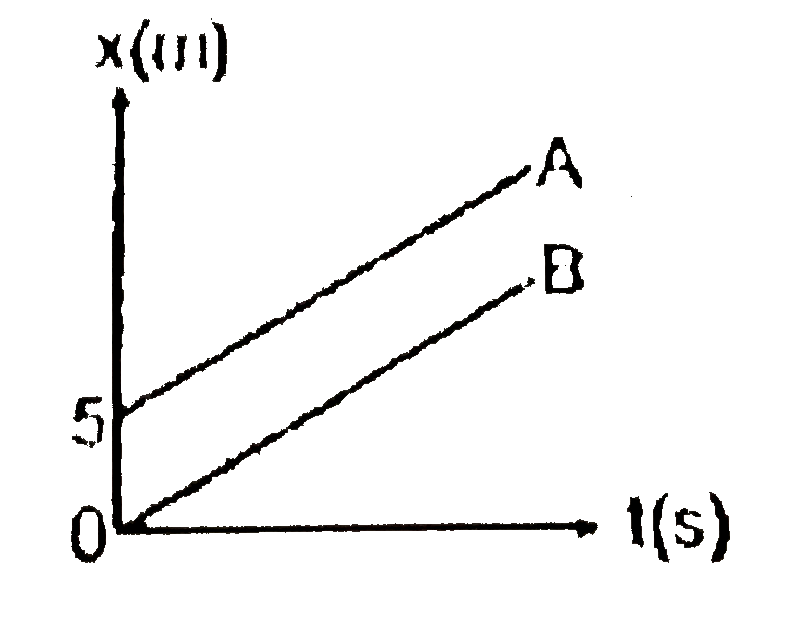 ACar A is faster than car B.BCar B is faster than car A.CBoth cars are moving with same velocity.DBoth cars have positive acceleration.
The figure shows a velocity-time graph of a particle moving along a straight line
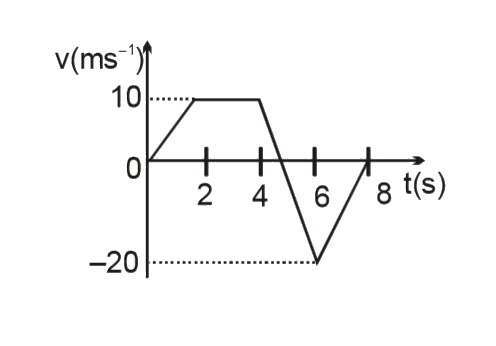
Q. The total distance travelled by the particle is
View SolutionThe figure shows a velocity-time graph of a particle moving along a straight line
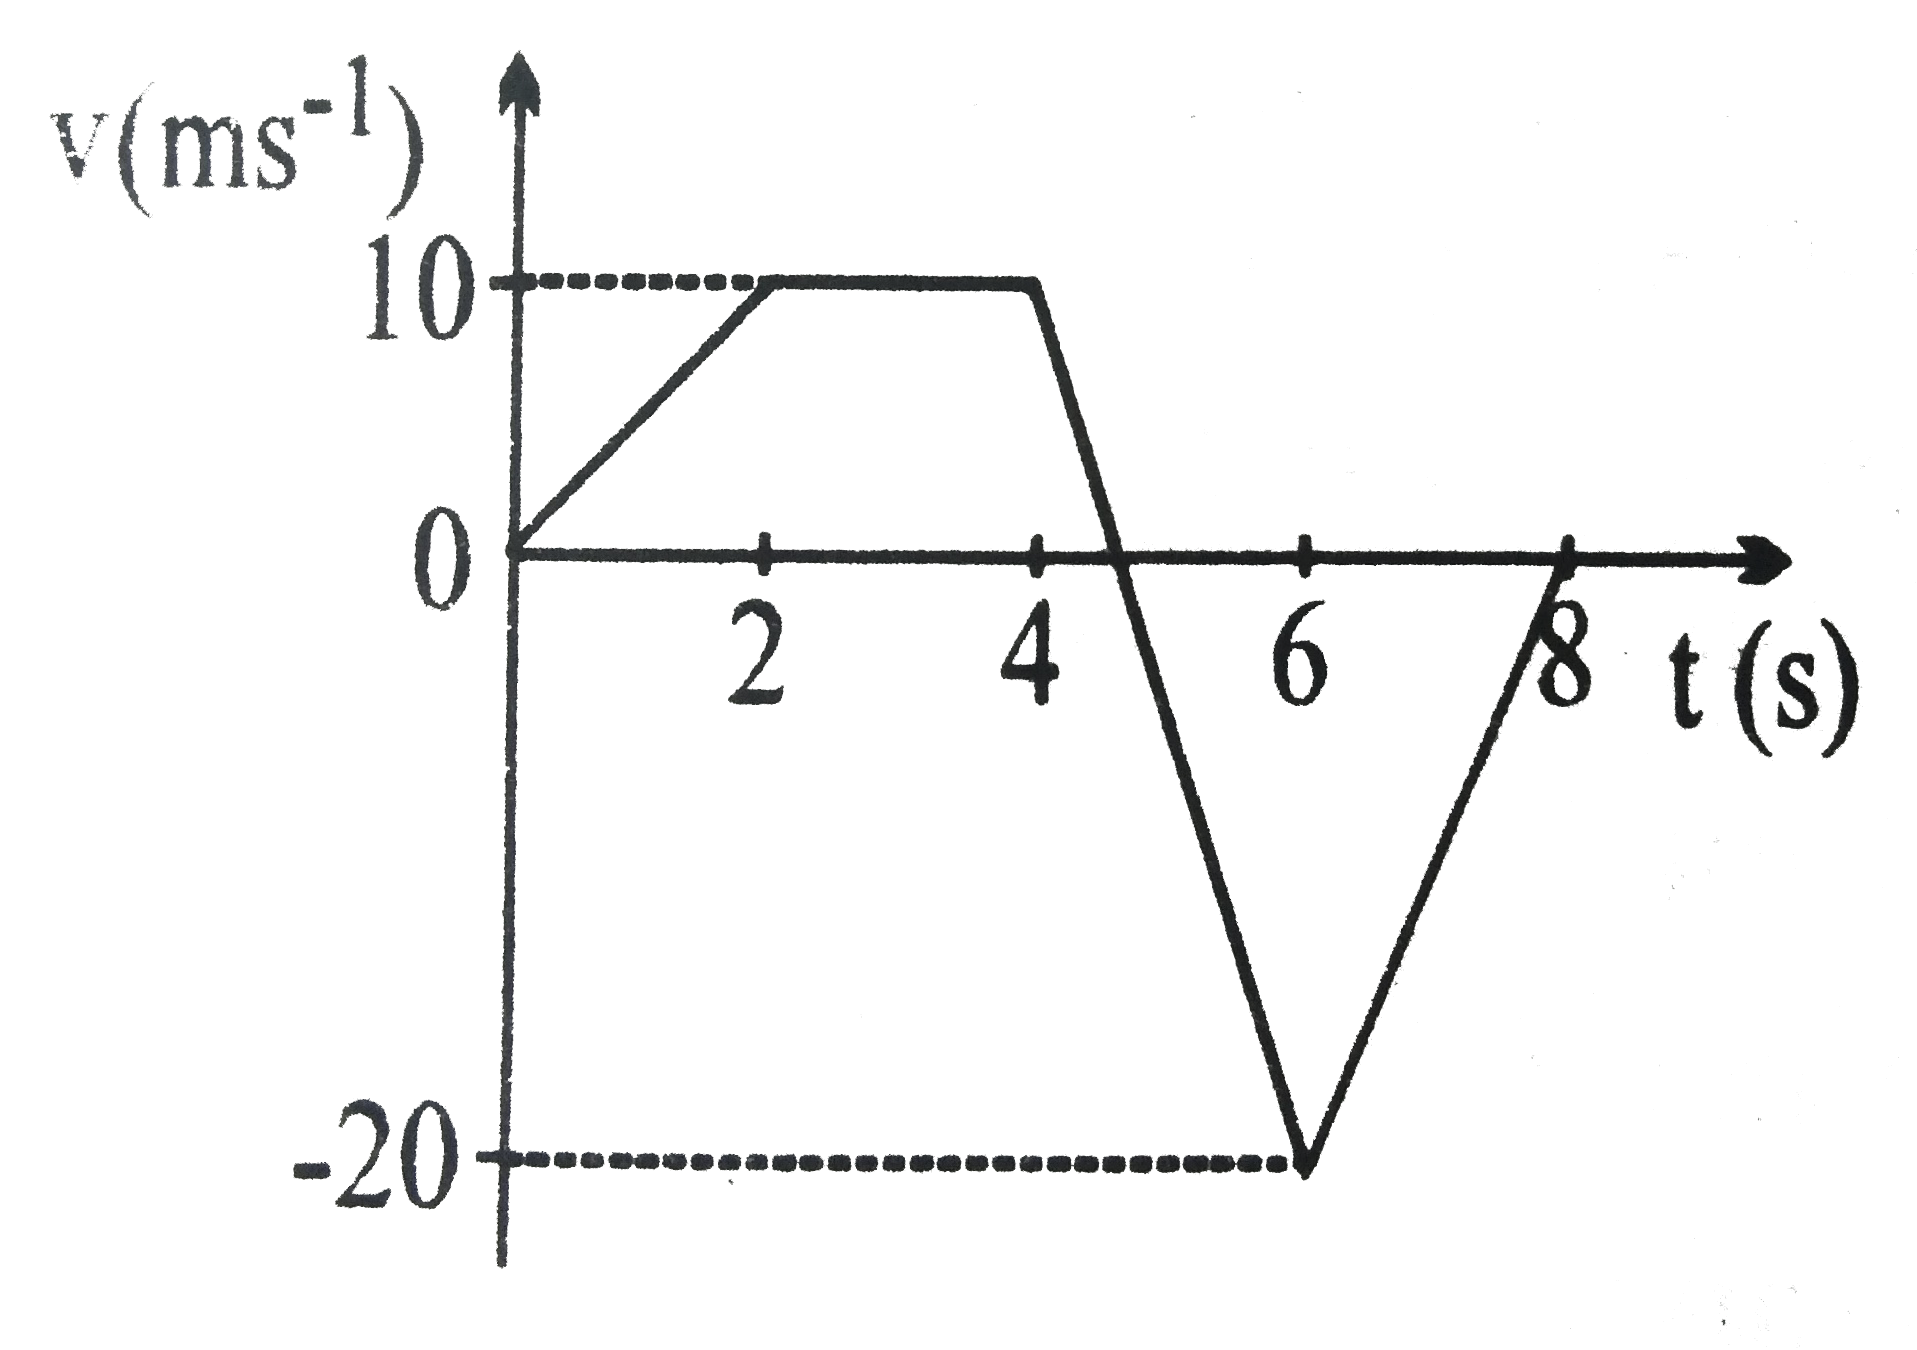
The total distance4 travelled by the particel is
View SolutionThe figure shows a velocity-time graph of a particle moving along a straight line
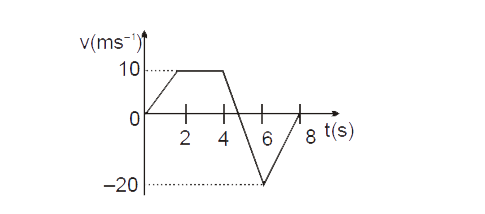
The total distance travelled by the particle is
View SolutionThe figure shows a velocity-time graph of a particle moving along a straight line
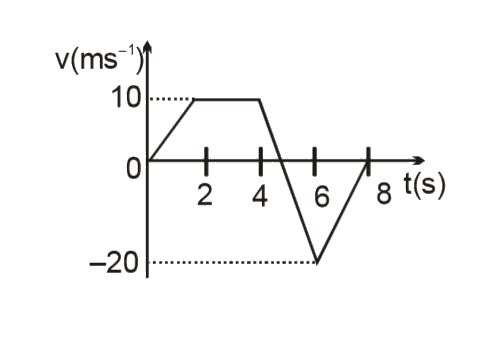
Q. The maximum of displacement of the particle is
View SolutionFigure shows a velocity-time graph. This shows that.
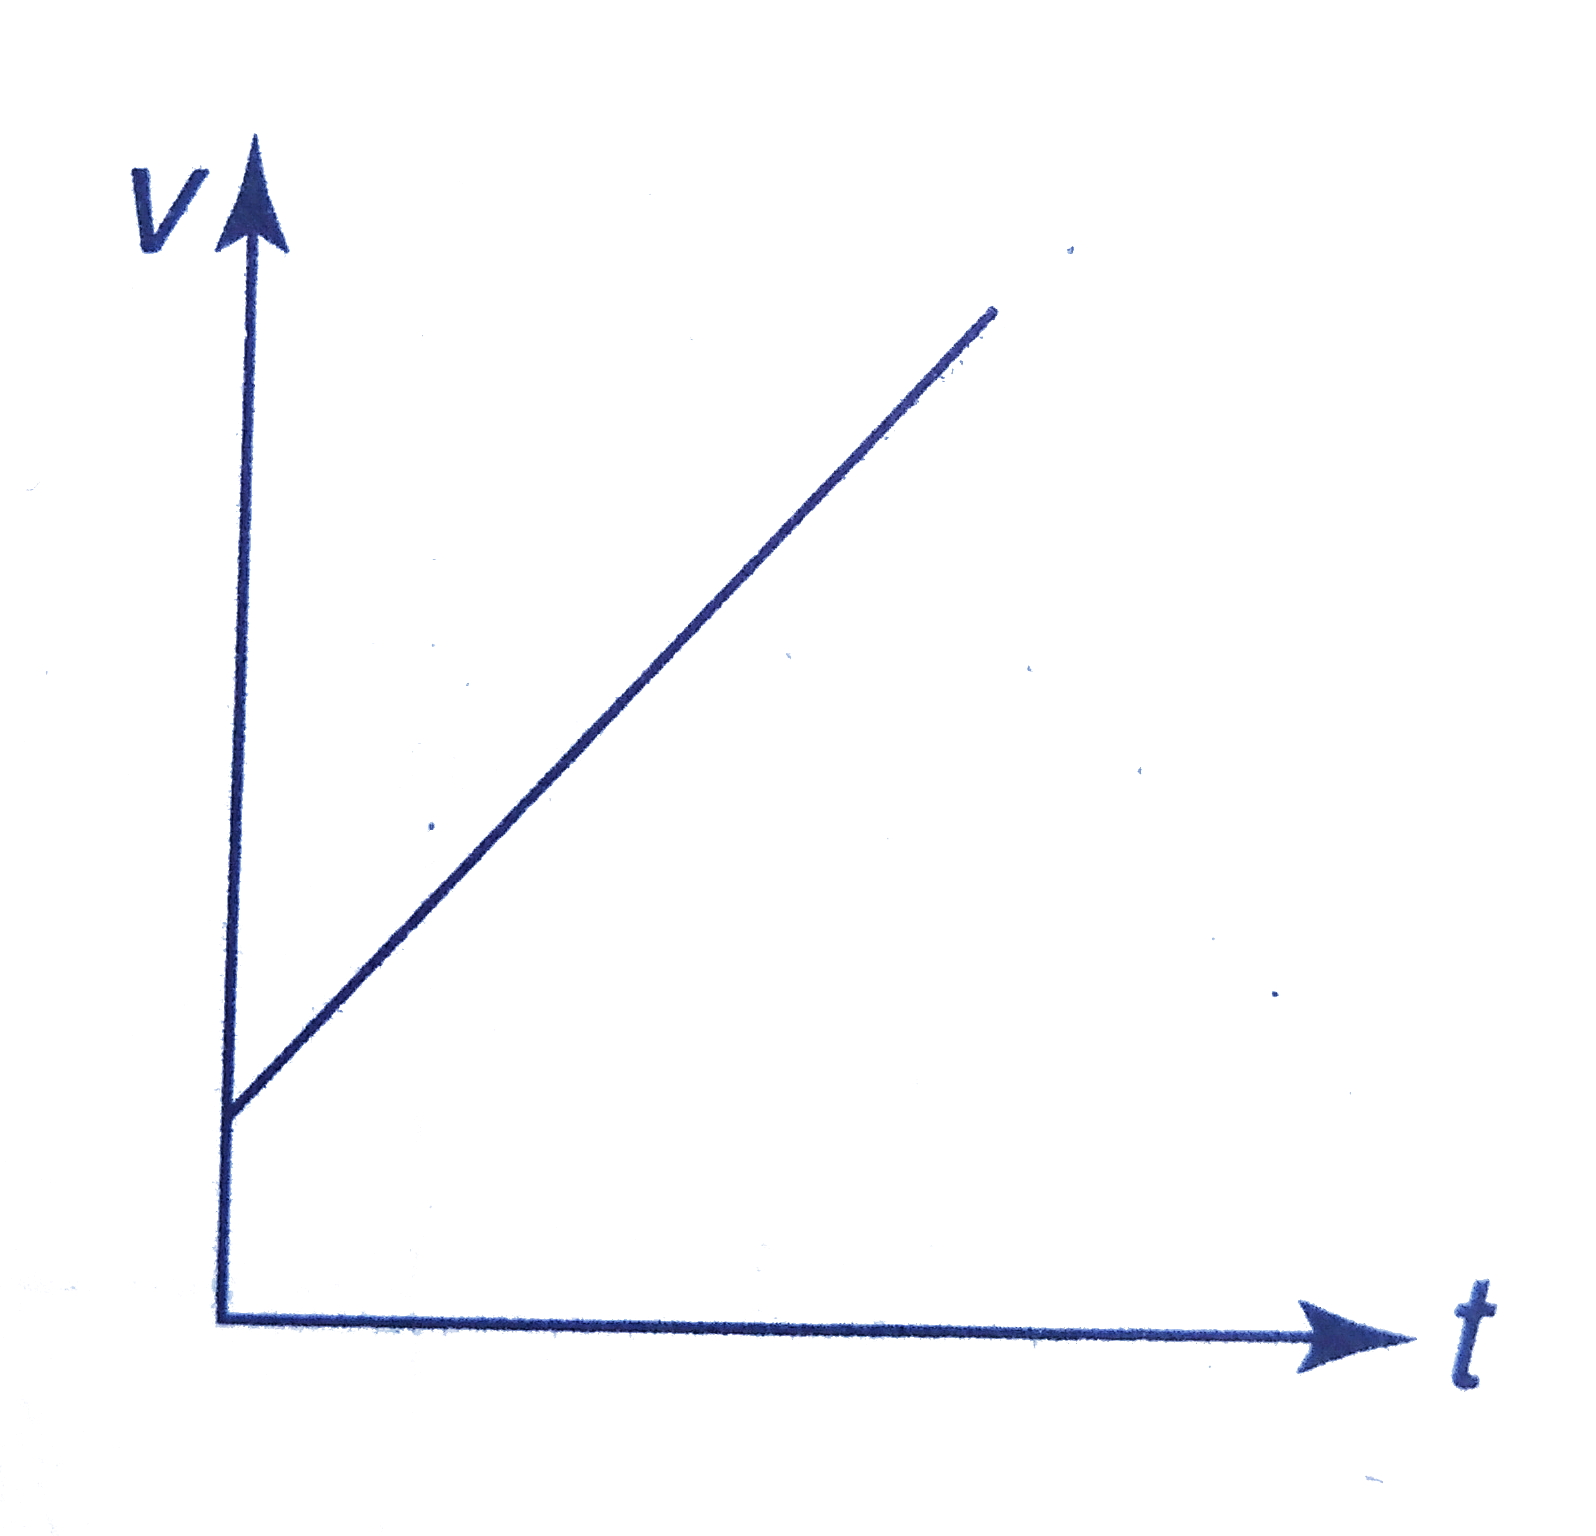
View Solution

