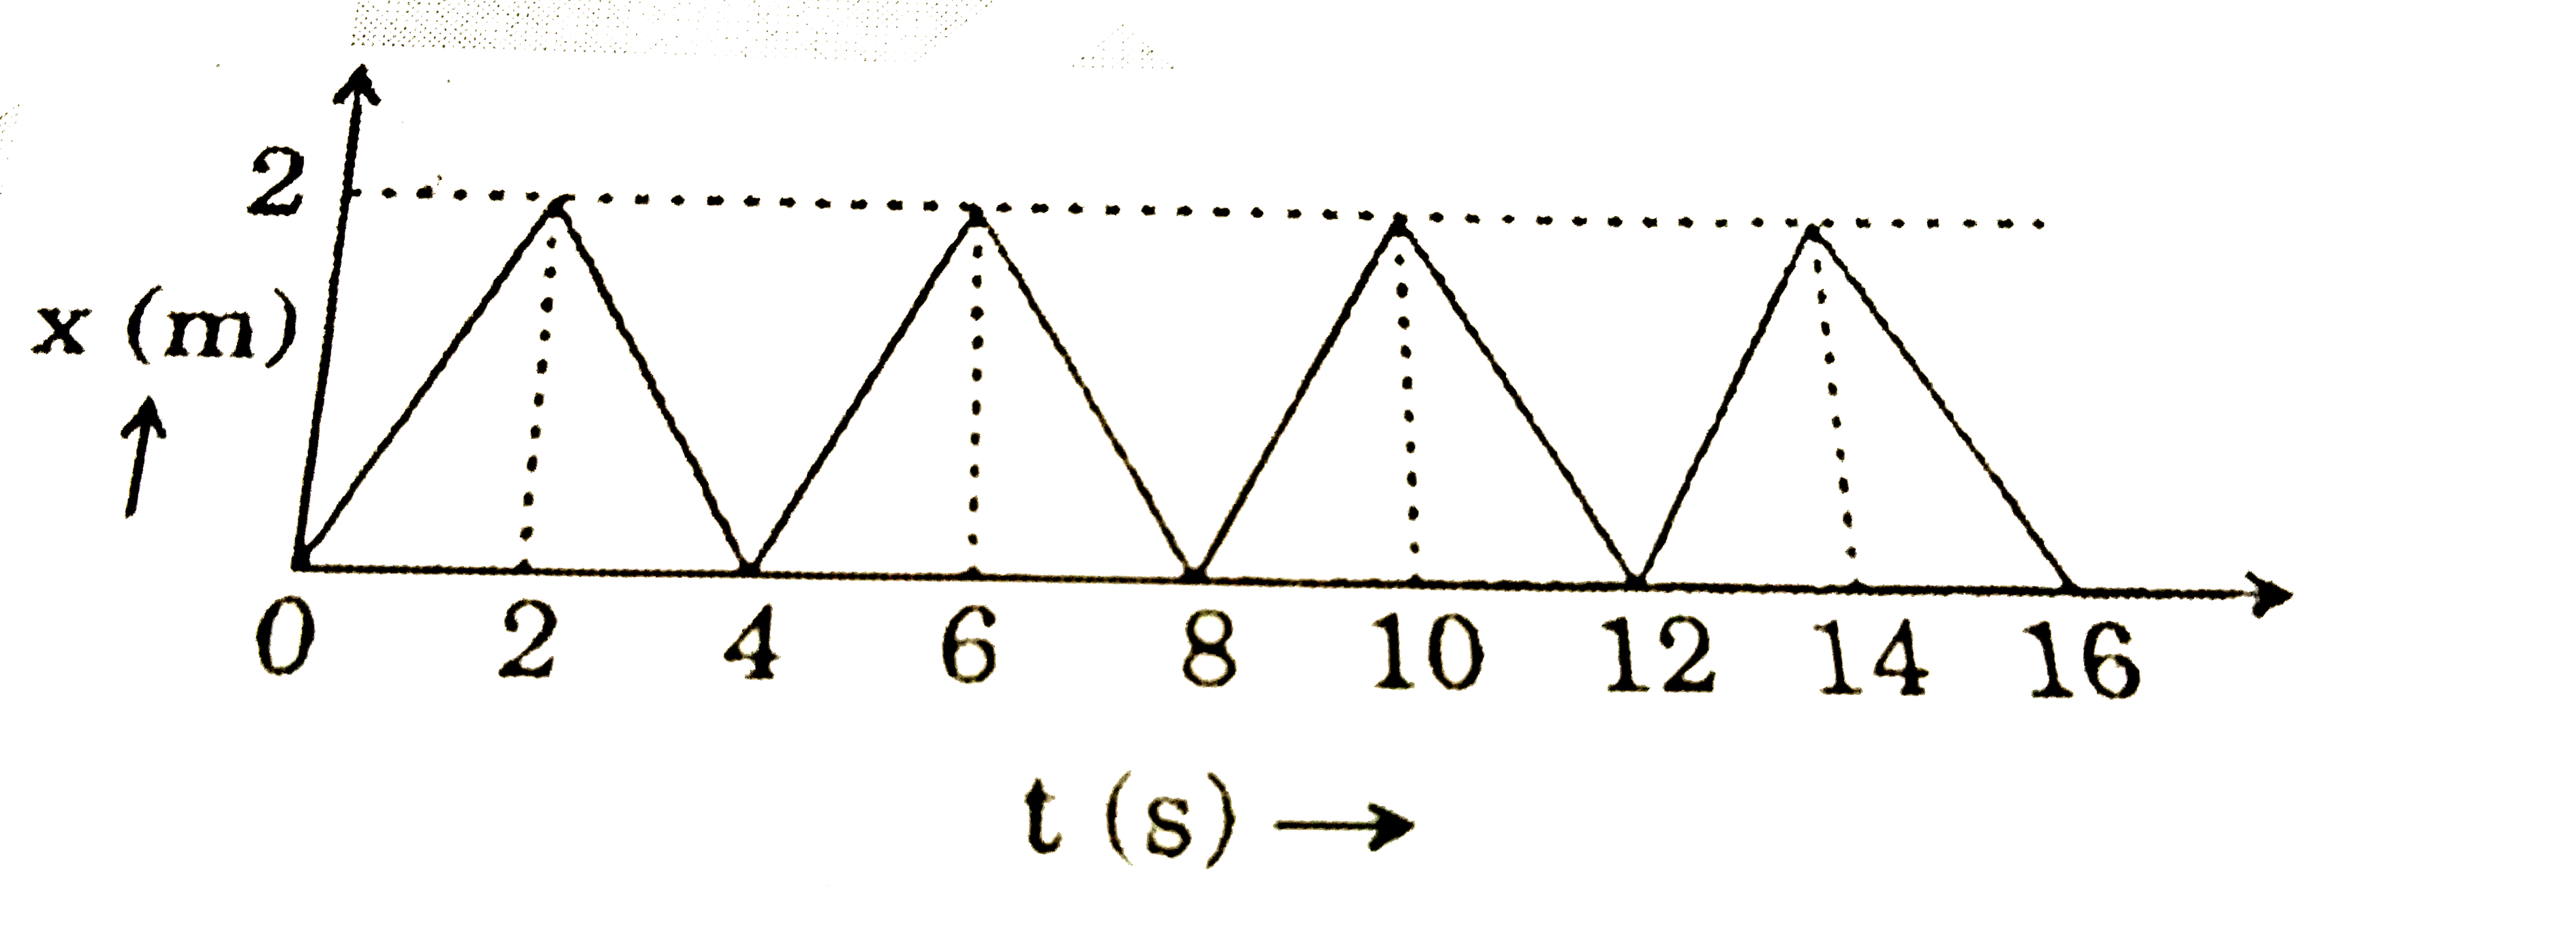
The figure shows the position time (x-t) graph of onc-dimensional motion of body of mass 0.4 kg. The magnitude of each impulse is

A
0.2Ns
B
0.4Ns
C
0.8Ns
D
1.6Ns
Text Solution
The correct Answer is:C
The straight line nature of the graph suggests that it is a uniform motion. The direction of x and hence v is changing because of impulse.
From the graph

Initial velocity u=2−02=1m/s(For0A)
∴ Initial momentum (pu)=mu=0.4×1=0.4N.s
Final velocity =0−24−2=−1m/s (For AB)
∴ Final momentum (pf)=0.4(0.1)=−0.4Ns
∴ impulse= Change in momentum
=pf−pi=−0.4−0.4=0.8Ns
∴ Magnitude of impulse =0.8 Ns
∴ (c) is the correct choice.
|
Updated on:21/07/2023
Topper's Solved these Questions
Similar Questions
Knowledge Check
- Question 1 - Select One
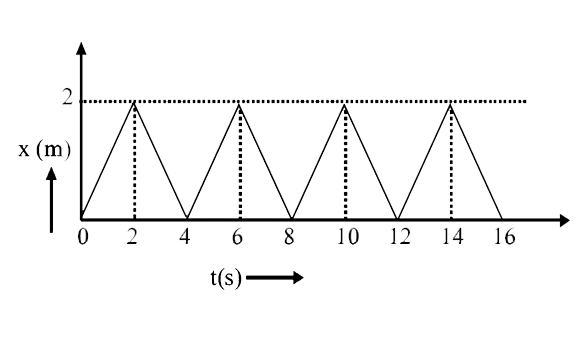
The figure shows the position-time (x-t) graph of one-dimensional motion of a body of mass 0.4kg. The magnitude of each impulse is
 A0.4NsB0.8NsC1.6NsD0.2Ns
 - Question 2 - Select One
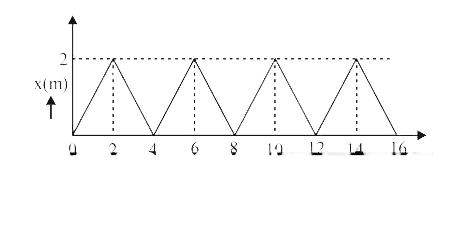
The figure shows the position – time (x – t) graph of one – dimensional motion of a body of mass 0.4 kg. The magnitude of each impulse is:
 A0.4 NsB0.8 NsC1.6 NsD0.2 Ns
 - Question 3 - Select One
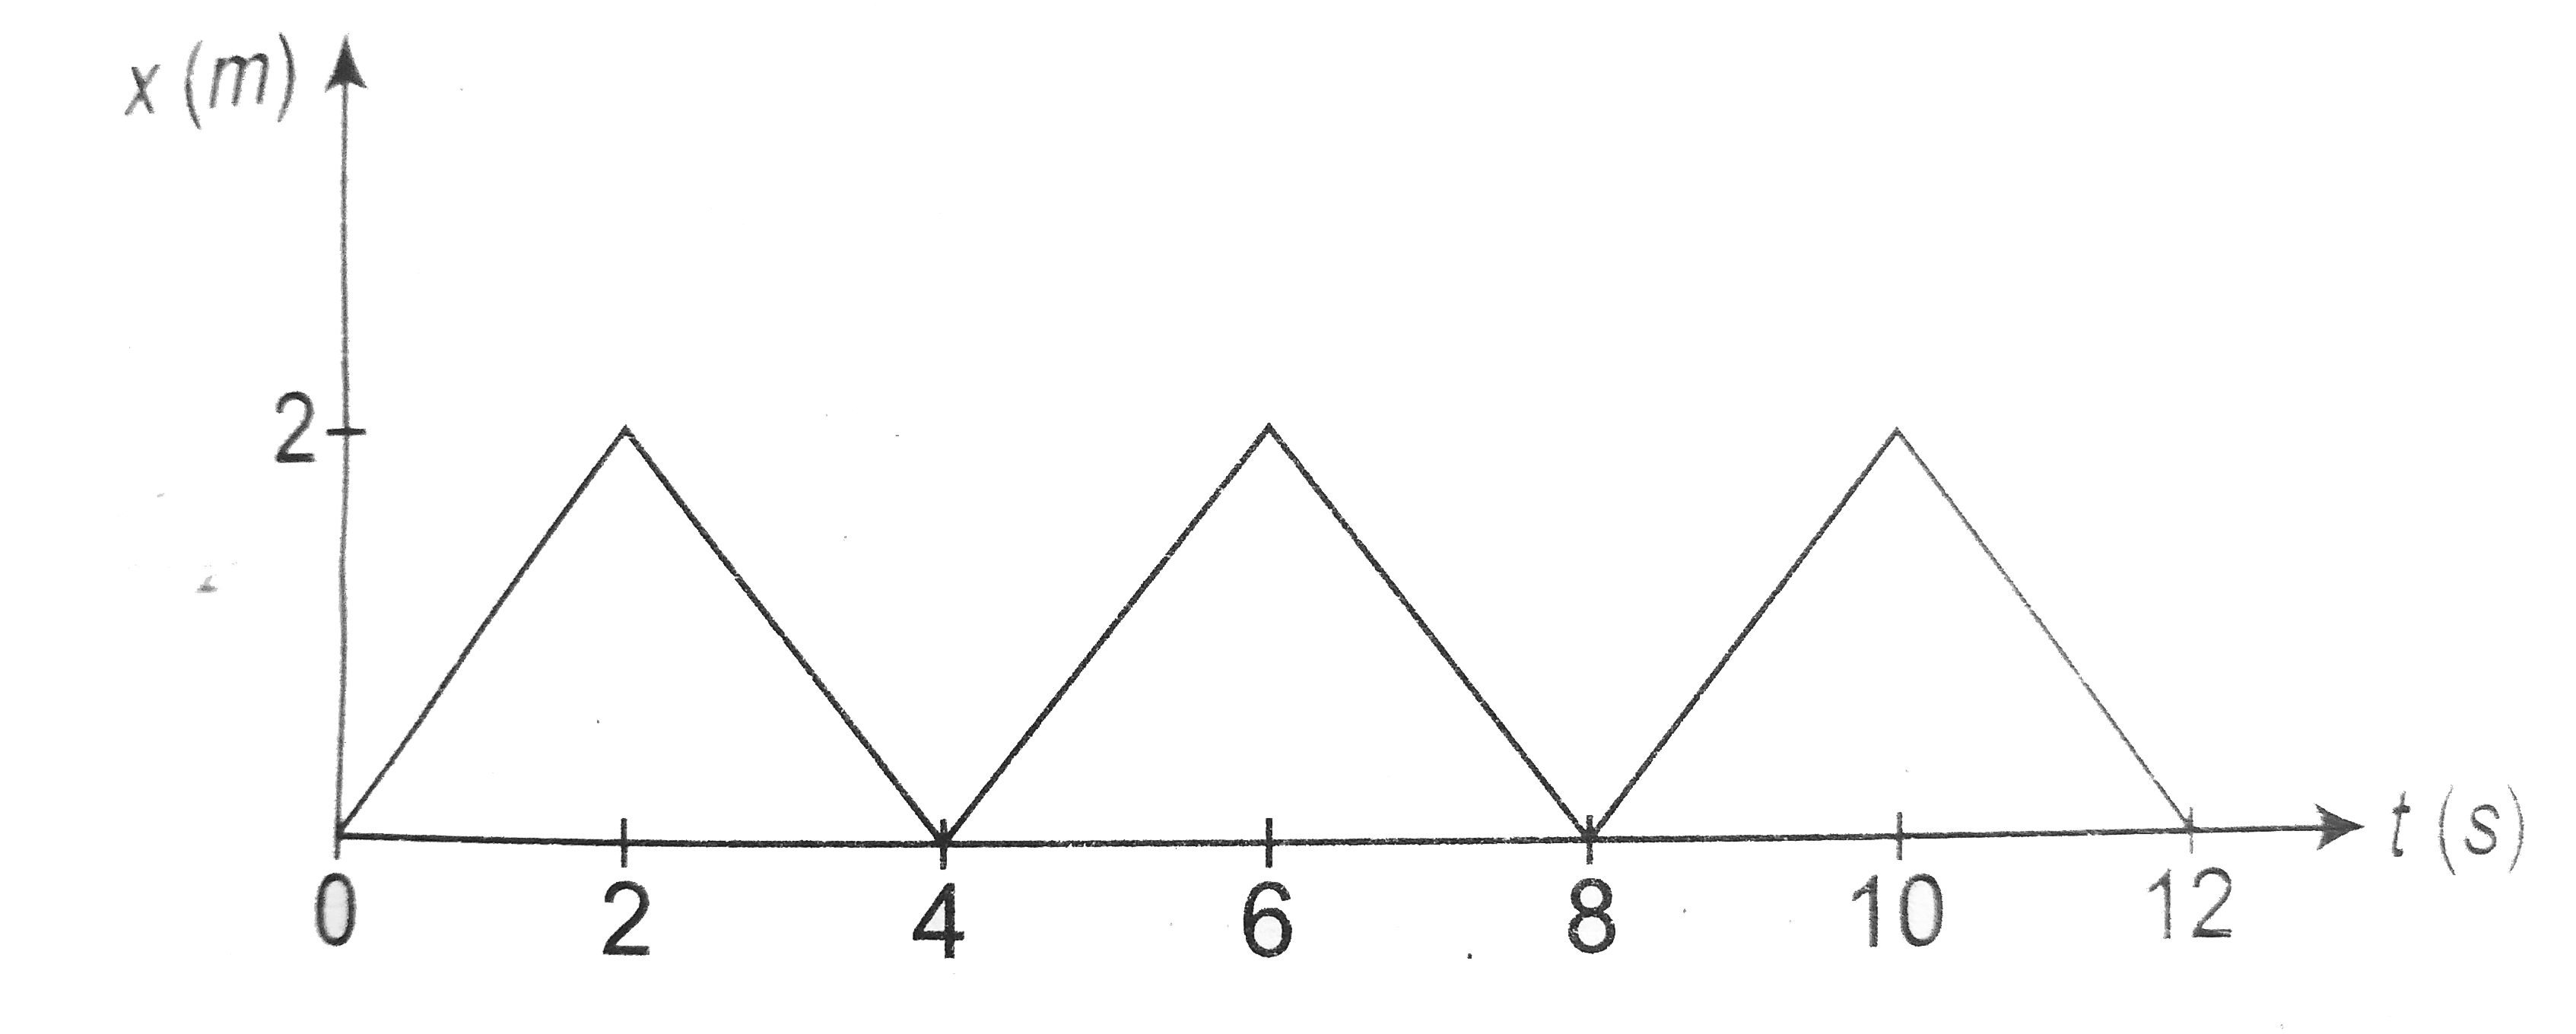
Figure shows the position-time (x-t) graph of one dimensional motion of a mass 500g. What is the time interval between two consecutive impulses received by the body?
 A2sB4sC6sD8s
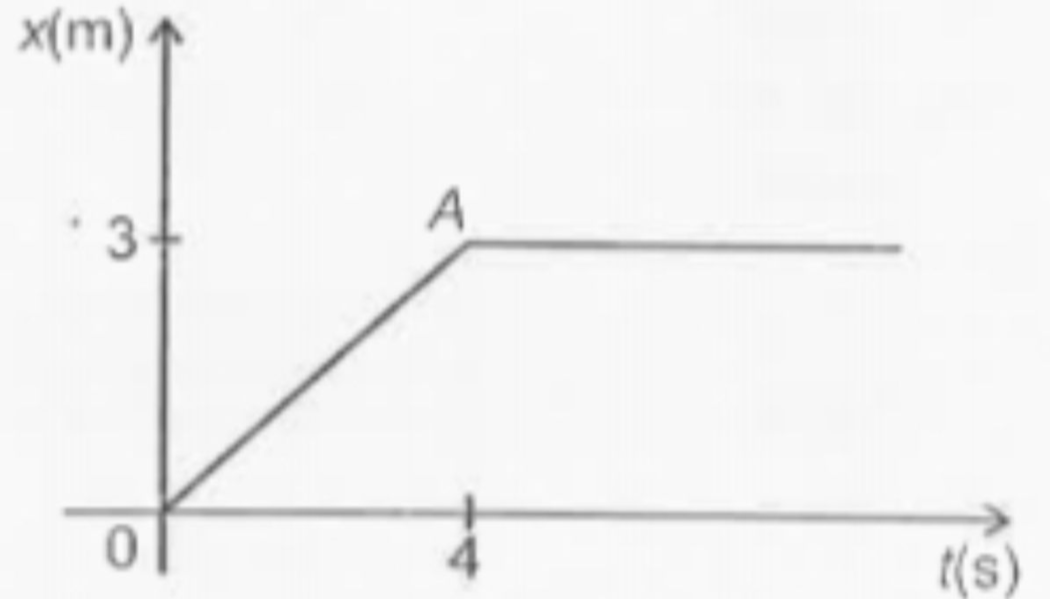
The figure shows the position time graph of a particle of mass 40 kg. What is the force acting on the particle of 0<t<4 s
 View Solution
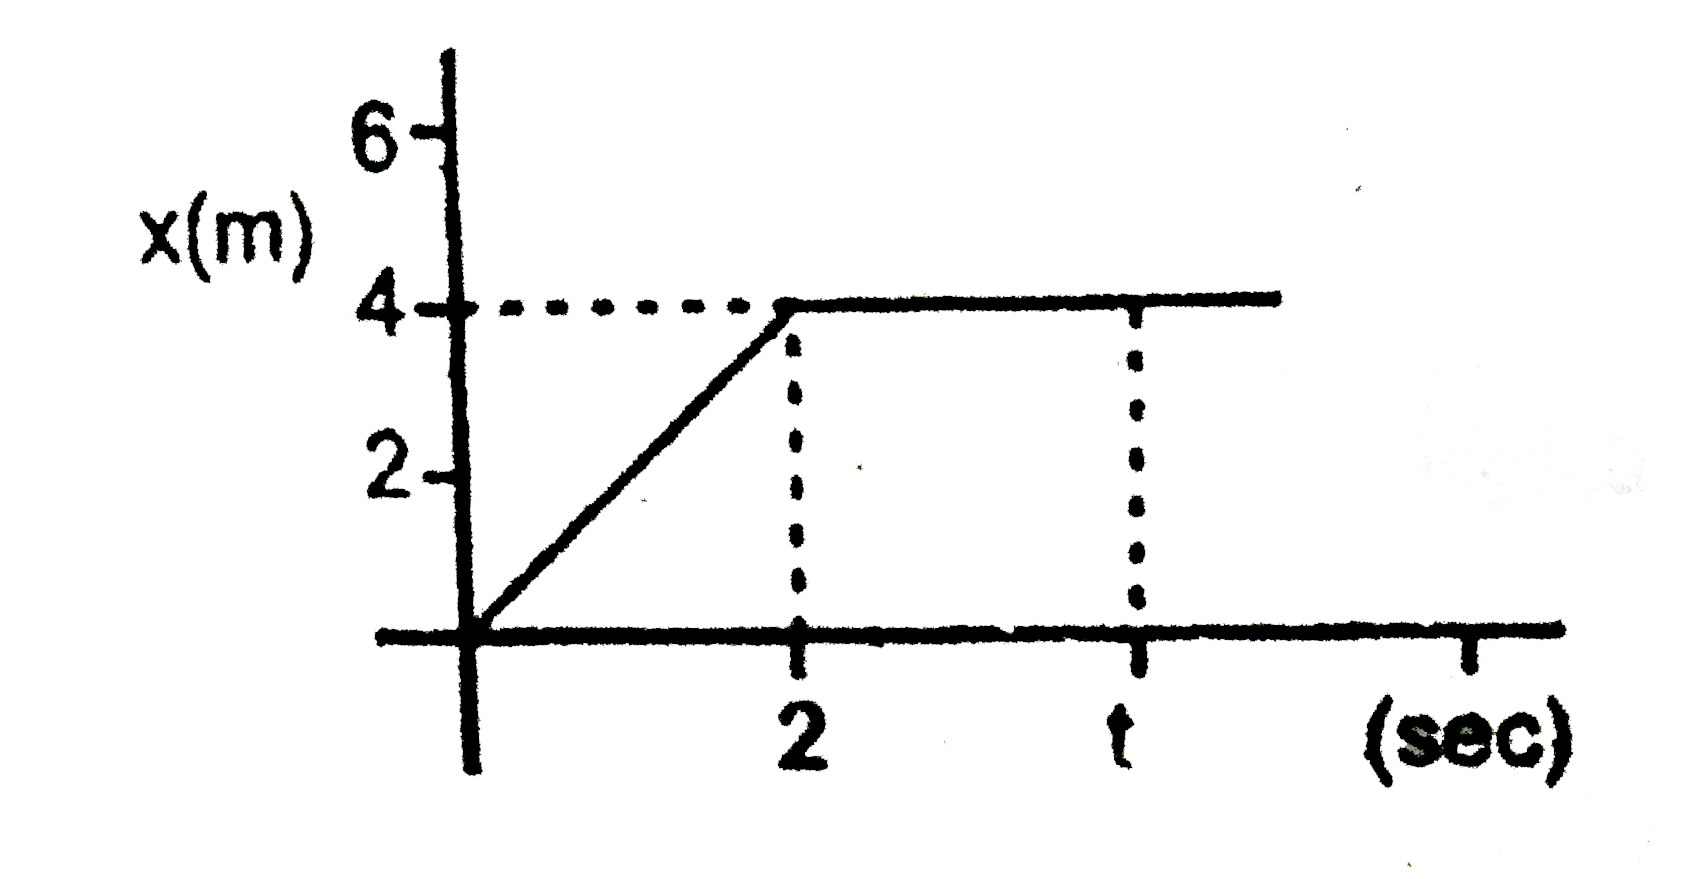
In the figure given below, the position time graph of a particle of mass 0.1kg is shown. The impulse at t=2 sec is
 View Solution
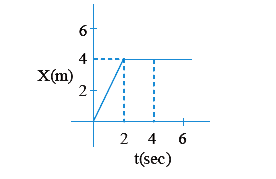
In the figure, the position time graph of a particle of mass 0.1 kg is shown. The impulse at t=2 second is :
 View Solution
Figure shows the position-time (x-t) graph of one dimensional motion of a mass 500g. What is the time interval between two consecutive impulses received by the body?
 View Solution
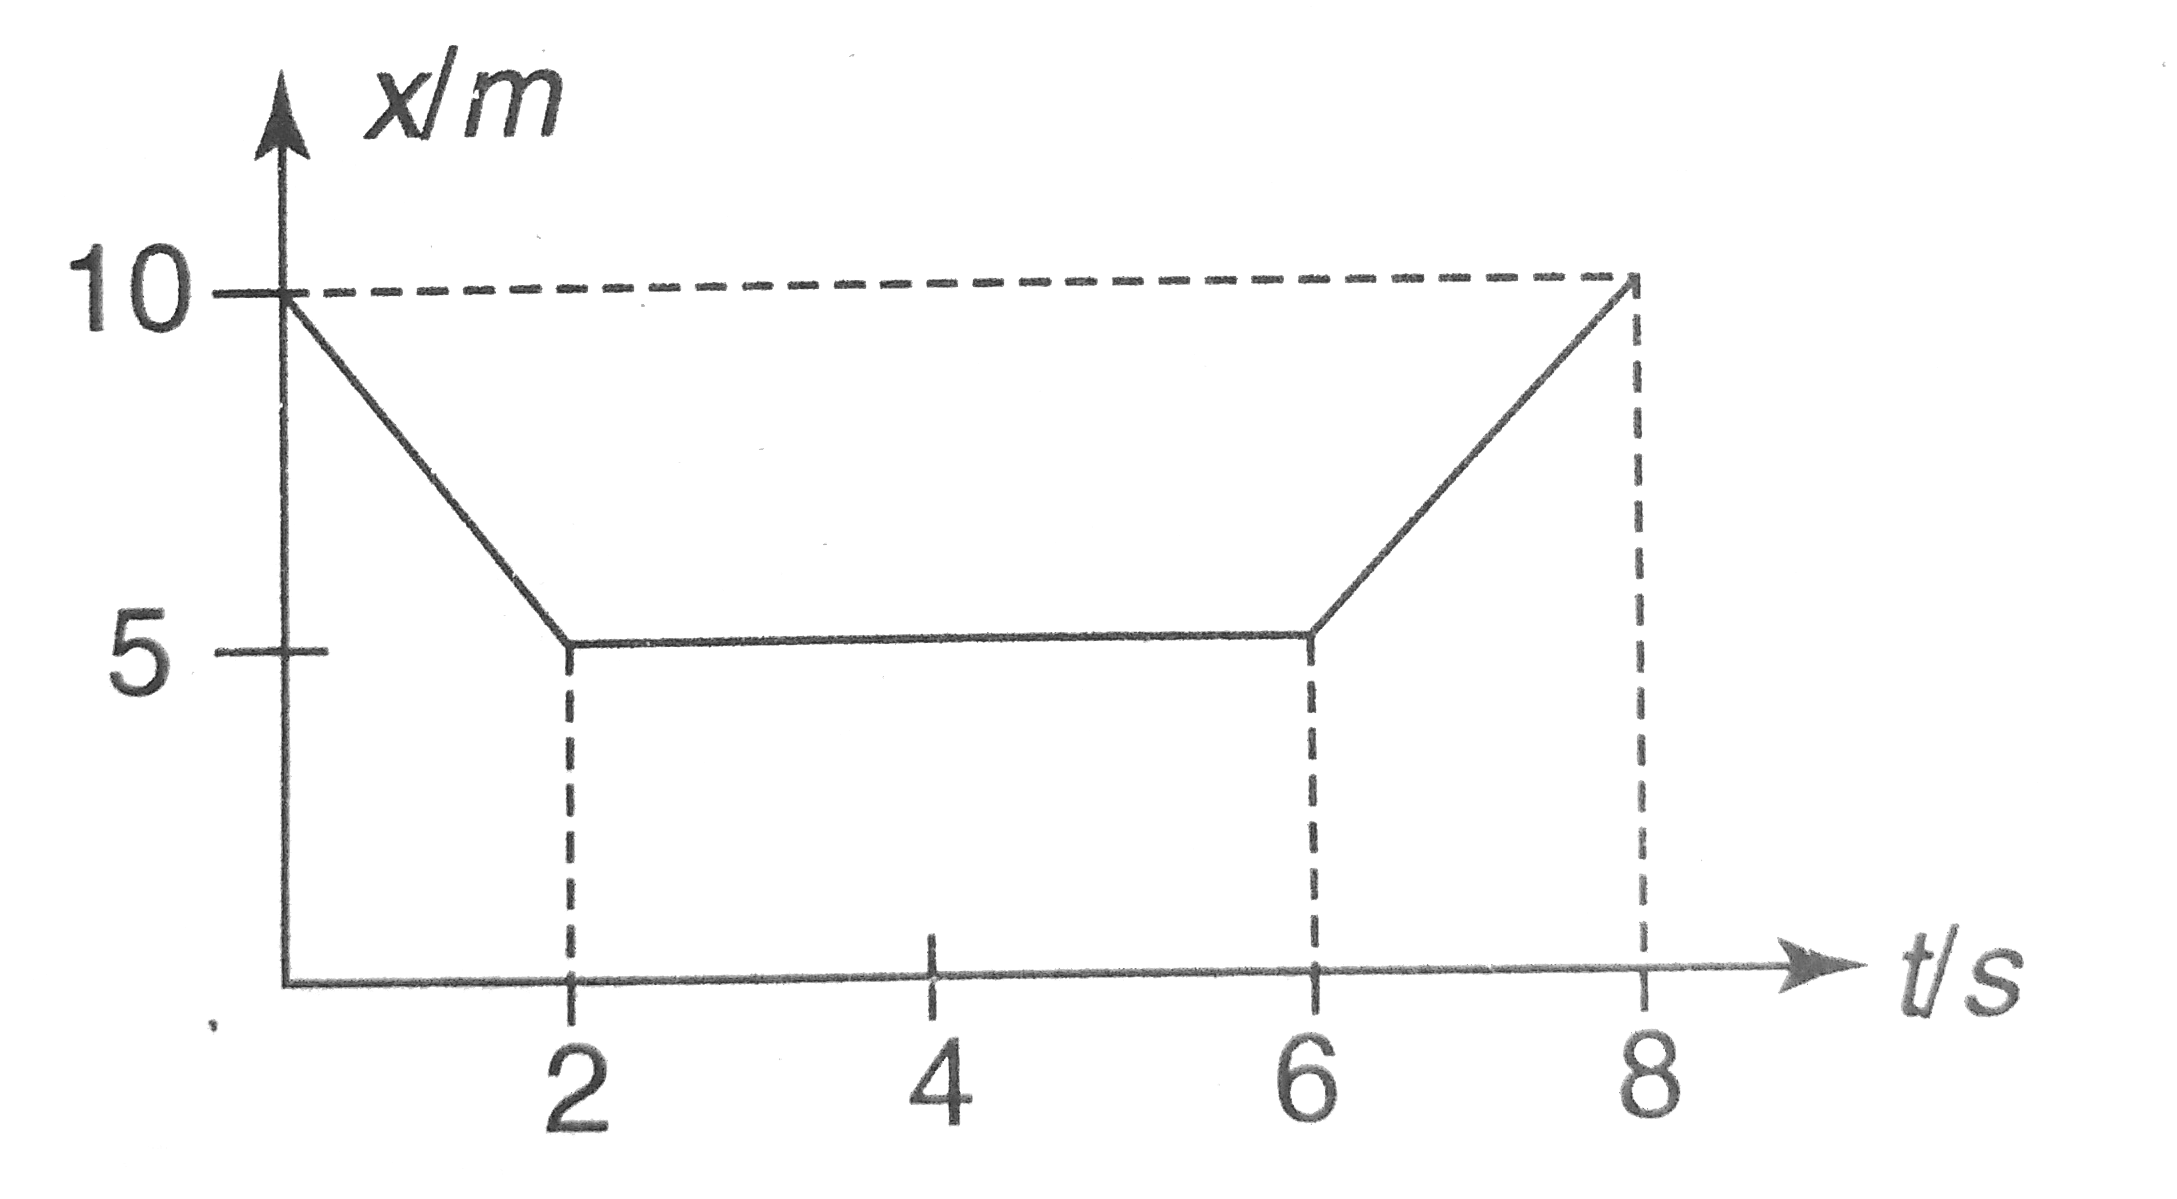
Figure shows the position time graph for a particle in one dimensional motion. What is the displacement of the particle in first 4 seconds ?
 View Solution


