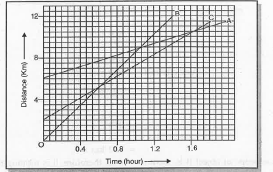
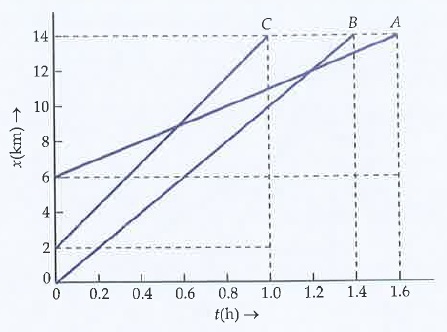
The following figure shows the distance time graph of three objects A,B and C. Study the graph and answer the following questions :
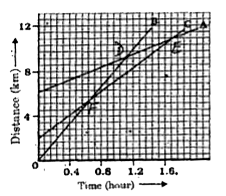
Which of the three is travelling the fastest ?
The slope of a distance - time graph gives its speed. The object having the maximum slop will travel the fastest. If we find the slope of A,B and C we will find that B has the greatest slope. Hence, B is travelling fastest.
Topper's Solved these Questions
- MOTIONBOOK - NAND LAL PUBLICATIONCHAPTER - MOTIONEXERCISE - ADDITIONAL QUESTIONS (Very Short Answer Type Question)
11 Videos
- MOTIONBOOK - NAND LAL PUBLICATIONCHAPTER - MOTIONEXERCISE - ADDITIONAL QUESTIONS (Short Answer Type Question)
1 Videos
- MOTIONBOOK - NAND LAL PUBLICATIONCHAPTER - MOTIONEXERCISE - INTEXT QUESTION
21 Videos
- GRAVITATIONBOOK - NAND LAL PUBLICATIONCHAPTER - GRAVITATIONEXERCISE - Additional Questions (Long Answer Type Questions)
1 Videos
- SOUNDBOOK - NAND LAL PUBLICATIONCHAPTER - SOUNDEXERCISE - Additional Question (Long Answer Type Questions)
2 Videos
Similar Questions
Fig 1.11 show the distance - time graphs of three A,B and C. Study the graph and answer the following question : Which of the three is travelling the fastest ?
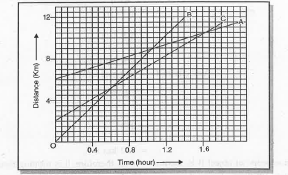
View SolutionFigure shows the distance-time graph of three object A,B and C. Study the graph and answer the following questions :
(a) Which of the three is travelling the fastest ?
(b) Are all three ever at the same point on the road ?
( c) How far has C travelld by when B passes A ?
(d) How far has B travelled by the time it passes C ?
View Solution
Knowledge Check
Study the graph carefully and answer the following questions.
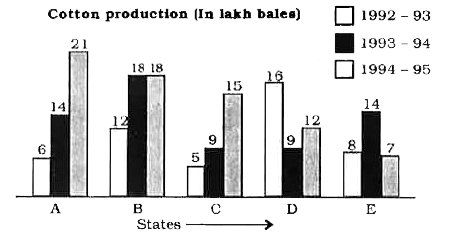
Which of the following statement is false ?AState A and E showed the same production in 1993-94.BThere was no improvement in the production of cotton in state B during 1994-95.CState A has produced maximum cotton during the given period.DProduction of state C and D together is equal to that of state B dring 1993-94.
Fig 1.11 show the distance - time graphs of three A,B and C. Study the graph and answer the following question : How far has C travelled when B passes A ?
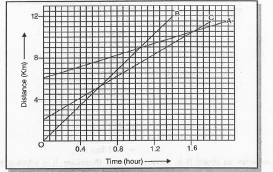
View SolutionFig 1.11 show the distance - time graphs of three A,B and C. Study the graph and answer the following question : Are all three ever at the same point on the road ?
View SolutionStudy the bar graph and answer the following questions.
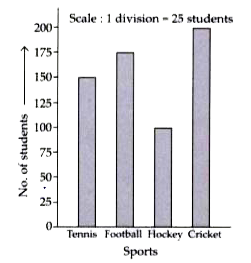
Which is the most popular sport ?
View SolutionStudy the bar graph and answer the following questions.
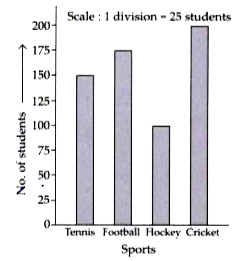
Which sport is preferred least ?
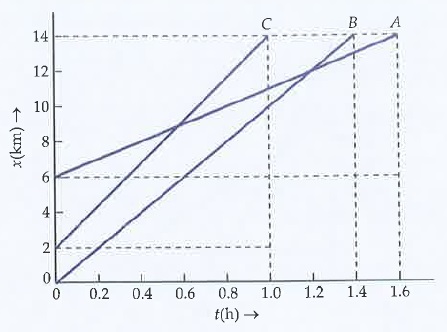
View SolutionFigure 3.64 shows the position-time graphs of three car A, B and C. On the basis of the graphs, answer the following questions : Which car has the highest speed and which the lowest ?
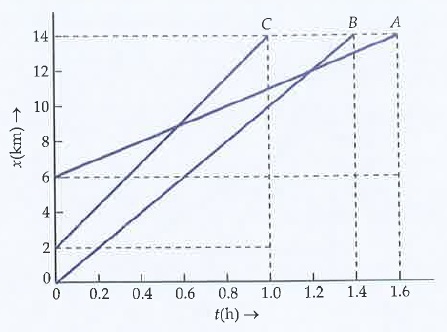
View SolutionFigure 3.64 shows the position-time graphs of three car A, B and C. On the basis of the graphs, answer the following questions : When A passes C, where is B ?
View SolutionFigure 3.64 shows the position-time graphs of three car A, B and C. On the basis of the graphs, answer the following questions : Are the three cars ever at the same point on the road ?
View Solution
