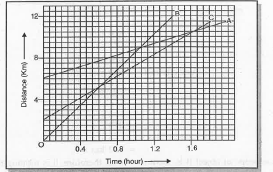
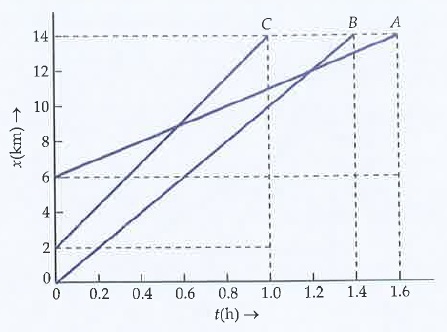
The following figure shows the distance time graph of three objects A,B and C. Study the graph and answer the following questions :
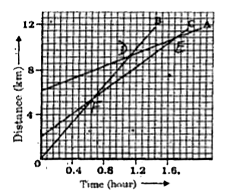
How far has C travelled when B passes A ?
The graph of A and B intersect at D. (at hours). At this time C is a distance of 8 km.
Topper's Solved these Questions
- MOTIONBOOK - NAND LAL PUBLICATIONCHAPTER - MOTIONEXERCISE - ADDITIONAL QUESTIONS (Very Short Answer Type Question)
11 Videos
- MOTIONBOOK - NAND LAL PUBLICATIONCHAPTER - MOTIONEXERCISE - ADDITIONAL QUESTIONS (Short Answer Type Question)
1 Videos
- MOTIONBOOK - NAND LAL PUBLICATIONCHAPTER - MOTIONEXERCISE - INTEXT QUESTION
21 Videos
- GRAVITATIONBOOK - NAND LAL PUBLICATIONCHAPTER - GRAVITATIONEXERCISE - Additional Questions (Long Answer Type Questions)
1 Videos
- SOUNDBOOK - NAND LAL PUBLICATIONCHAPTER - SOUNDEXERCISE - Additional Question (Long Answer Type Questions)
2 Videos
Similar Questions
Fig 1.11 show the distance - time graphs of three A,B and C. Study the graph and answer the following question : How far has C travelled when B passes A ?
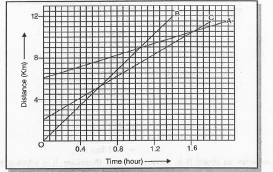
View SolutionFig 1.11 show the distance - time graphs of three A,B and C. Study the graph and answer the following question : Which of the three is travelling the fastest ?
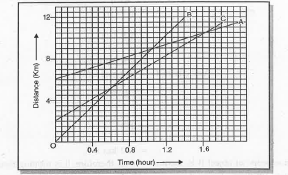
View Solution
Knowledge Check
The following figure shows the velocity time graph of a body. According to this at the point B-
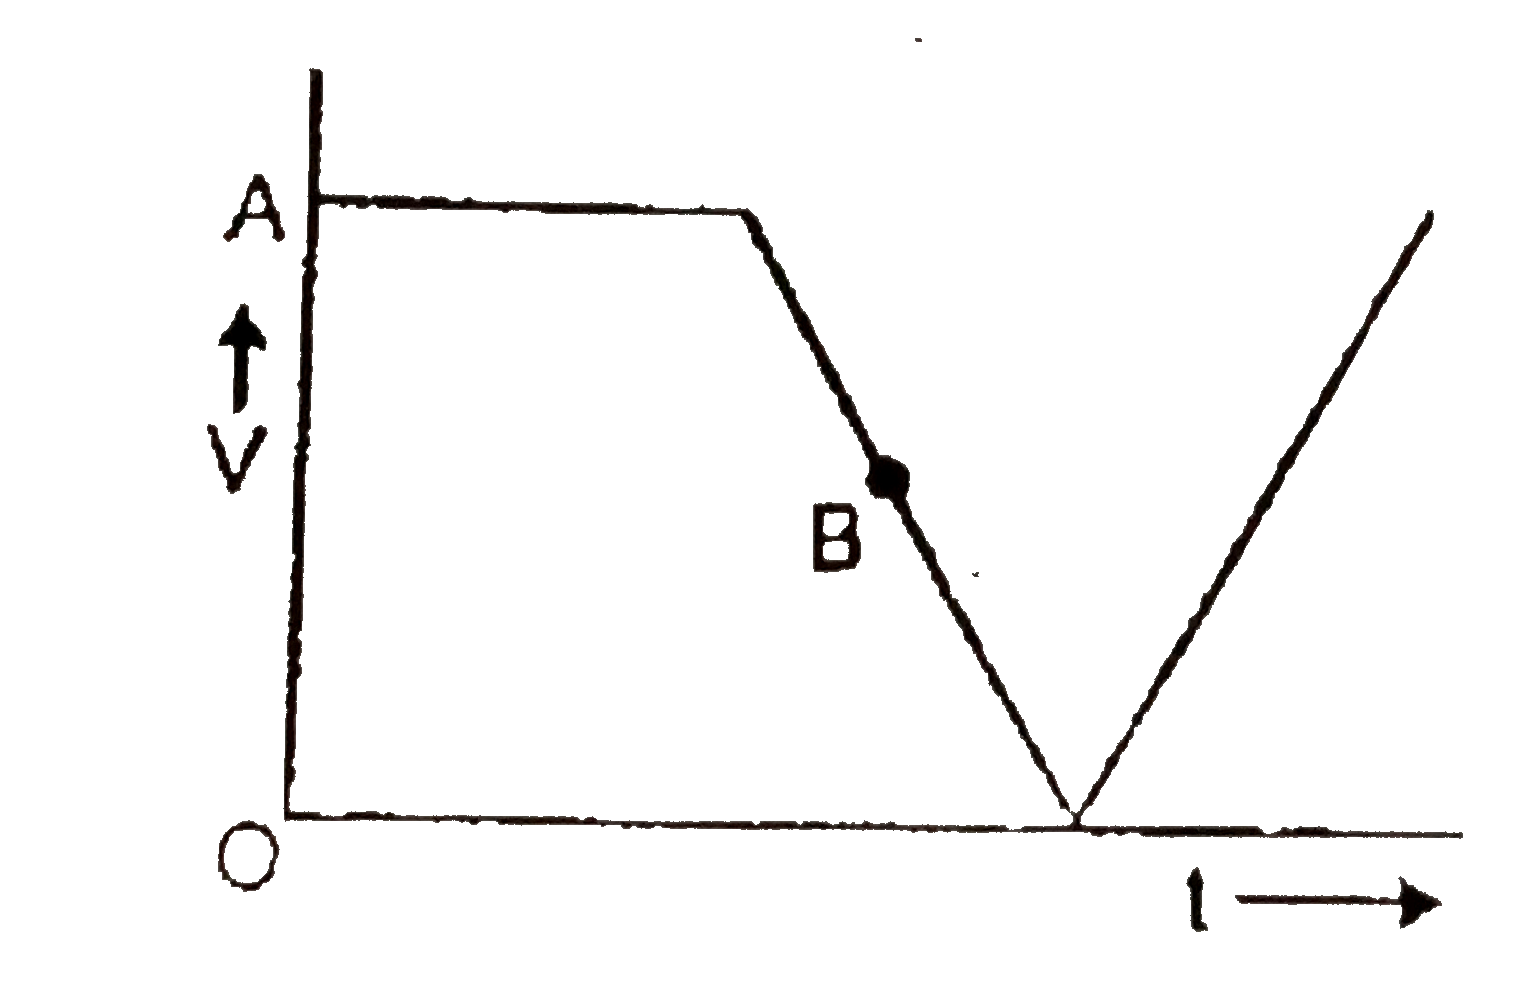 AThe force is zeroBThe force is in the direction of the motionCThe force is in opposite direction of the motionDIt is only the gravitational force
Figure shows the distance-time graph of three object A,B and C. Study the graph and answer the following questions :
(a) Which of the three is travelling the fastest ?
(b) Are all three ever at the same point on the road ?
( c) How far has C travelld by when B passes A ?
(d) How far has B travelled by the time it passes C ?
View SolutionFig 1.11 show the distance - time graphs of three A,B and C. Study the graph and answer the following question : Are all three ever at the same point on the road ?
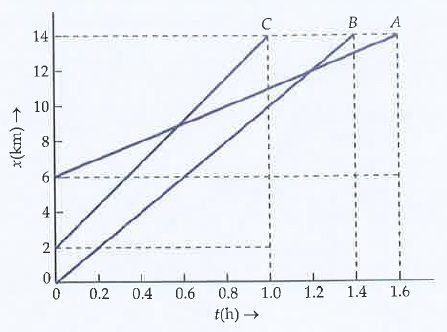
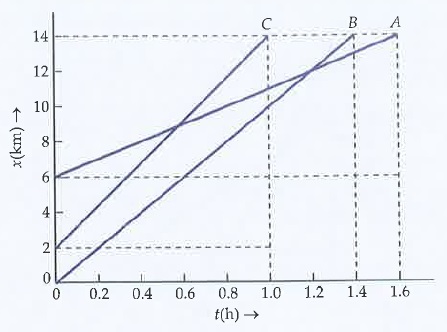
View SolutionFigure 3.64 shows the position-time graphs of three car A, B and C. On the basis of the graphs, answer the following questions : How far did car A travel between the time it passed cars B and C ?
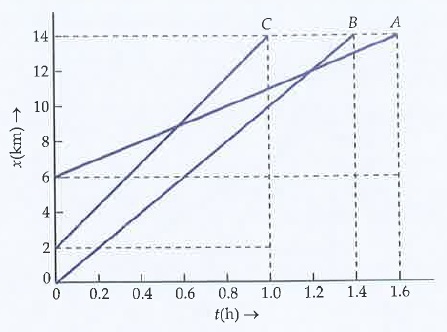
View SolutionFigure 3.64 shows the position-time graphs of three car A, B and C. On the basis of the graphs, answer the following questions : When A passes C, where is B ?
View SolutionFigure shows the position-time graphs of three car A, B and C. On the basis of the graphs, answer the following questions : What is the relative velocity of car B with respect to car C ?
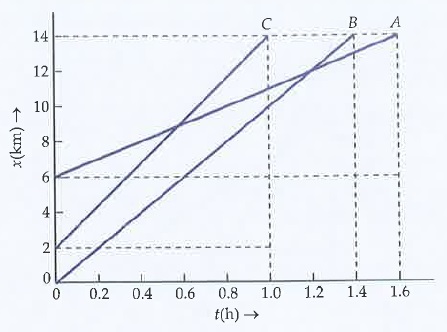
View SolutionFigure 3.64 shows the position-time graphs of three car A, B and C. On the basis of the graphs, answer the following questions : Which car has the highest speed and which the lowest ?
View SolutionFigure shows the position-time graphs of three car A, B and C. On the basis of the graphs, answer the following questions : What is the relative velocity of car C with respect to car A ?
View Solution
