The force F acting on a particle is moving in a straight line as shown in figure. What is the work done by the force on the particle in the 4 m of the trajectory? 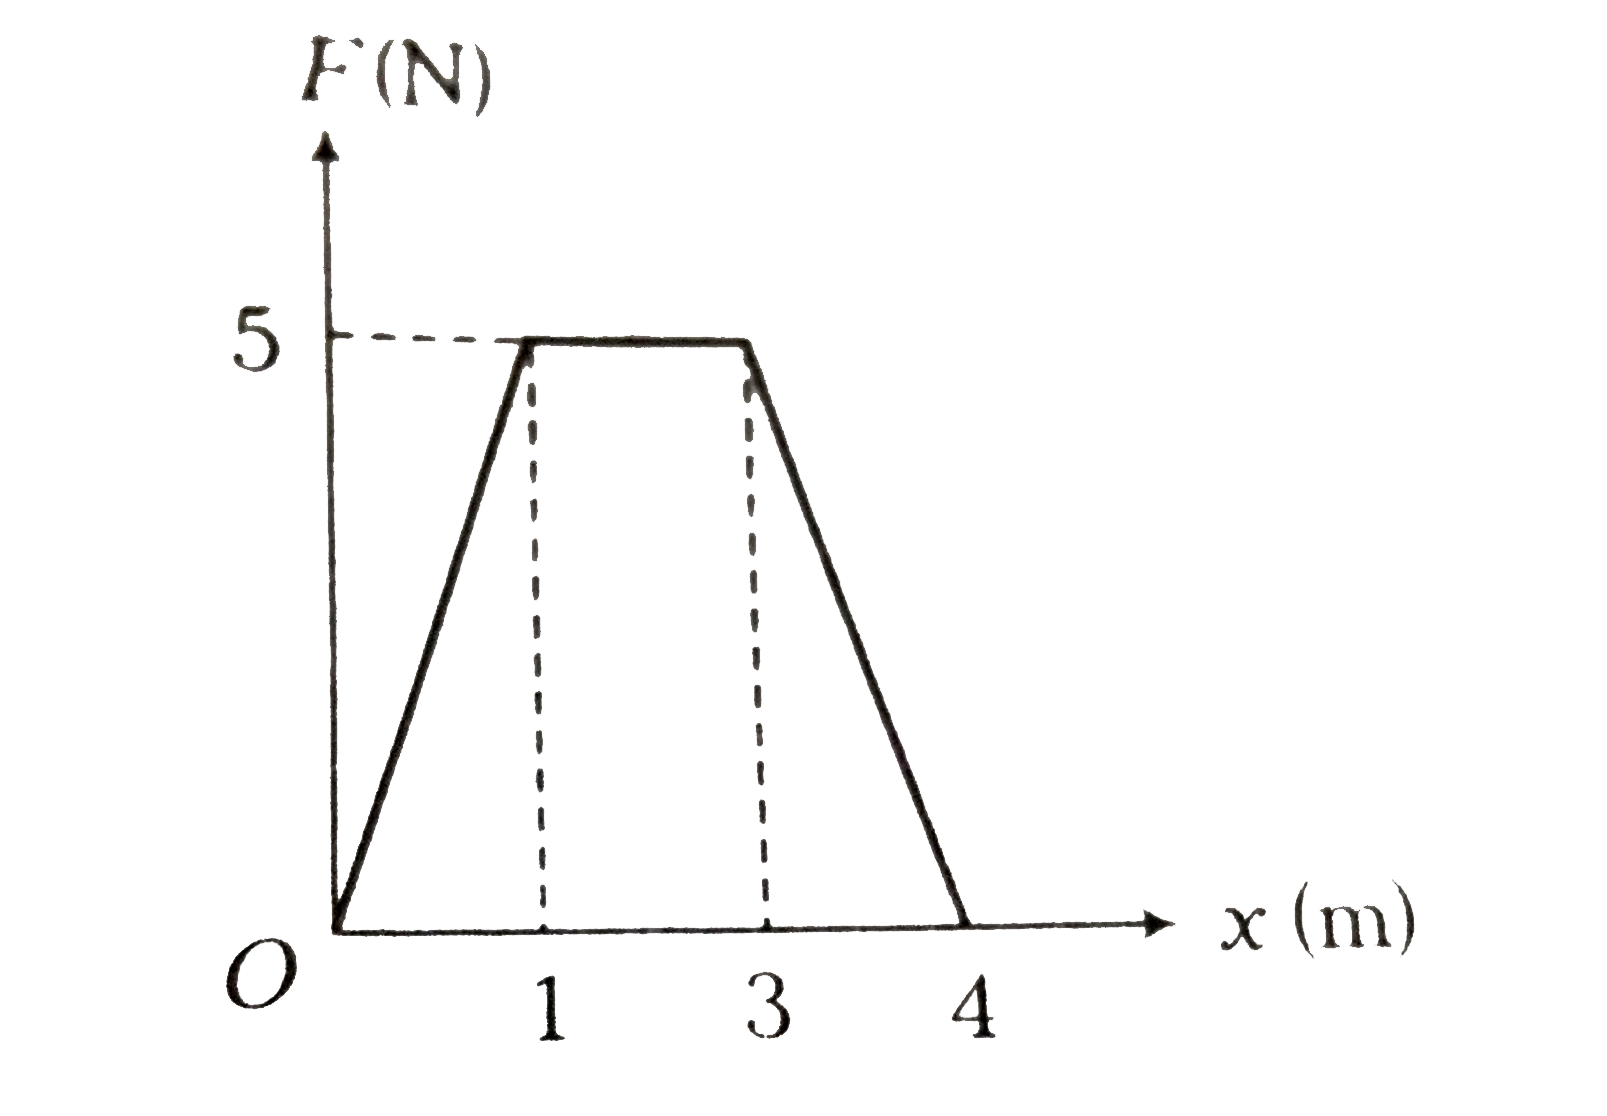
A
5 J
B
10 J
C
15 J
D
2.5 J
Video Solution
Text Solution
The correct Answer is:C
(c ) W= area under F-x graph
Area of trapezium=12×(4+2)×5=15J
|
Topper's Solved these Questions
- WORK, ENERGY AND POWERBOOK - DC PANDEYCHAPTER - WORK, ENERGY AND POWEREXERCISE - CHECK POINT 6.2
20 Videos
- WORK, ENERGY AND POWERBOOK - DC PANDEYCHAPTER - WORK, ENERGY AND POWEREXERCISE - CHECK POINT 6.3
10 Videos
- WORK, ENERGY AND POWERBOOK - DC PANDEYCHAPTER - WORK, ENERGY AND POWEREXERCISE - MEDICAL ENTRACES GALLERY
33 Videos
- WORK, ENERGY & POWERBOOK - DC PANDEYCHAPTER - WORK, ENERGY & POWEREXERCISE - Level 2 Comprehension Based
2 Videos
- WORK, POWER AND ENERGYBOOK - DC PANDEYCHAPTER - WORK, POWER AND ENERGYEXERCISE - E Integer Type Questions
11 Videos
Similar Questions
Knowledge Check
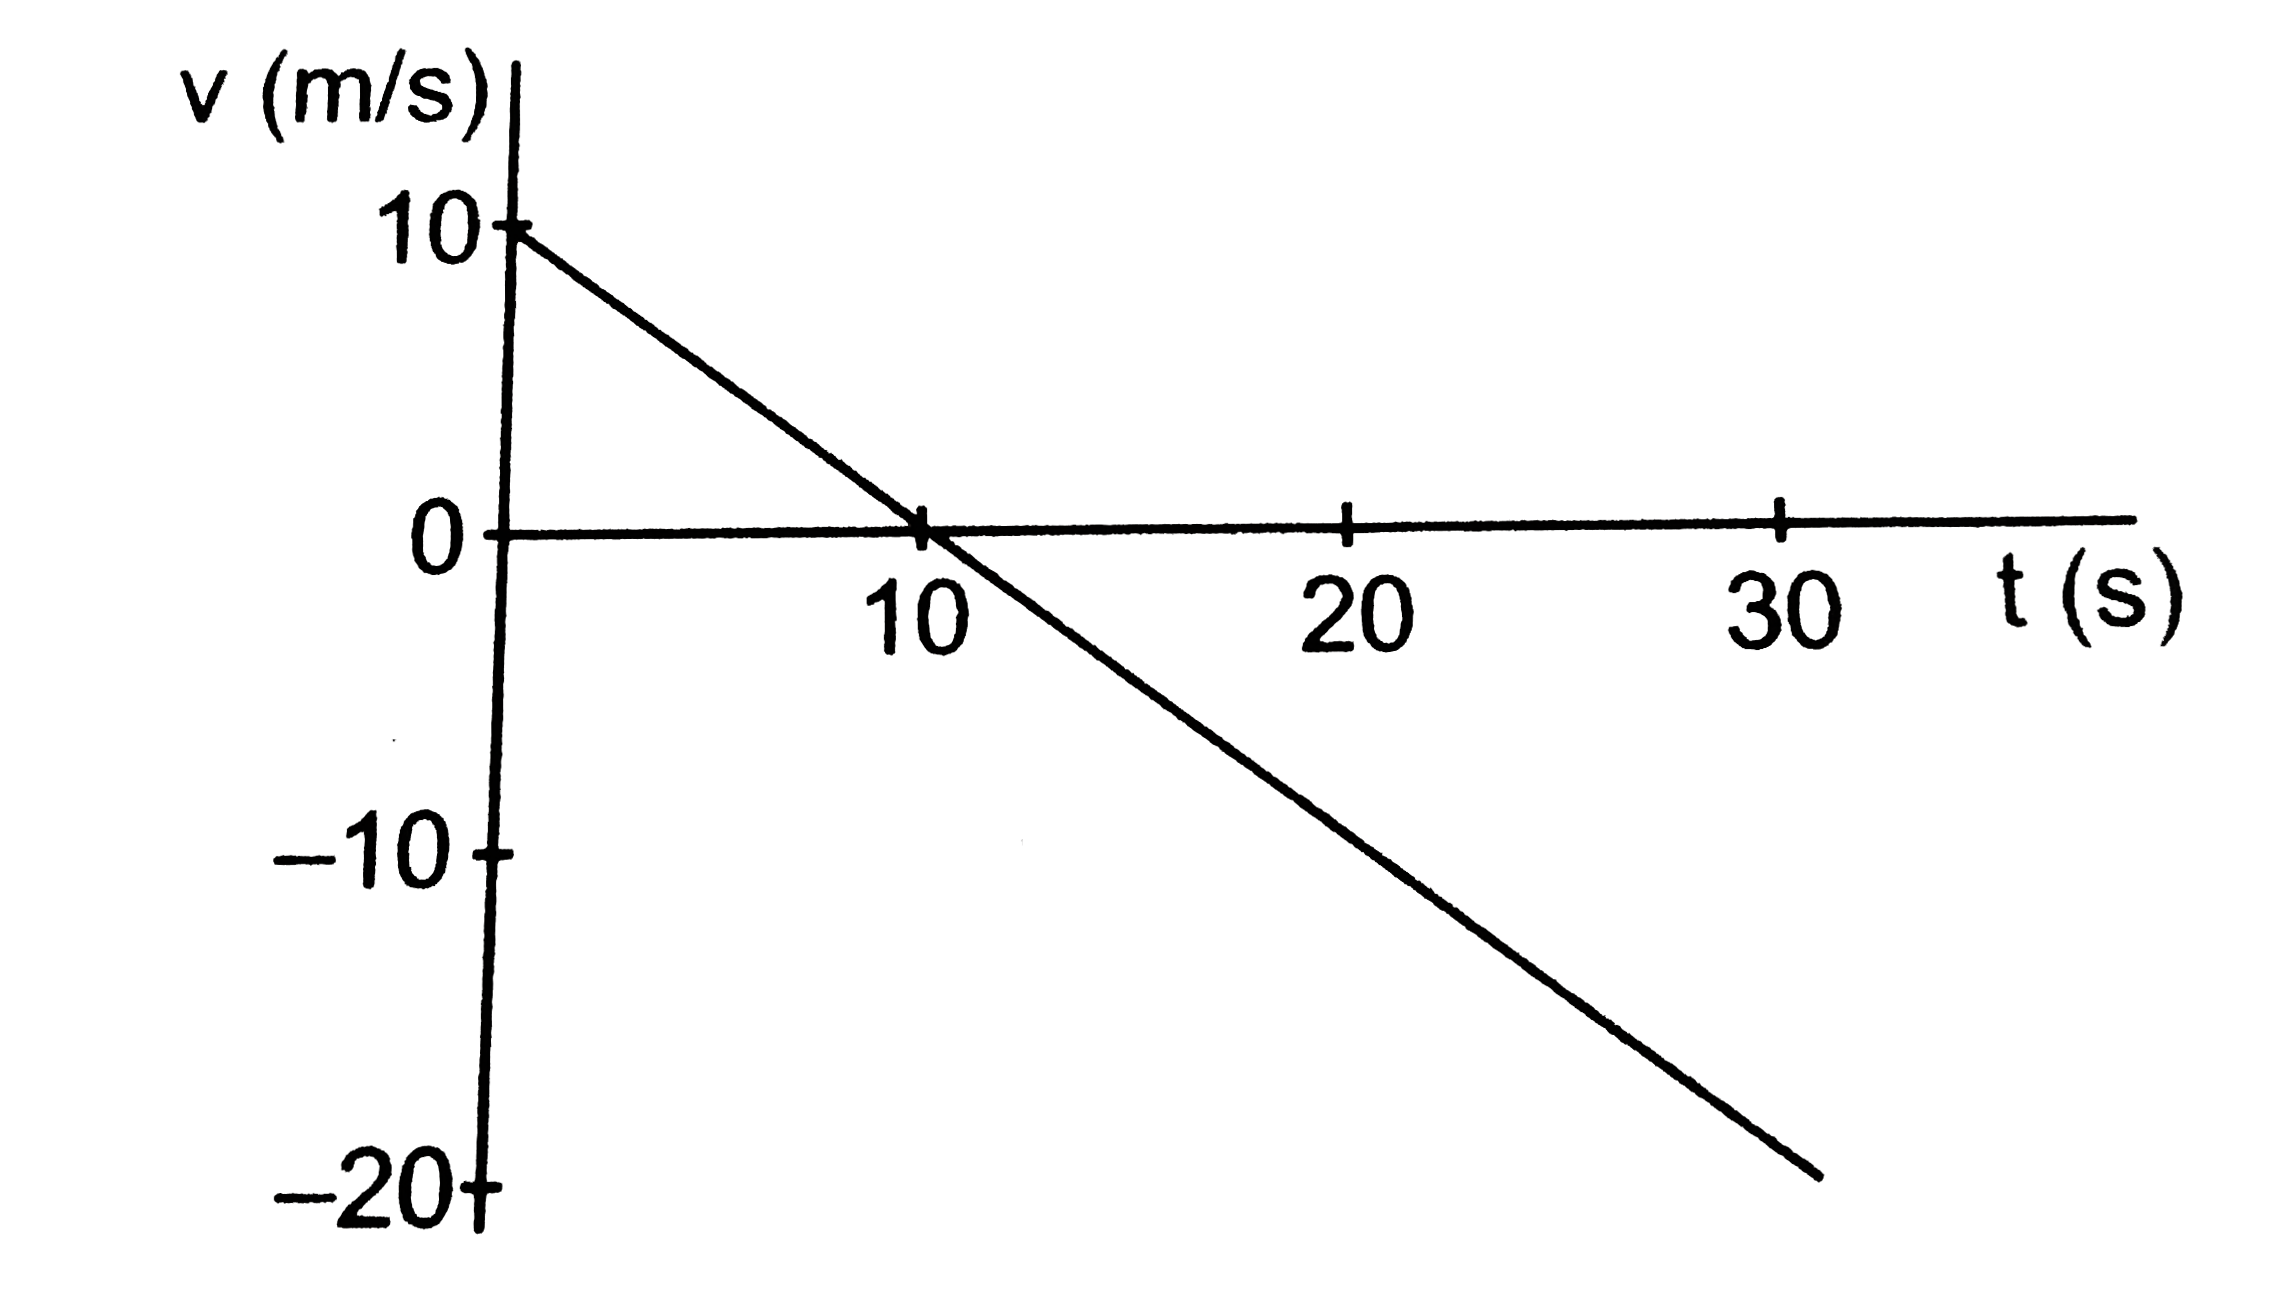
The velocity-time plot for a particle moving on a straight line is shown in figure.
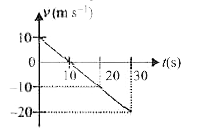 AThe particle has a constant acceleration.BThe particle has never tumed around.CThe particle has zero displacement.DThe average speed in the interval 0 to 10 s is the same as the average speed in the interval 10s to 20 s.
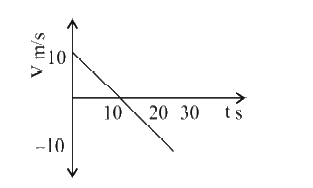
The velocity time plot for a particle moving on straight line is shown in the figure.
 AThe particle has a constant accelerationBThe particle has nevedr turned aroundCThe paeticle has zero displacement.DThe average speed in the interval 0 to 10 s is the same as the average speed in the interval 10 s to 20s.
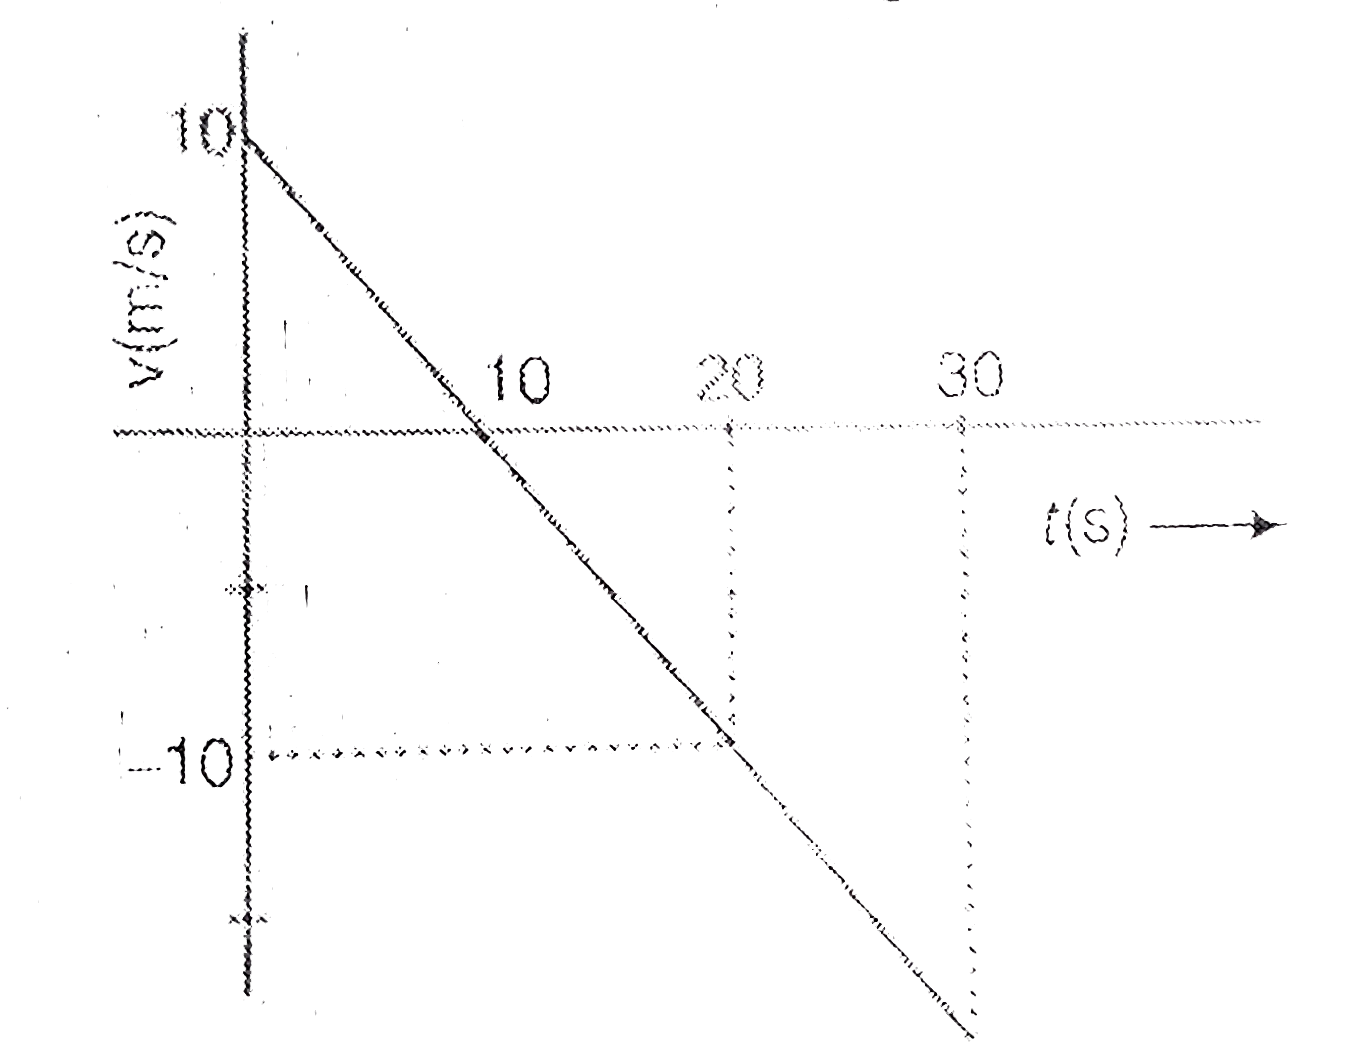
The velocity- time plot for a particle moving on a straight line is shown in the figure
 Athe particle has a non uniform accelerationBthe particle has never turned aroundCthe particle has zero displacementDthe average speed in the interval 0 to 10 s is the same as the average speed in the interval 10 s to 20 s
The velocity-time plot for a particle moving on a straight line is shown in the figure, then
View SolutionForce acting on a particle varies with x as shown in figure. Calculate the work done by the force as the particle moves from x = 0 to x = 6.0 m.
View SolutionDisplacement time graph of a particle moving in a straight line is a shown in figure.

View SolutionVelocity displacement graph of a particle moving in a straight line is as shown in figure.

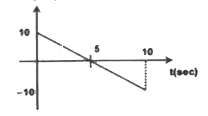
View SolutionVelocity-time graph of a particle moving in a straight line is shown in the figure. Mass of the particle is 2 kg. Work done by all the forces acting on the particle in time interval t = 0 to t = 10 sec is
View Solution

