The graph shows the variation in magnetic flux ϕ(t) with time through a coil. Which of the statements given below in not correct?
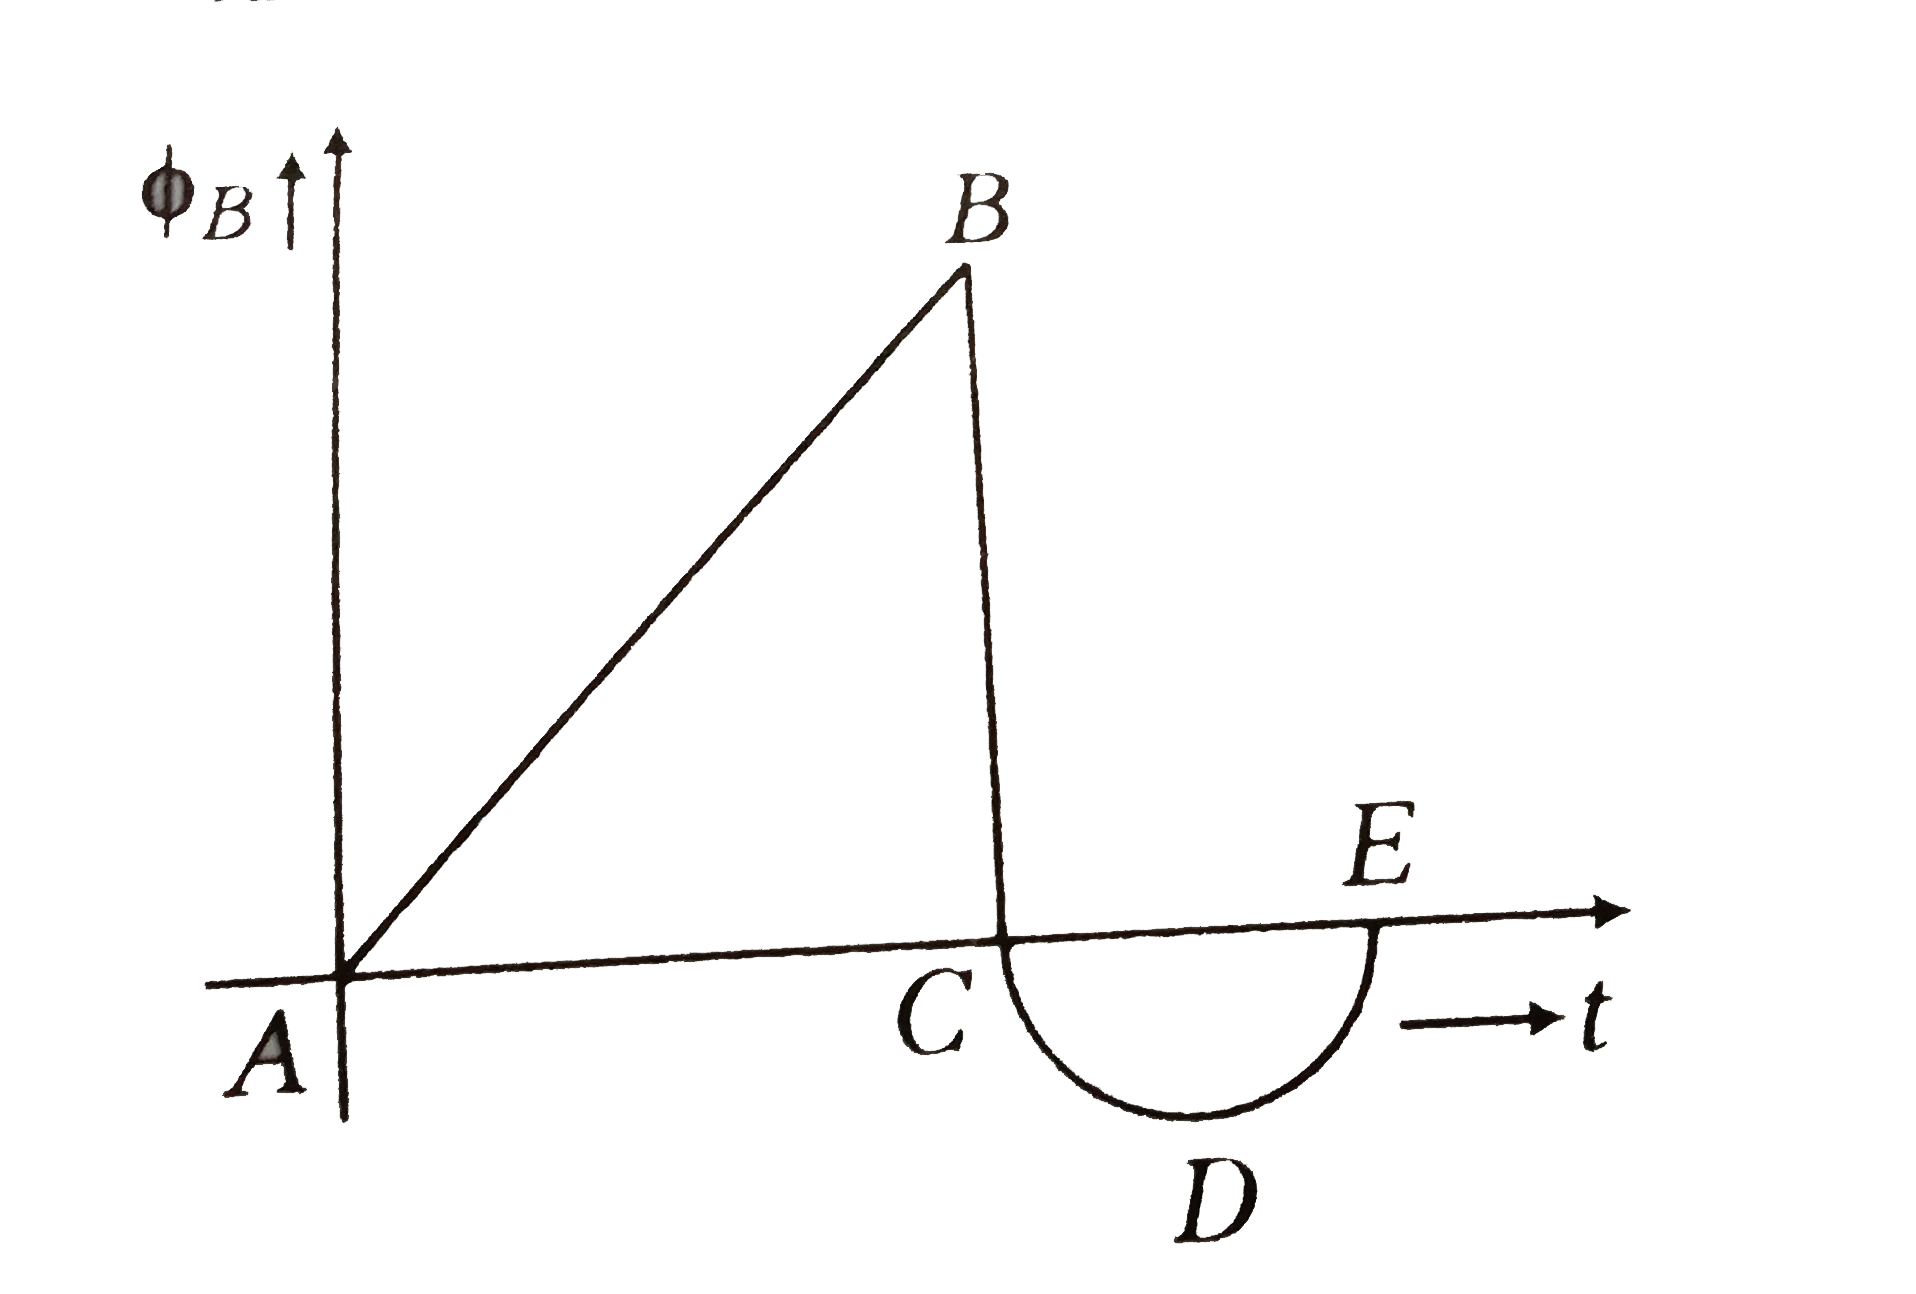
There is a change in the direction as well as magnitude of the induced emf between B and D
The magnitude of the induced emf is maximum between B and C
There is a change in the direction as well as magnitude of induced emf between A and C
The induced emf is zero at B
The correct Answer is:D
Step by step video & image solution for The graph shows the variation in magnetic flux phi(t) with time through a coil. Which of the statements given below in not correct? by Physics experts to help you in doubts & scoring excellent marks in Class 12 exams.
Topper's Solved these Questions
- BOOK - CENGAGE PHYSICS ENGLISHCHAPTER - ELECTROMAGNETIC INDUCTIONEXERCISE - Multiple correct Answer Type3videos
ELECTROMAGNETIC INDUCTION
- BOOK - CENGAGE PHYSICS ENGLISHCHAPTER - ELECTROMAGNETIC INDUCTIONEXERCISE - single correct10videos
ELECTROMAGNETIC INDUCTION
- BOOK - CENGAGE PHYSICS ENGLISHCHAPTER - ELECTROMAGNETIC INDUCTIONEXERCISE - Archives Asserton - Reasoning1videos
ELECTROMAGNETIC INDUCTION
- BOOK - CENGAGE PHYSICS ENGLISHCHAPTER - ELECTRICAL MEASURING INSTRUMENTSEXERCISE - M.C.Q2videos
ELECTRICAL MEASURING INSTRUMENTS
- BOOK - CENGAGE PHYSICS ENGLISHCHAPTER - ELECTRON,PHONTS,PHOTOELECTRIC EFFECT & X-RAYSEXERCISE - dpp 3.315videos
ELECTRON,PHONTS,PHOTOELECTRIC EFFECT & X-RAYS
Similar Questions
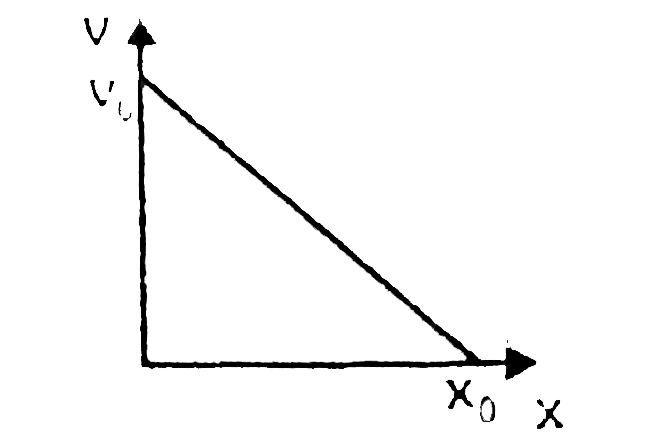
The given graph shows the variation of velocity with displacement. Which one of the graph given below correctly represents the variation of acceleration with displacement :-
 View Solution
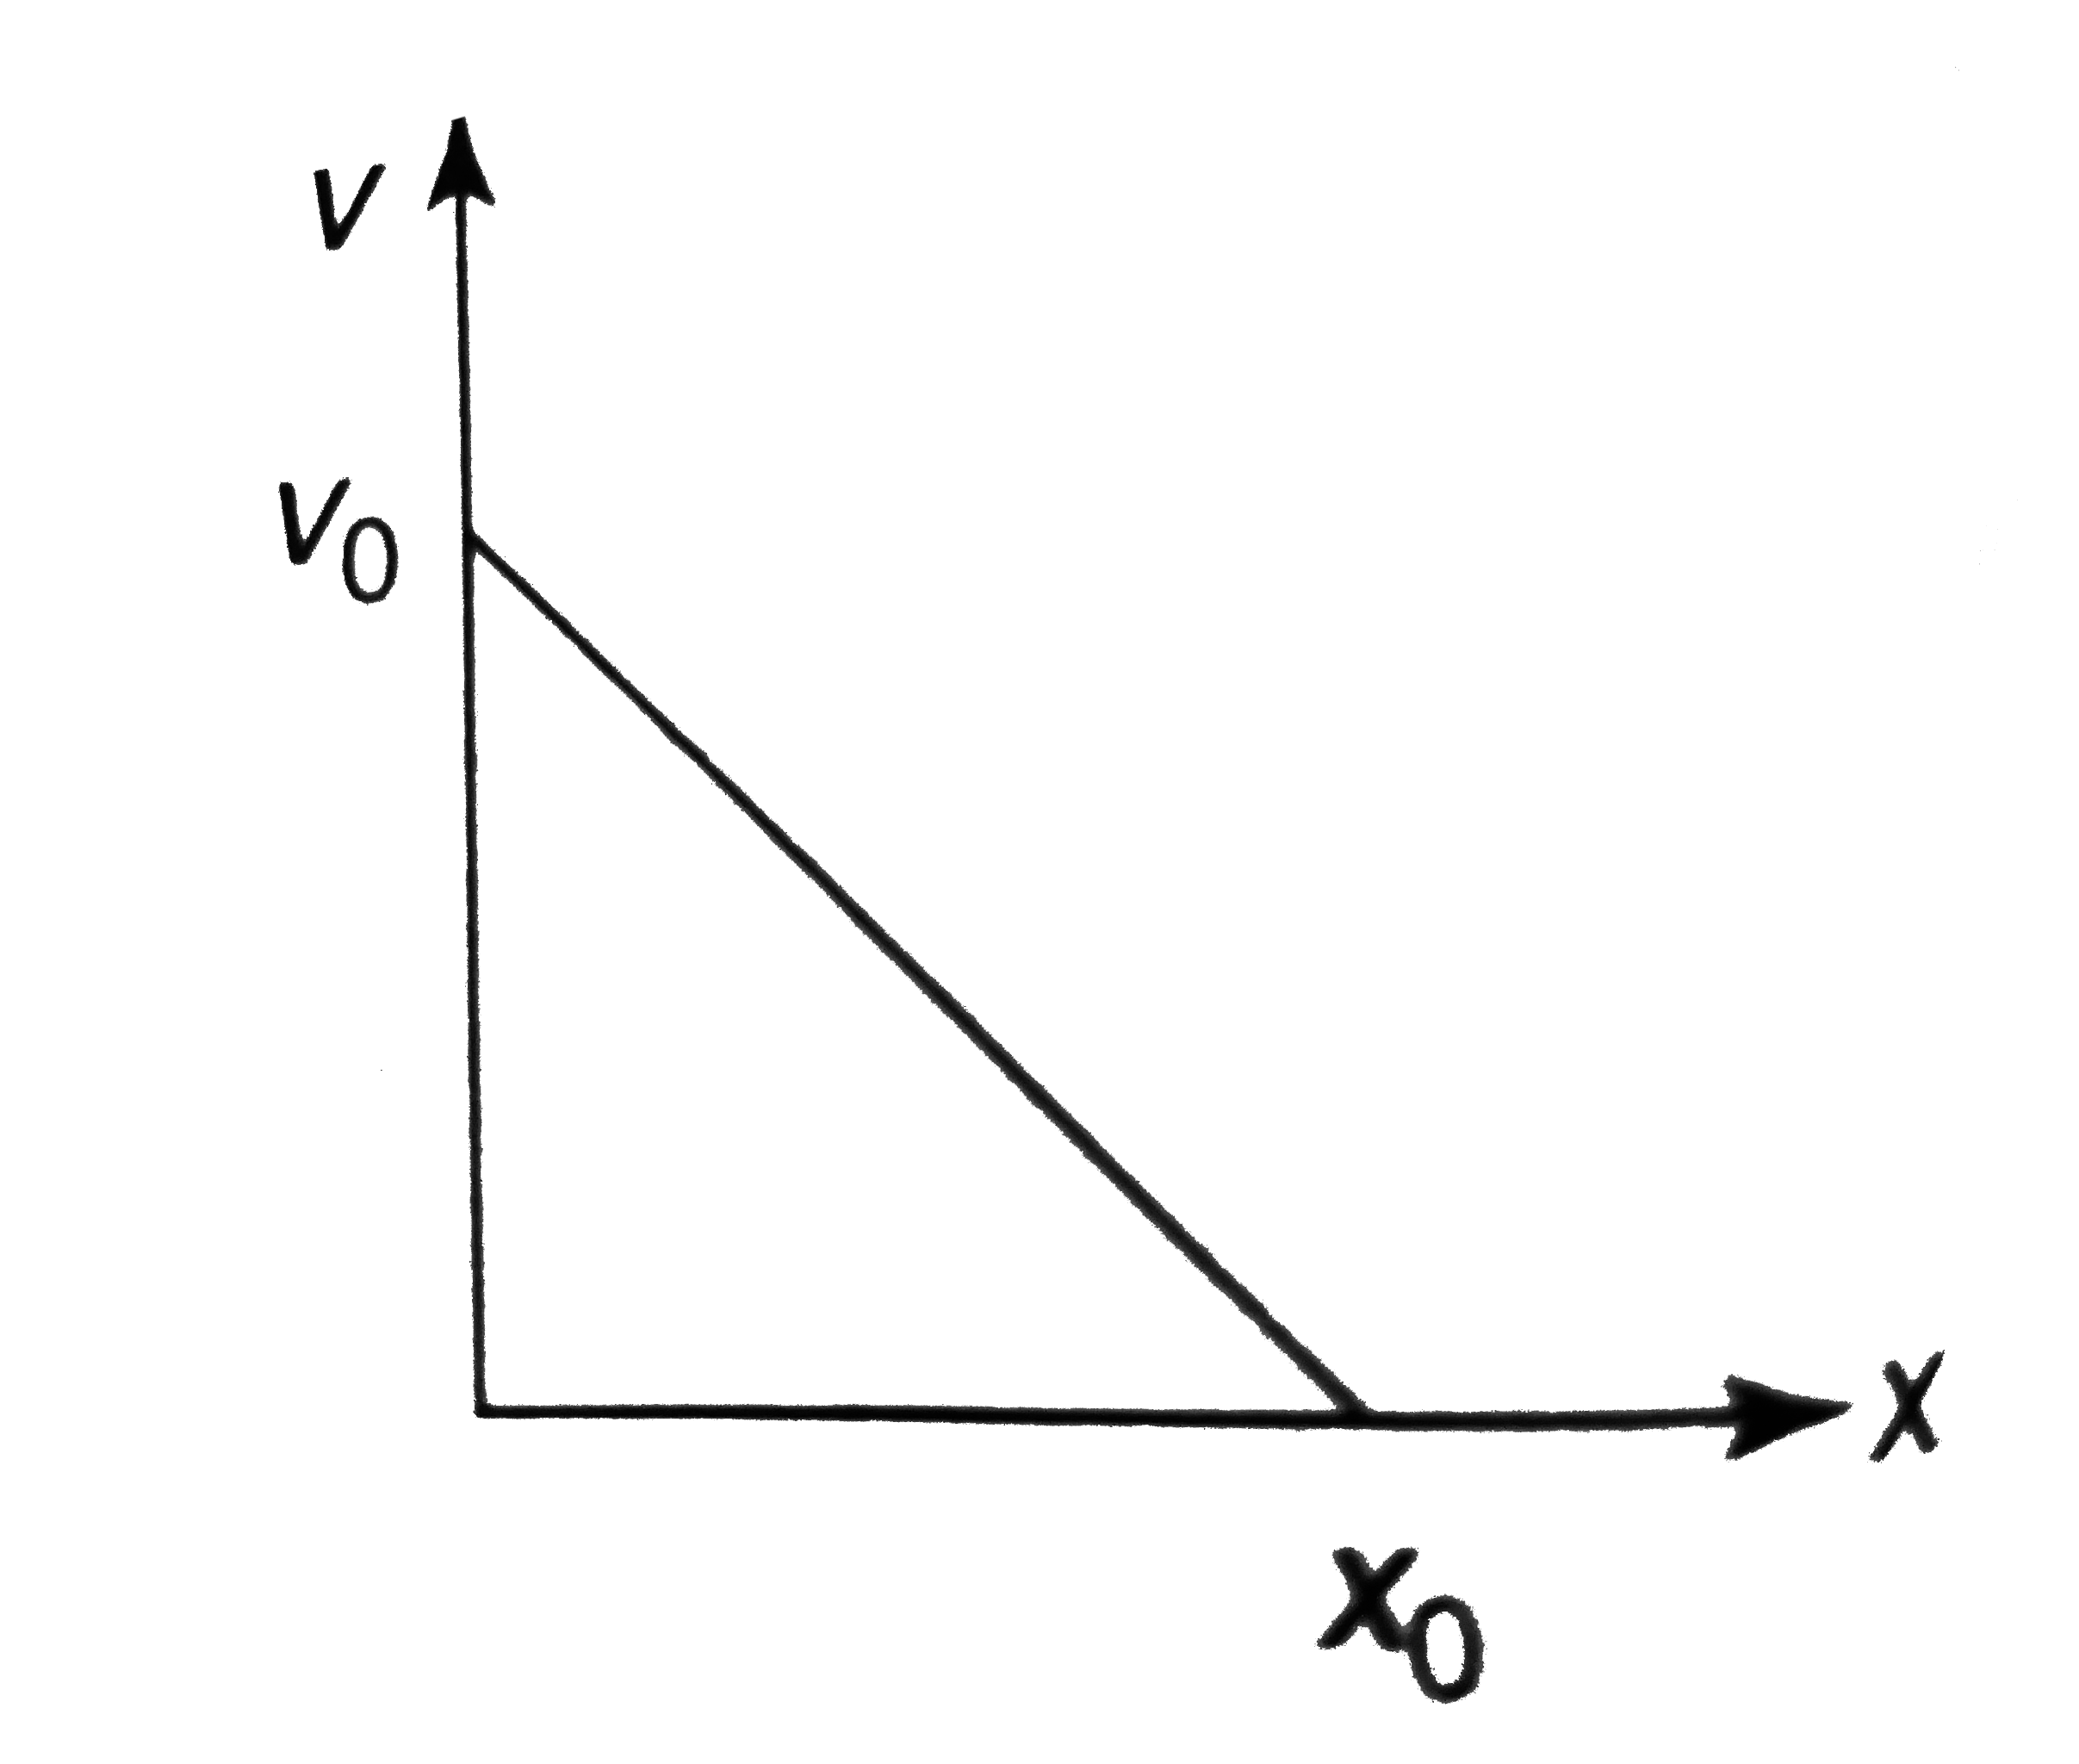
The given graph shows the variation of velocity with displacement. Which one of the graphs given below correctly represents the variation of acceleration with displacement ?
 View Solution
The correct graph which shows the variation of paramagnetic susceptibility S with temperature T is
View SolutionFrom the given graph
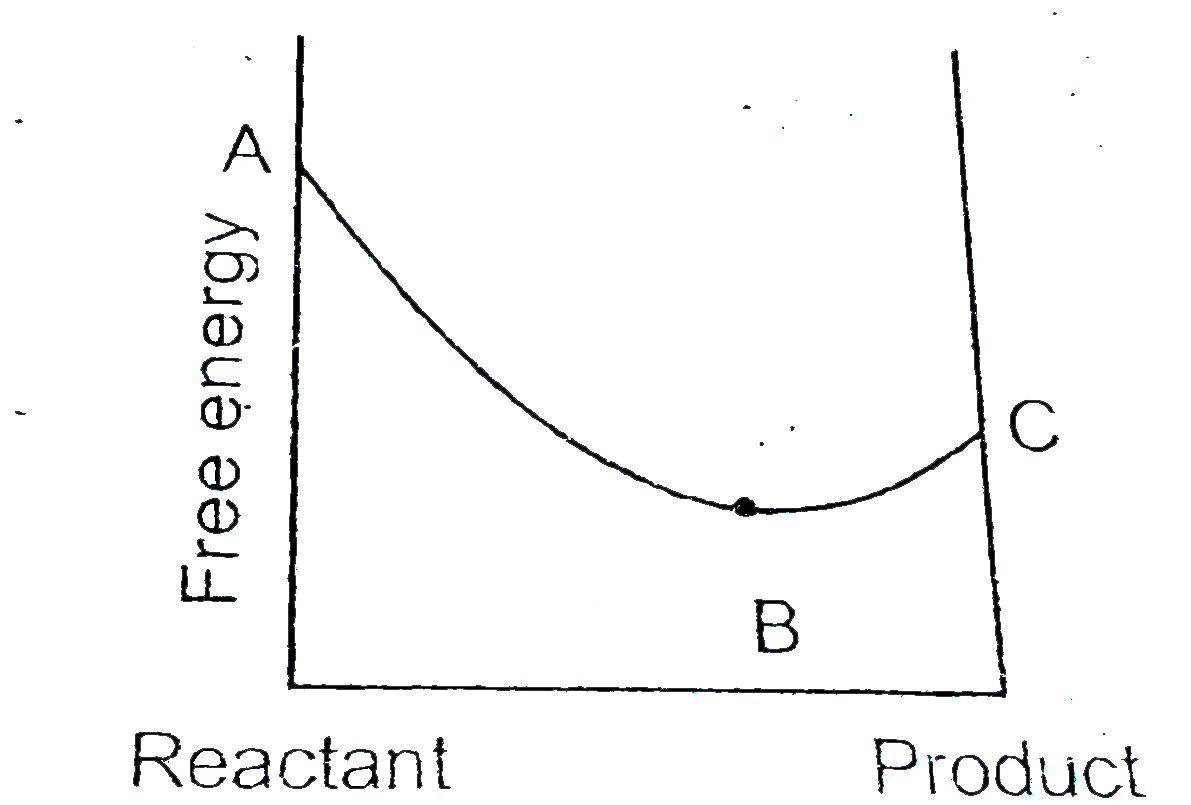
Which of the following statement is correct ?View SolutionThe magnetic flux linked with a coil is ϕ and the emf induced in it is e.
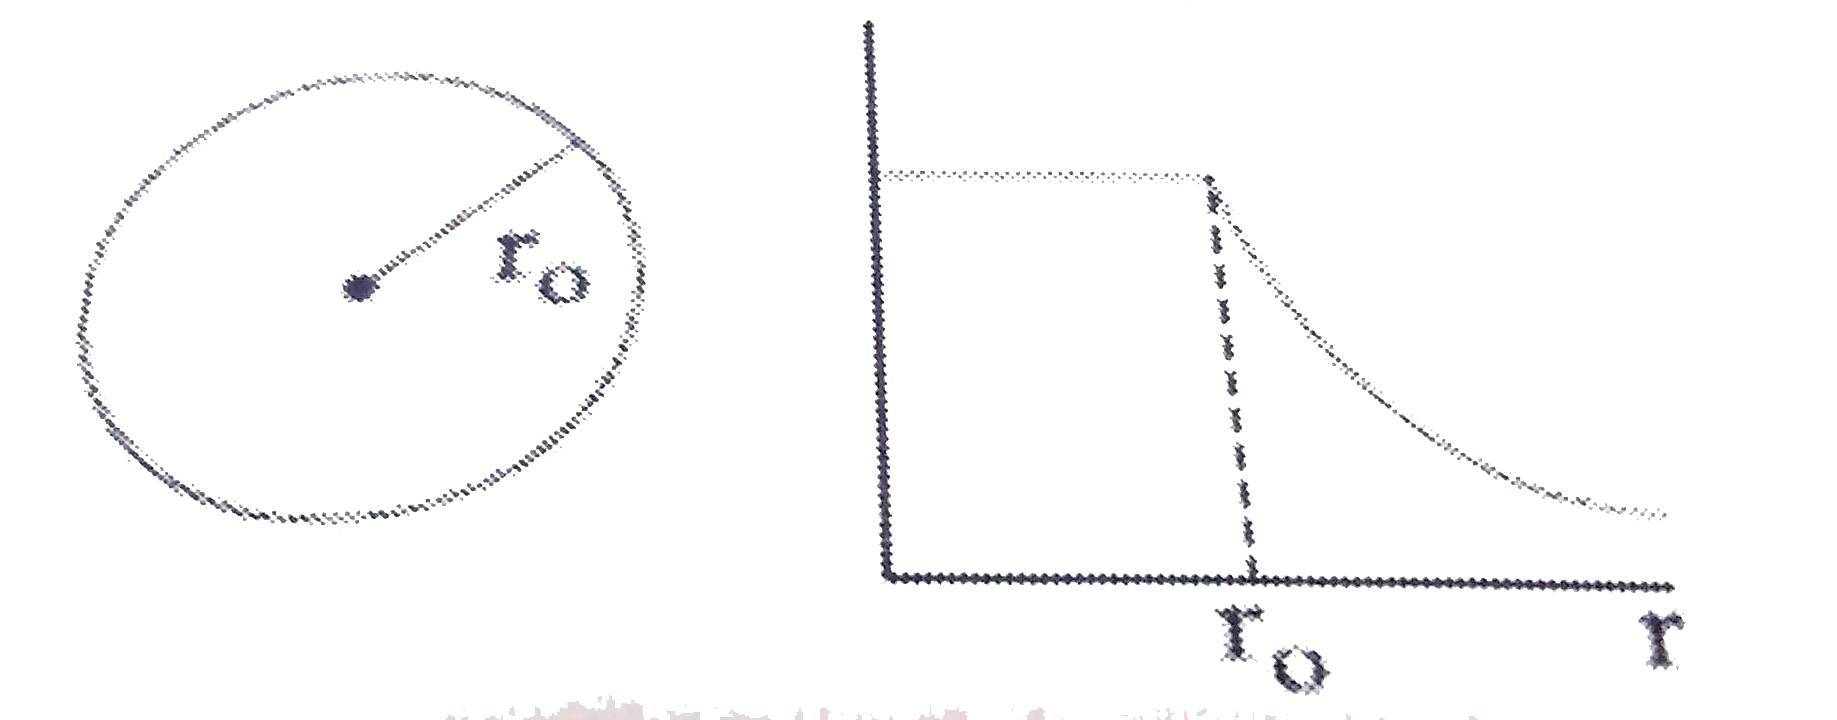
View SolutionThe given graph shows variation (with distance r form center) of :
 View Solution
The graph shown the variation with times t of the velocity v of an object . Which one of the following graphs best represents the variation of acceleration a of the object with time t?
 View Solution
Consider a rectangular coil of wire carrying constant current I, forming a magnetic dipole. The magnetic flux through an infinite plane that contains the circular coil and excluding the rectangular area is given by ϕi. The magnetic flux through the area of the rectangular area is given by ϕ0. Which of the following option is correct?
View SolutionConsider a rectangular coil of wire carrying constant current I, forming a magnetic dipole. The magnetic flux through an infinite plane that contains the rectangular coil and excluding the rectangular area is given byϕ. magnetic flux through the area of the rectangular area is given by ϕ. Which of the following option is correct?
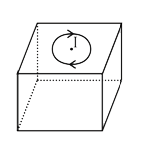
View SolutionA closed current carrying circular loop is placed on one face of a cubical box as shown in fig. The magnetic flux through area of the box contained by the loop is ϕ1 and the magnetic flux through remaining surface area of the box is ϕ2 . Which of the following option is correct
 View Solution
