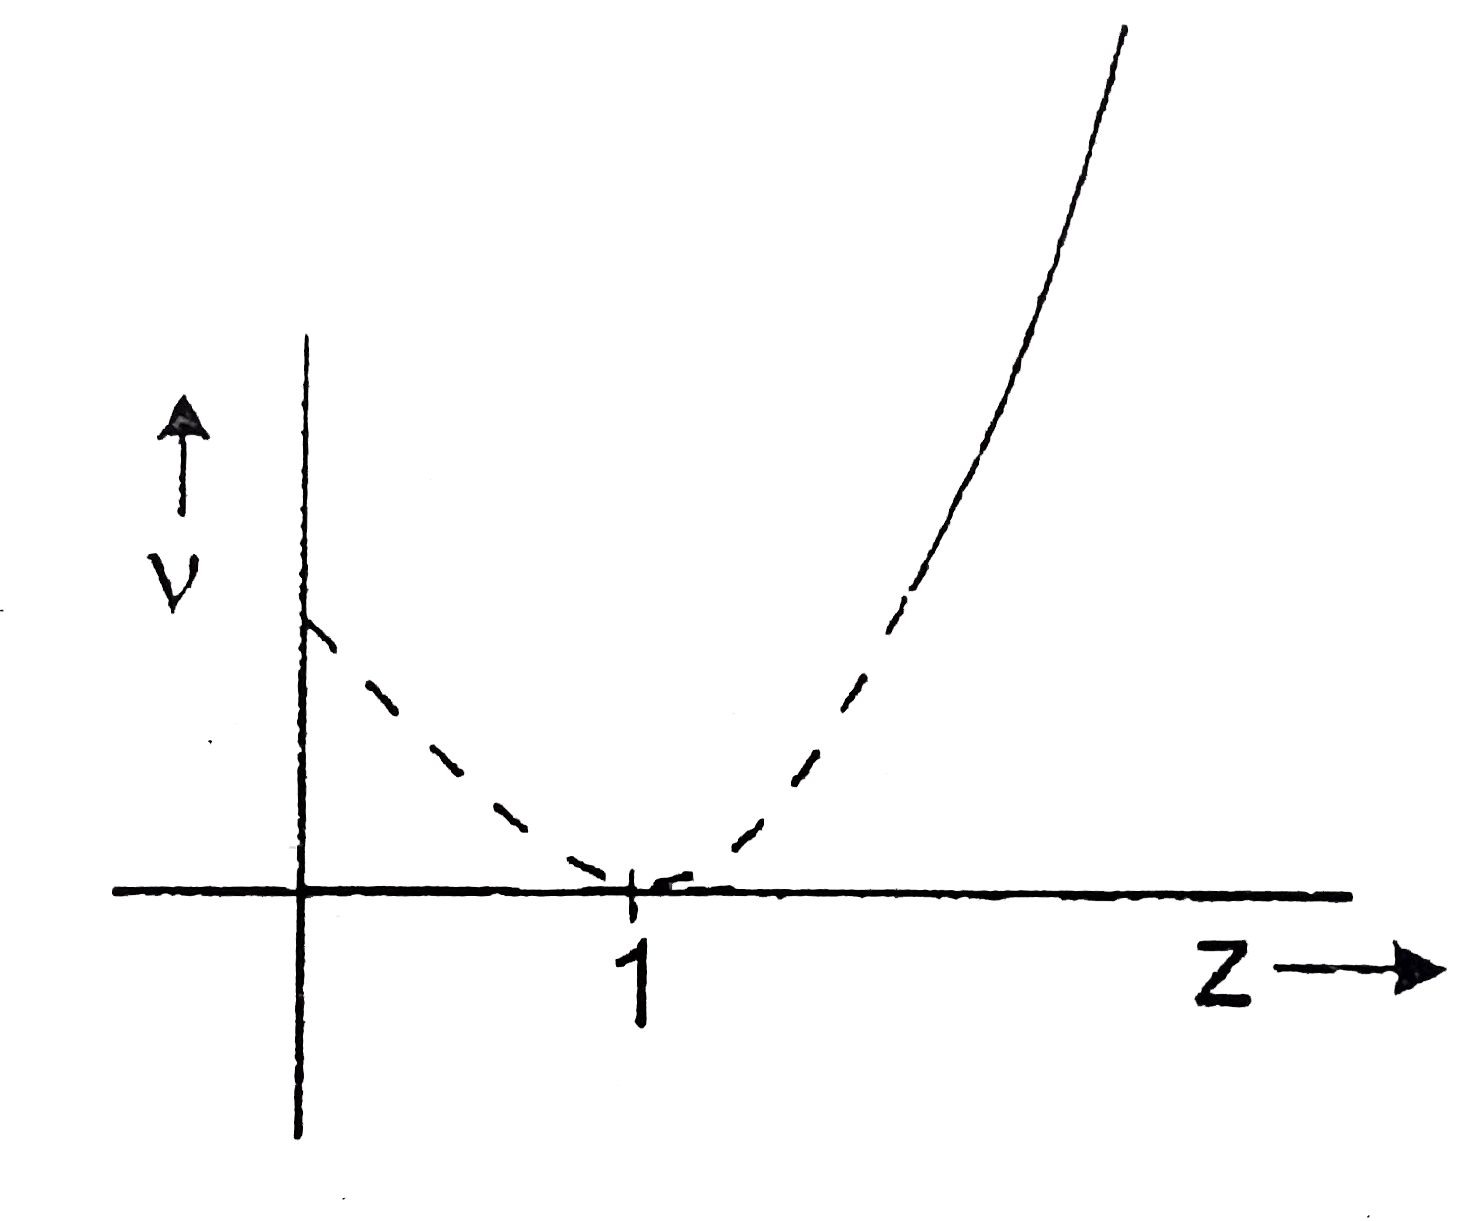
The graph that correctly represents the relation of frequency v of a particular characteristic X - ray with the atomic number Z of the material is


The correct Answer is:C
To solve the question regarding the relationship between the frequency ν of a particular characteristic X-ray and the atomic number Z of the material, we can follow these steps:
Step 1: Understand Moseley's Law
Moseley's law states that the frequency ν of the characteristic X-rays emitted by an element is related to its atomic number Z by the equation:
√ν=a(Z−b)
where a and b are constants specific to the material.
Step 2: Rearranging the Equation
From the above equation, we can square both sides to eliminate the square root:
ν=a2(Z−b)2
This shows that the frequency ν is proportional to the square of the difference between the atomic number Z and the constant b.
Step 3: Identify the Graph Shape
The equation ν=a2(Z−b)2 is a quadratic equation in terms of Z. This means that when we plot ν (on the y-axis) against Z (on the x-axis), we will get a parabola that opens upwards.
Step 4: Determine Key Points
1. When Z=b, ν=0. This is the vertex of the parabola.
2. As Z increases beyond b, ν increases because the square of a positive number is positive.
3. When Z=0, substituting into the equation gives:
ν=a2(0−b)2=a2b2
This indicates that the frequency is positive at Z=0.
Step 5: Sketch the Graph
- The vertex of the parabola is at (b,0).
- The parabola opens upwards, indicating that as Z increases from b, ν increases.
- The graph will intersect the y-axis at (0,a2b2).
Conclusion
The graph that correctly represents the relationship between the frequency ν of a particular characteristic X-ray and the atomic number Z is a parabola that opens upwards, with its vertex at (b,0) and intersecting the y-axis at (0,a2b2).
Moseley's law states that the frequency ν of the characteristic X-rays emitted by an element is related to its atomic number Z by the equation:
√ν=a(Z−b)
where a and b are constants specific to the material.
From the above equation, we can square both sides to eliminate the square root:
ν=a2(Z−b)2
This shows that the frequency ν is proportional to the square of the difference between the atomic number Z and the constant b.
The equation ν=a2(Z−b)2 is a quadratic equation in terms of Z. This means that when we plot ν (on the y-axis) against Z (on the x-axis), we will get a parabola that opens upwards.
1. When Z=b, ν=0. This is the vertex of the parabola.
2. As Z increases beyond b, ν increases because the square of a positive number is positive.
3. When Z=0, substituting into the equation gives:
ν=a2(0−b)2=a2b2
This indicates that the frequency is positive at Z=0.
- The vertex of the parabola is at (b,0).
- The parabola opens upwards, indicating that as Z increases from b, ν increases.
- The graph will intersect the y-axis at (0,a2b2).
The graph that correctly represents the relationship between the frequency ν of a particular characteristic X-ray and the atomic number Z is a parabola that opens upwards, with its vertex at (b,0) and intersecting the y-axis at (0,a2b2).
Topper's Solved these Questions
- ATOMIC PHYSICSBOOK - CENGAGE PHYSICS ENGLISHCHAPTER - ATOMIC PHYSICSEXERCISE - dpp 4.2
15 Videos
- ALTERNATING CURRENTBOOK - CENGAGE PHYSICS ENGLISHCHAPTER - ALTERNATING CURRENTEXERCISE - Single Correct
10 Videos
- CAPACITOR AND CAPACITANCEBOOK - CENGAGE PHYSICS ENGLISHCHAPTER - CAPACITOR AND CAPACITANCEEXERCISE - Integer
5 Videos
Similar Questions
Knowledge Check
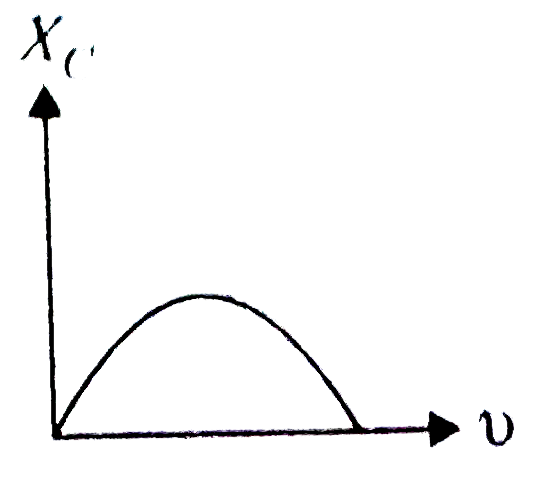
Identify the graph which correctly reperesents the variation of capacitive reactance XC with frequency
A B
B C
C D
D
Can a hydrogen atom emit characteristic X-ray?
View SolutionIdentify the graph which correctly reperesents the variation of capacitive reactance XC with frequency
View SolutionThe wavelength λ of the Ka line of characteristic X - ray spectra varies with atomic number approximately
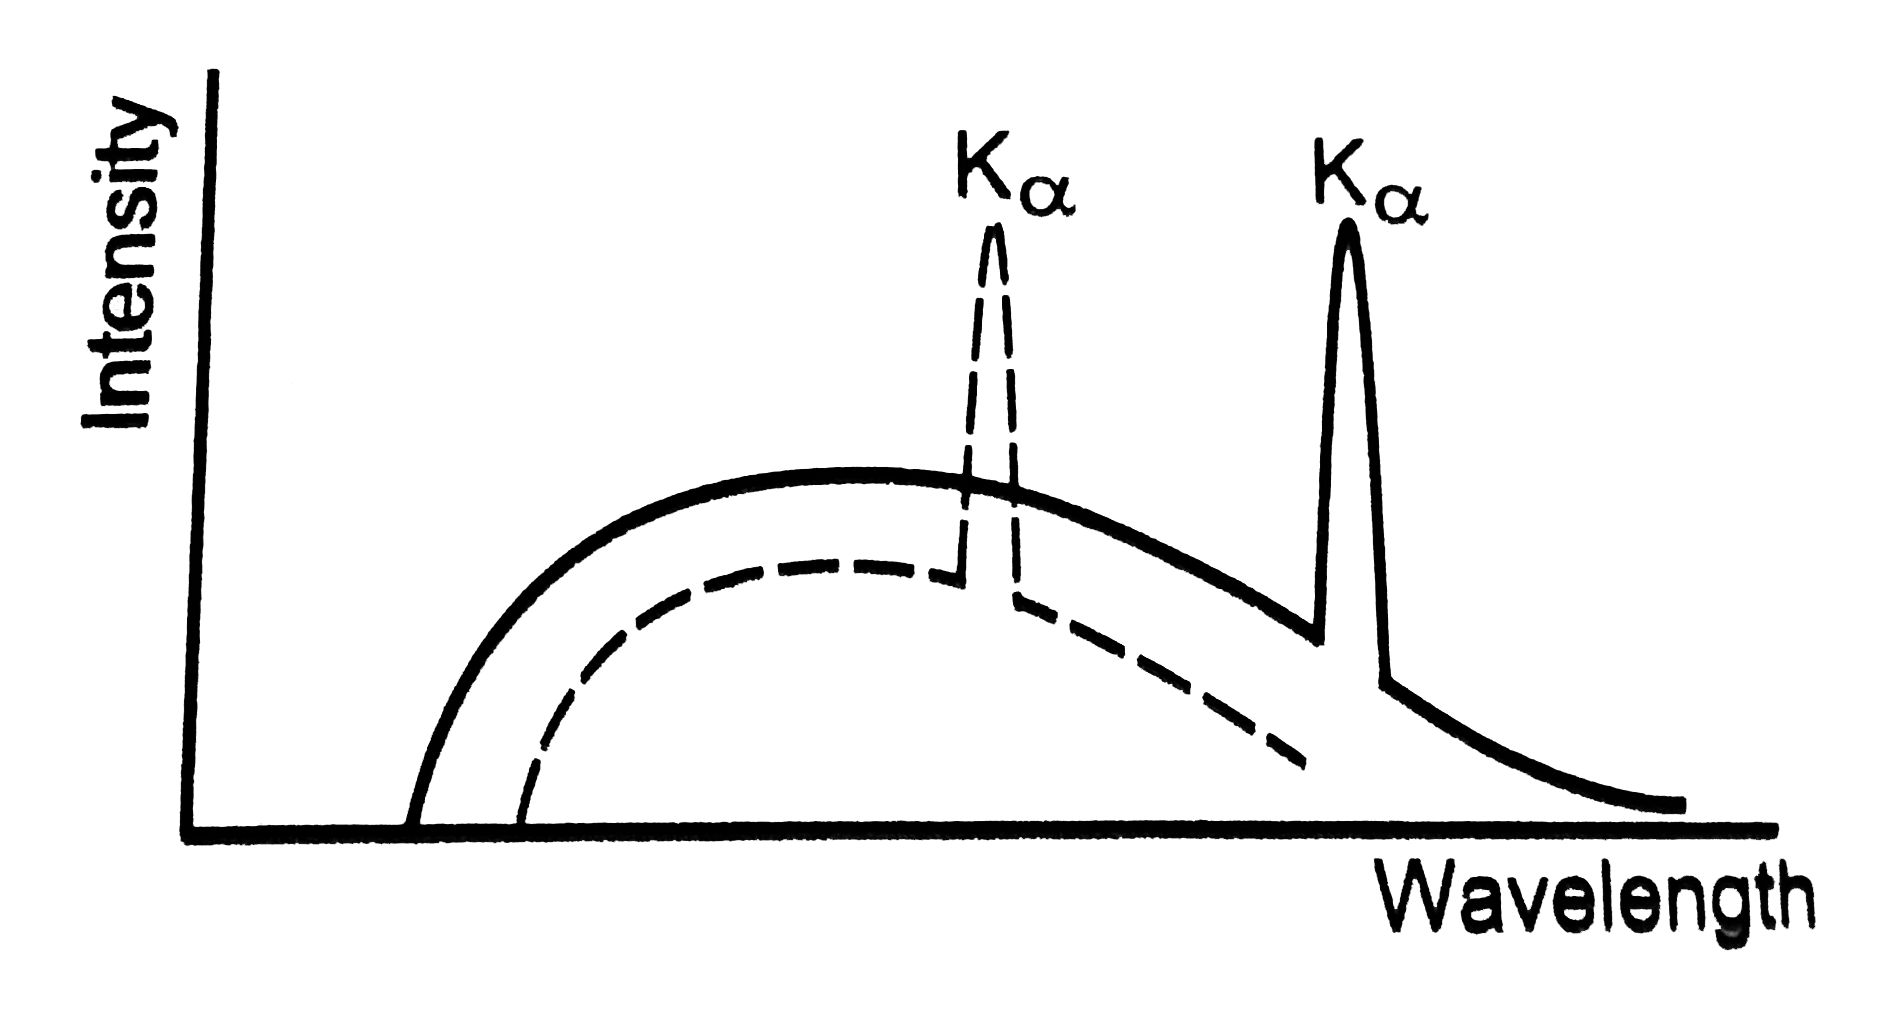
View SolutionFigure shows the intensity-wavelength relations of X-rays coming from two different Coolidge tube. The solid curve represents the relation for the tube A in which the potential difference between the target and the filament is Va and the atomic number of the target material is ZA. These quantities are Vβ and Zβ for the other tube. Then,

View SolutionFigure shows the variation of frequency of a characterstic x-ray and atomic number.

(i) Name the characterstics x-ray
(ii) Find the energy of photon emitted when this x-ray is emitted by a metal having z=101
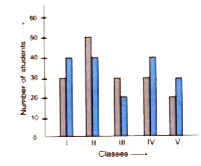
View SolutionExmine the given graph carefully.

In the graph show above represents the number of girls in a particular class and represents the number of boys in the same class.
Read and answer the following questions.
(i) Which class has the least number of students ?
(ii) Which class has maximum number of students ?
(iii) What is the ratio between the number of girls and the number of boys of class V.
View SolutionMoseley's law for characteristic X-rays is √v=a(Z−b). In this,
View Solution
