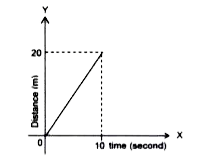
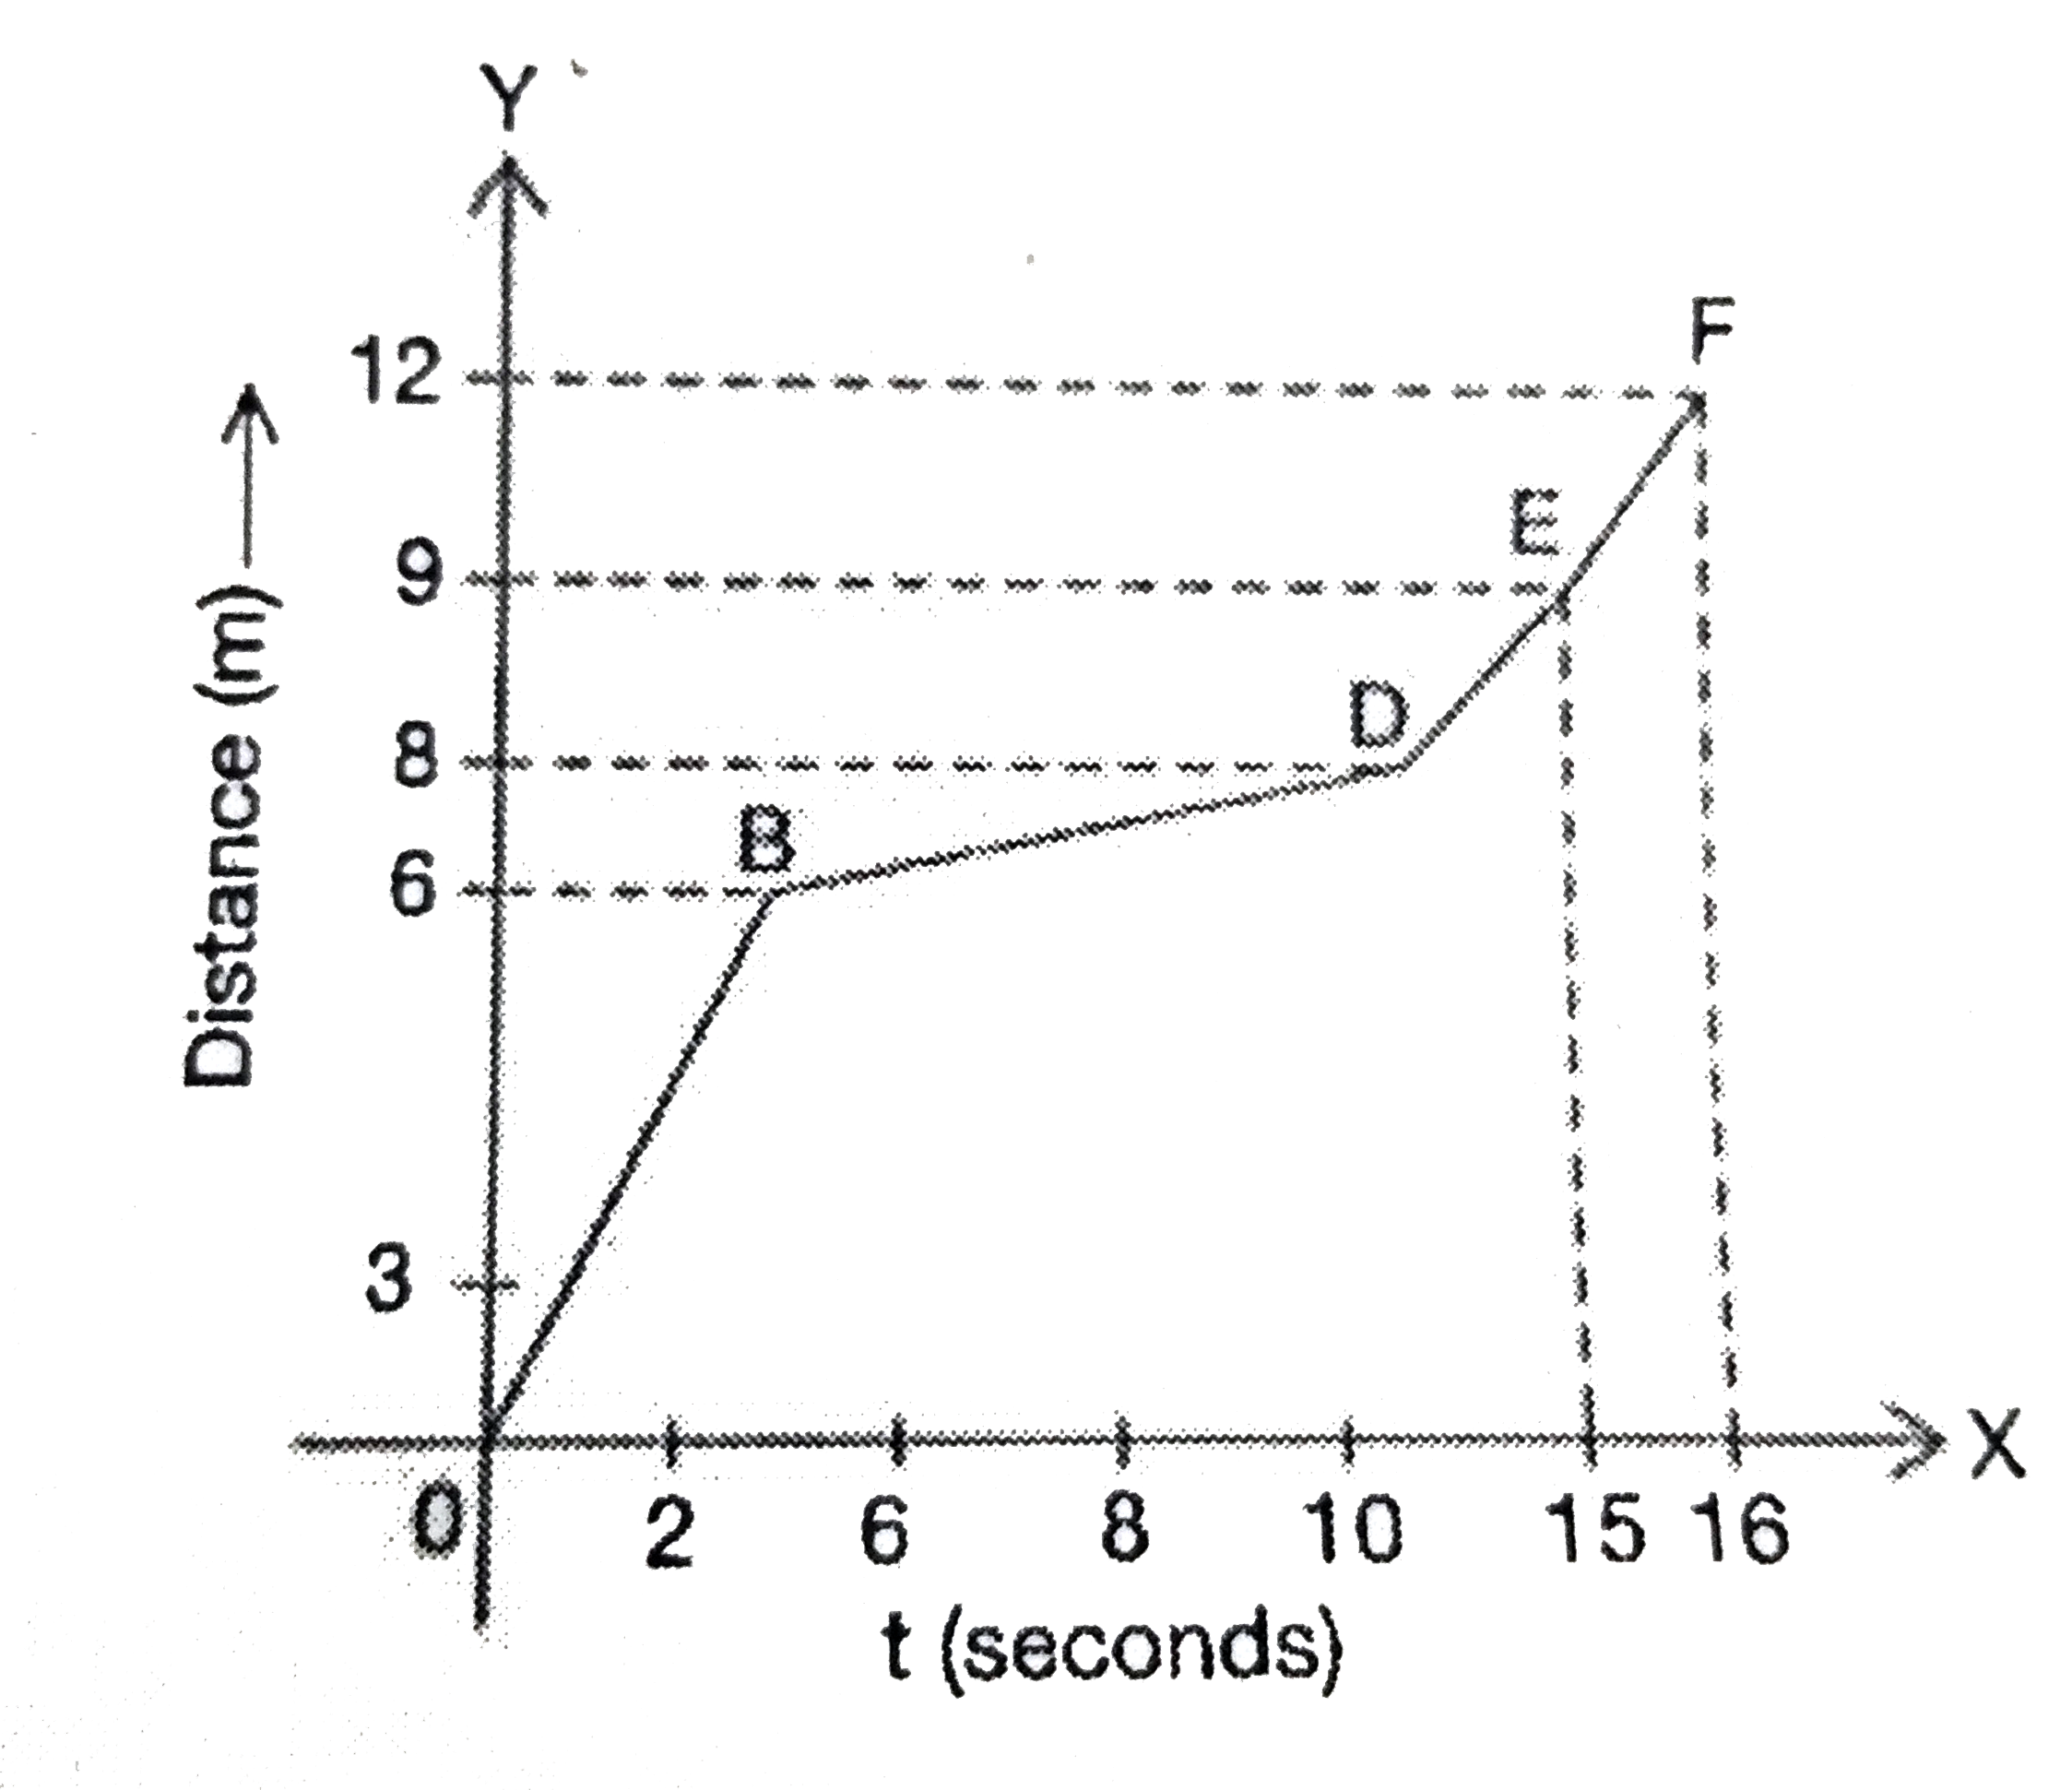
The motion of a body is depicted graphically as shown in the given figure. Then
2
zero
200
20
The correct Answer is:A
From the figure:
The distance moved by the body = 20 m
Time taken to trace the path, (t) = 10 s
(1) average speed = total distancetotal time
= 2010=2ms−2.
Topper's Solved these Questions
- KINEMATICSBOOK - PEARSON IIT JEE FOUNDATIONCHAPTER - KINEMATICSEXERCISE - ASSESSMENT TEST (TEST 1 (SELECT THE CORRECT ALTERNATIVE)
14 Videos
- HEAT BOOK - PEARSON IIT JEE FOUNDATIONCHAPTER - HEAT EXERCISE - Test 2
14 Videos
- LIGHTBOOK - PEARSON IIT JEE FOUNDATIONCHAPTER - LIGHTEXERCISE - ASSESSMENT TEST (TEST 2 (SELECT THE CORRECT ALTERNATIVE))
15 Videos
Similar Questions
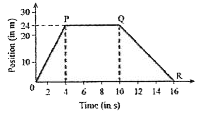
The position versus time graph of the motion of a boy along a straight path is shown in the given figure. The total time for which the boy remains in motion is
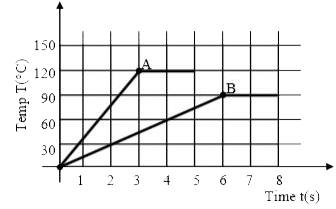
View SolutionTwo different metal bodies A and B of equal mass are heated at a uniform rate under similar conditions. The variation of temperature of the bodies is graphically represented as shown in the figure. The ratio of specific heat capacities is :
View Solution
Knowledge Check
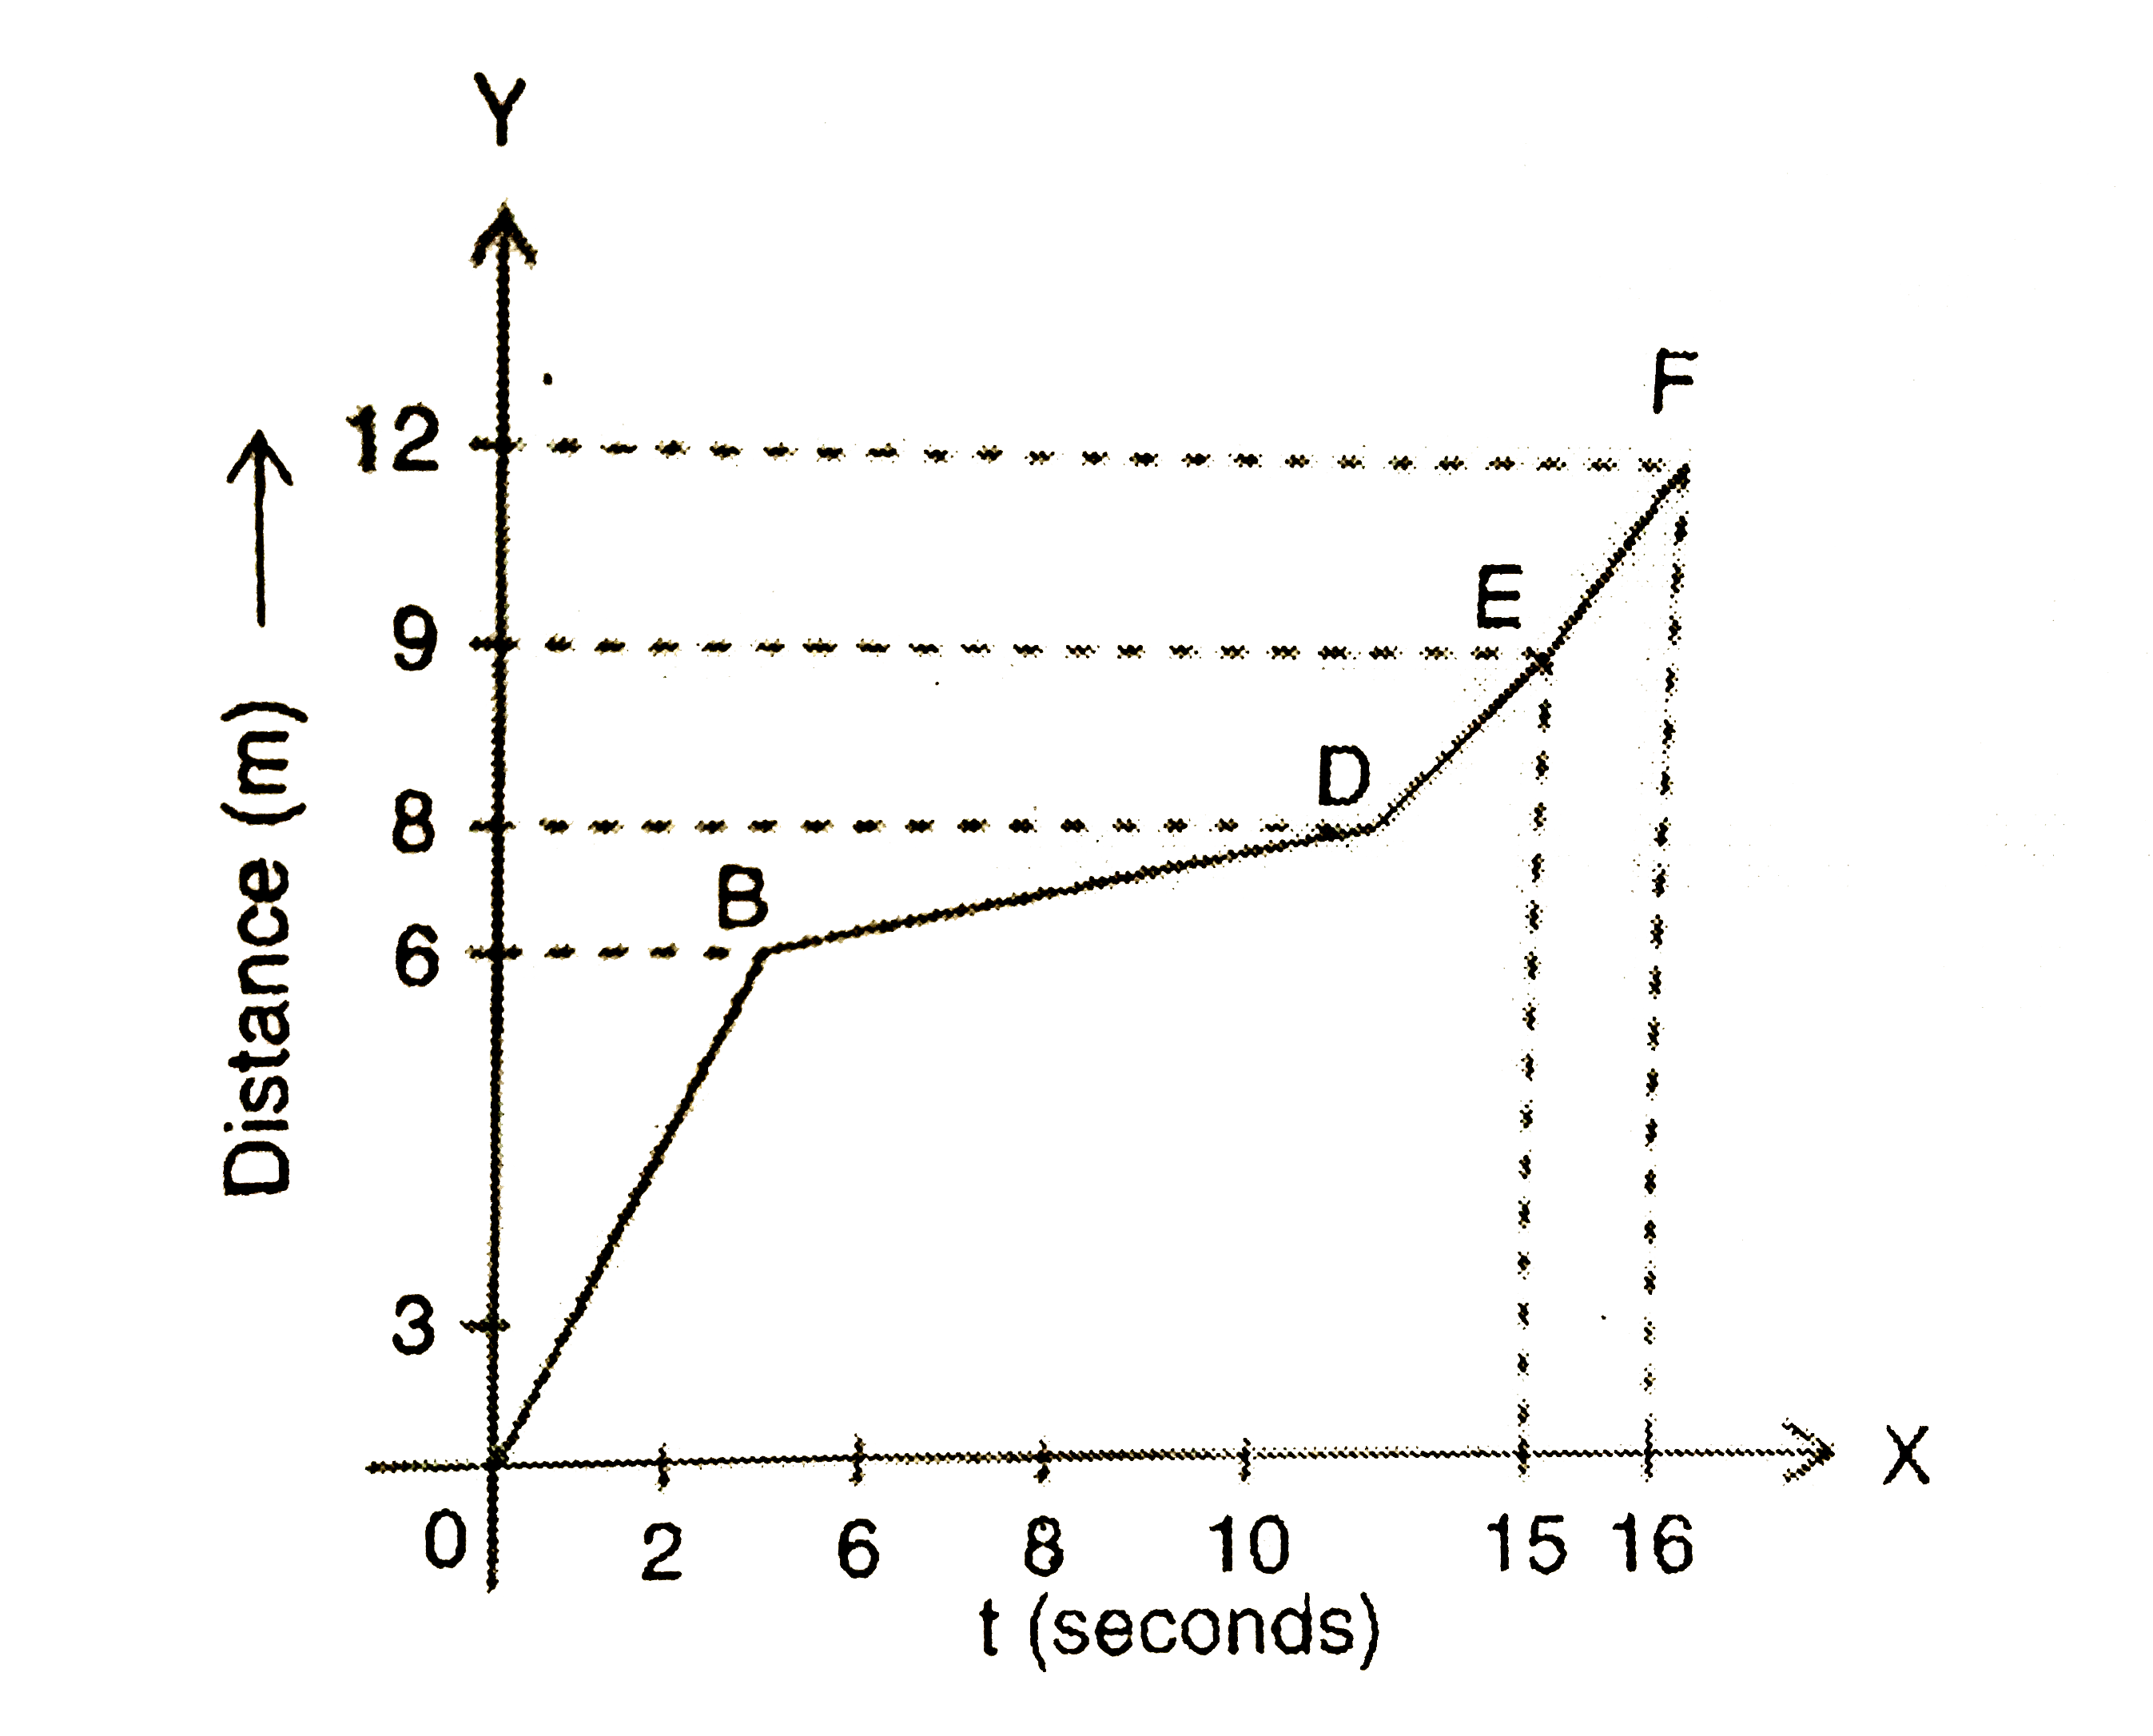
The motion of a body is depicted graphically as shown in the figure. The average speed of the body is ______ ms−1.
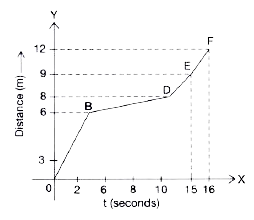 A3/4B9/8C4/3D8/9
Motion of a body is depicted graphically as shown in the figure. The average speed of the body is ________ ms−1
 A3/4B9/8C4/3D8/9
The motion of a body is depicted graphically as shown in the figure, then the average speed of the body is _____ ms−1.
 A34B98C43D89
A current that varies with time according to a law depicted graphically in the figure passes through an induction coil. In which of the moments denoted in the figure will the self-induction emf be maximal (the inductance of the coil rernains unchanged in the process)?
View SolutionThe motion of a body is depicted graphically as shown in the figure, then the average speed of the body is _____ ms−1.

View SolutionMotion of a body is depicted graphically as shown in the figure. The average speed of the body is ________ ms−1

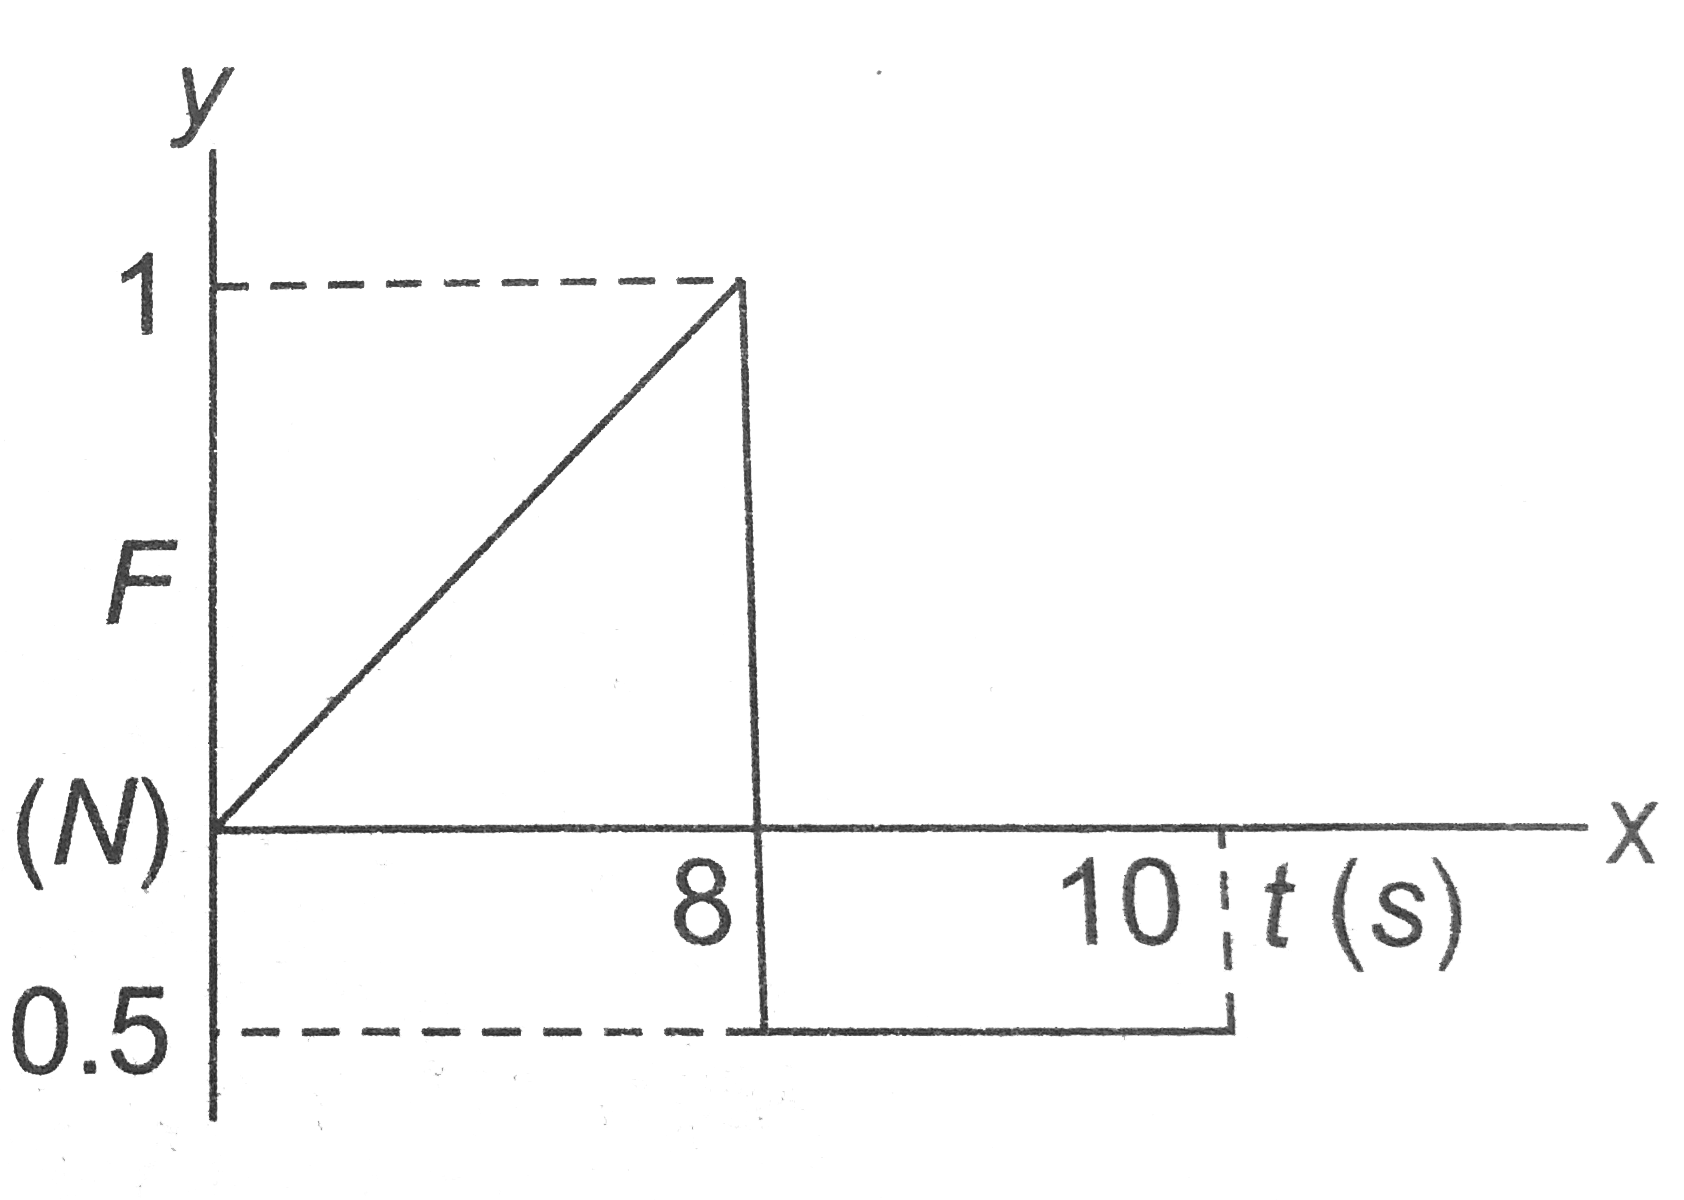
View SolutionA force-time graph for the motion of a body is shown in the figure. The change in the momentum of the body between zero and 10sec is
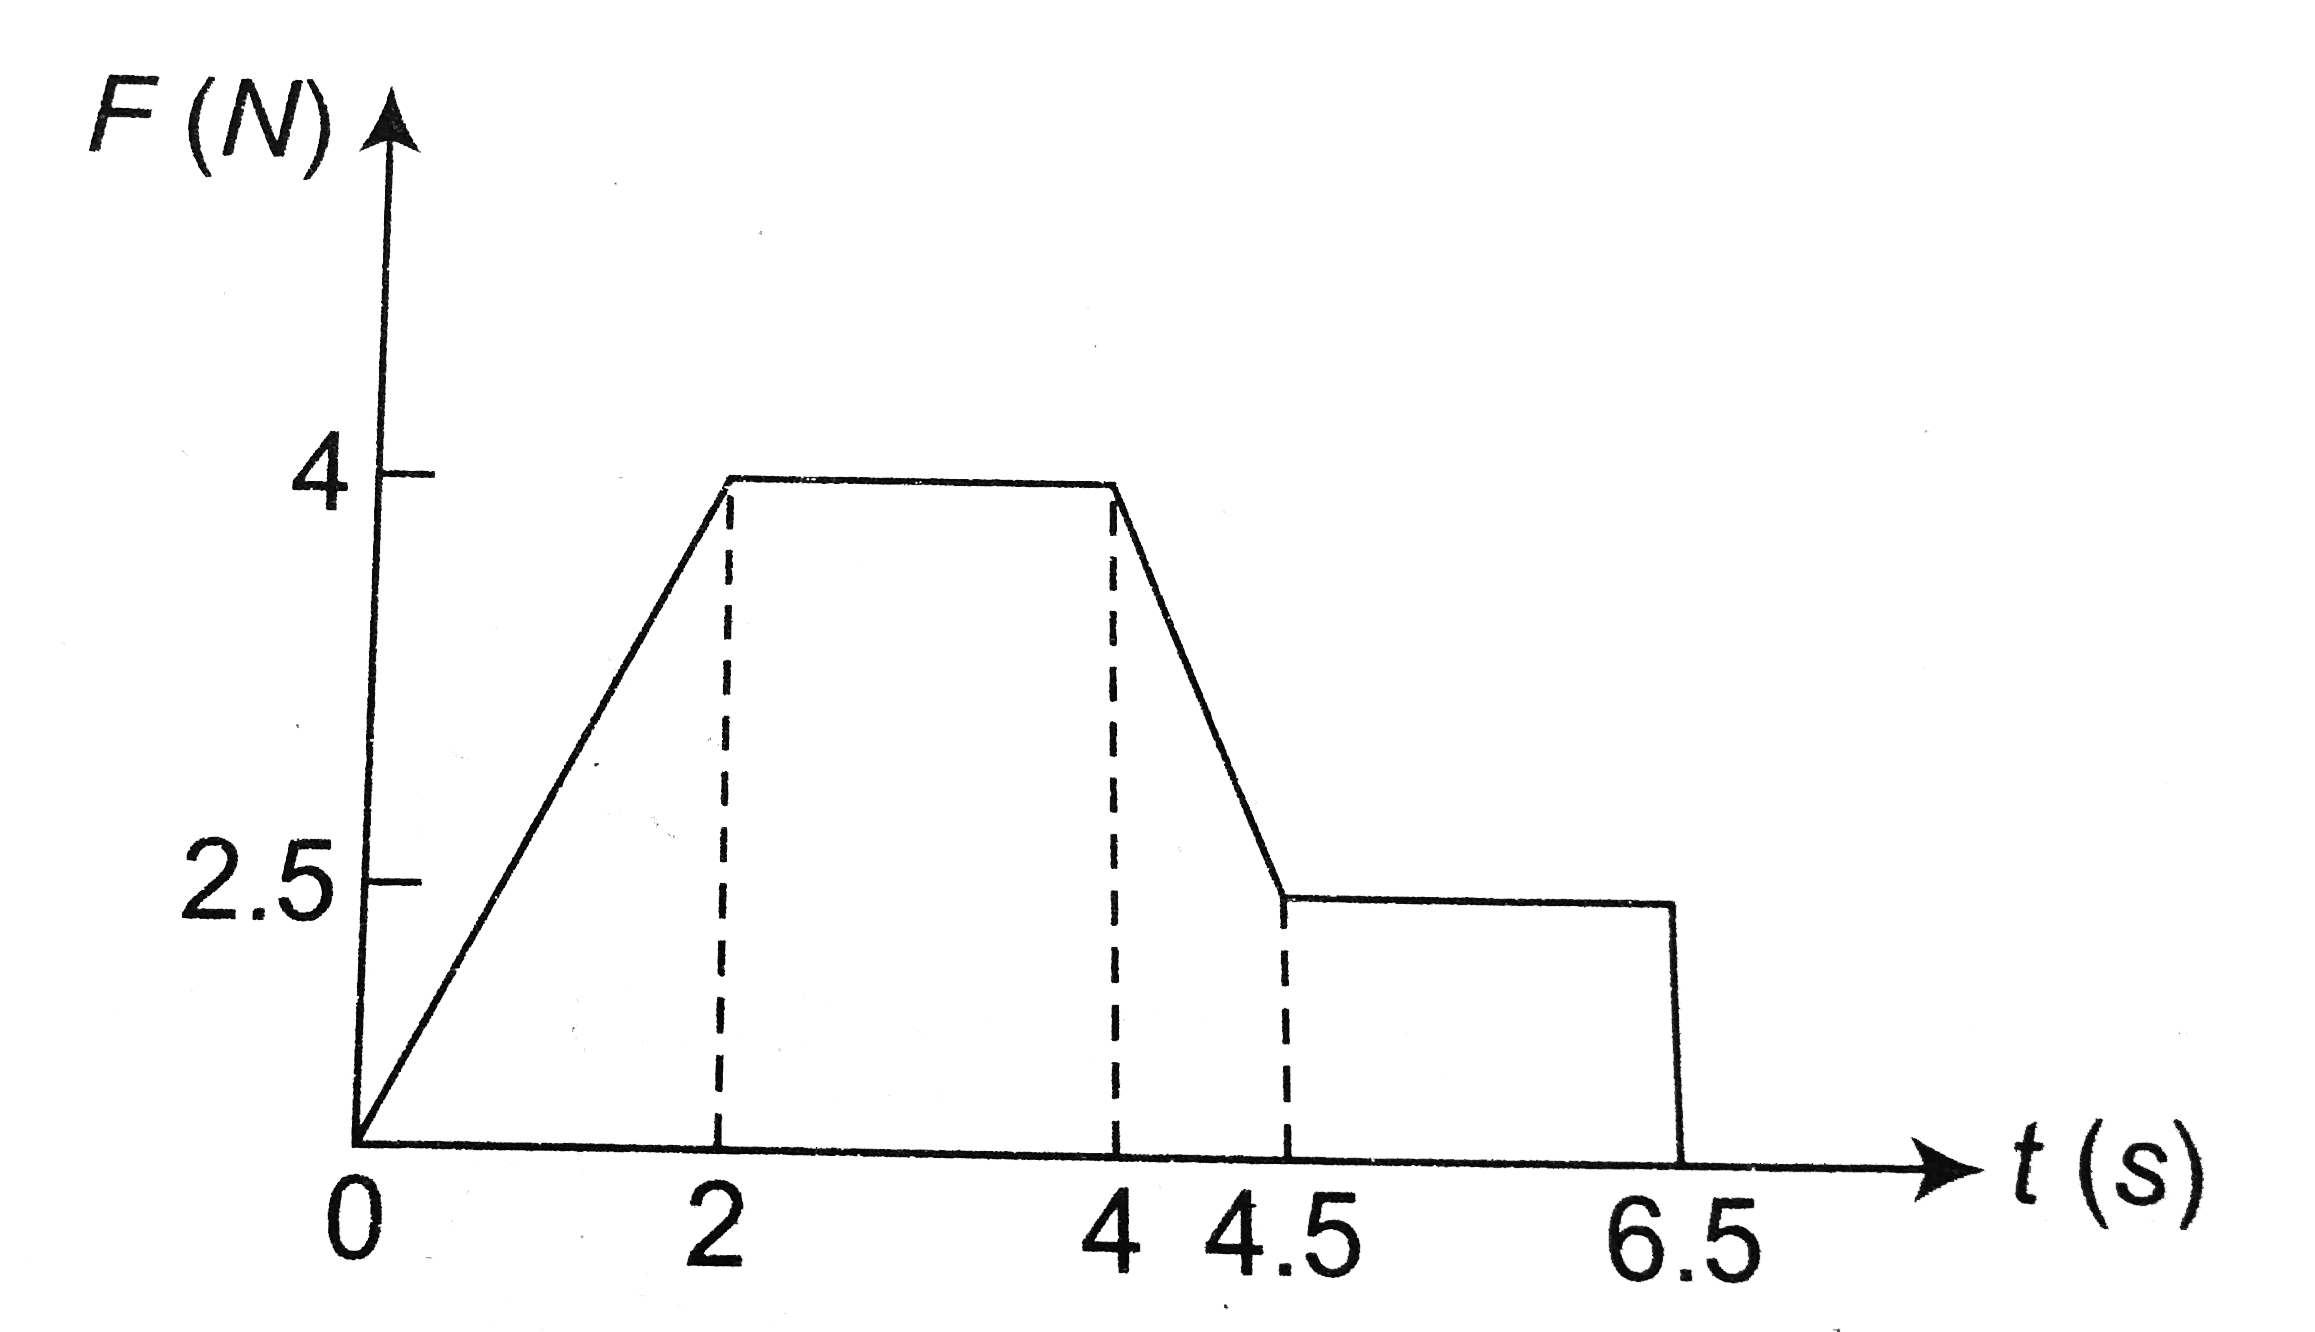
View SolutionA body of 2kg has an initial speed 5ms−1 . A force acts on it for some time in the direction of motion. The force time graph is shown in figure. The force time graph is shown in figure. The final speed of the body is
View Solution
