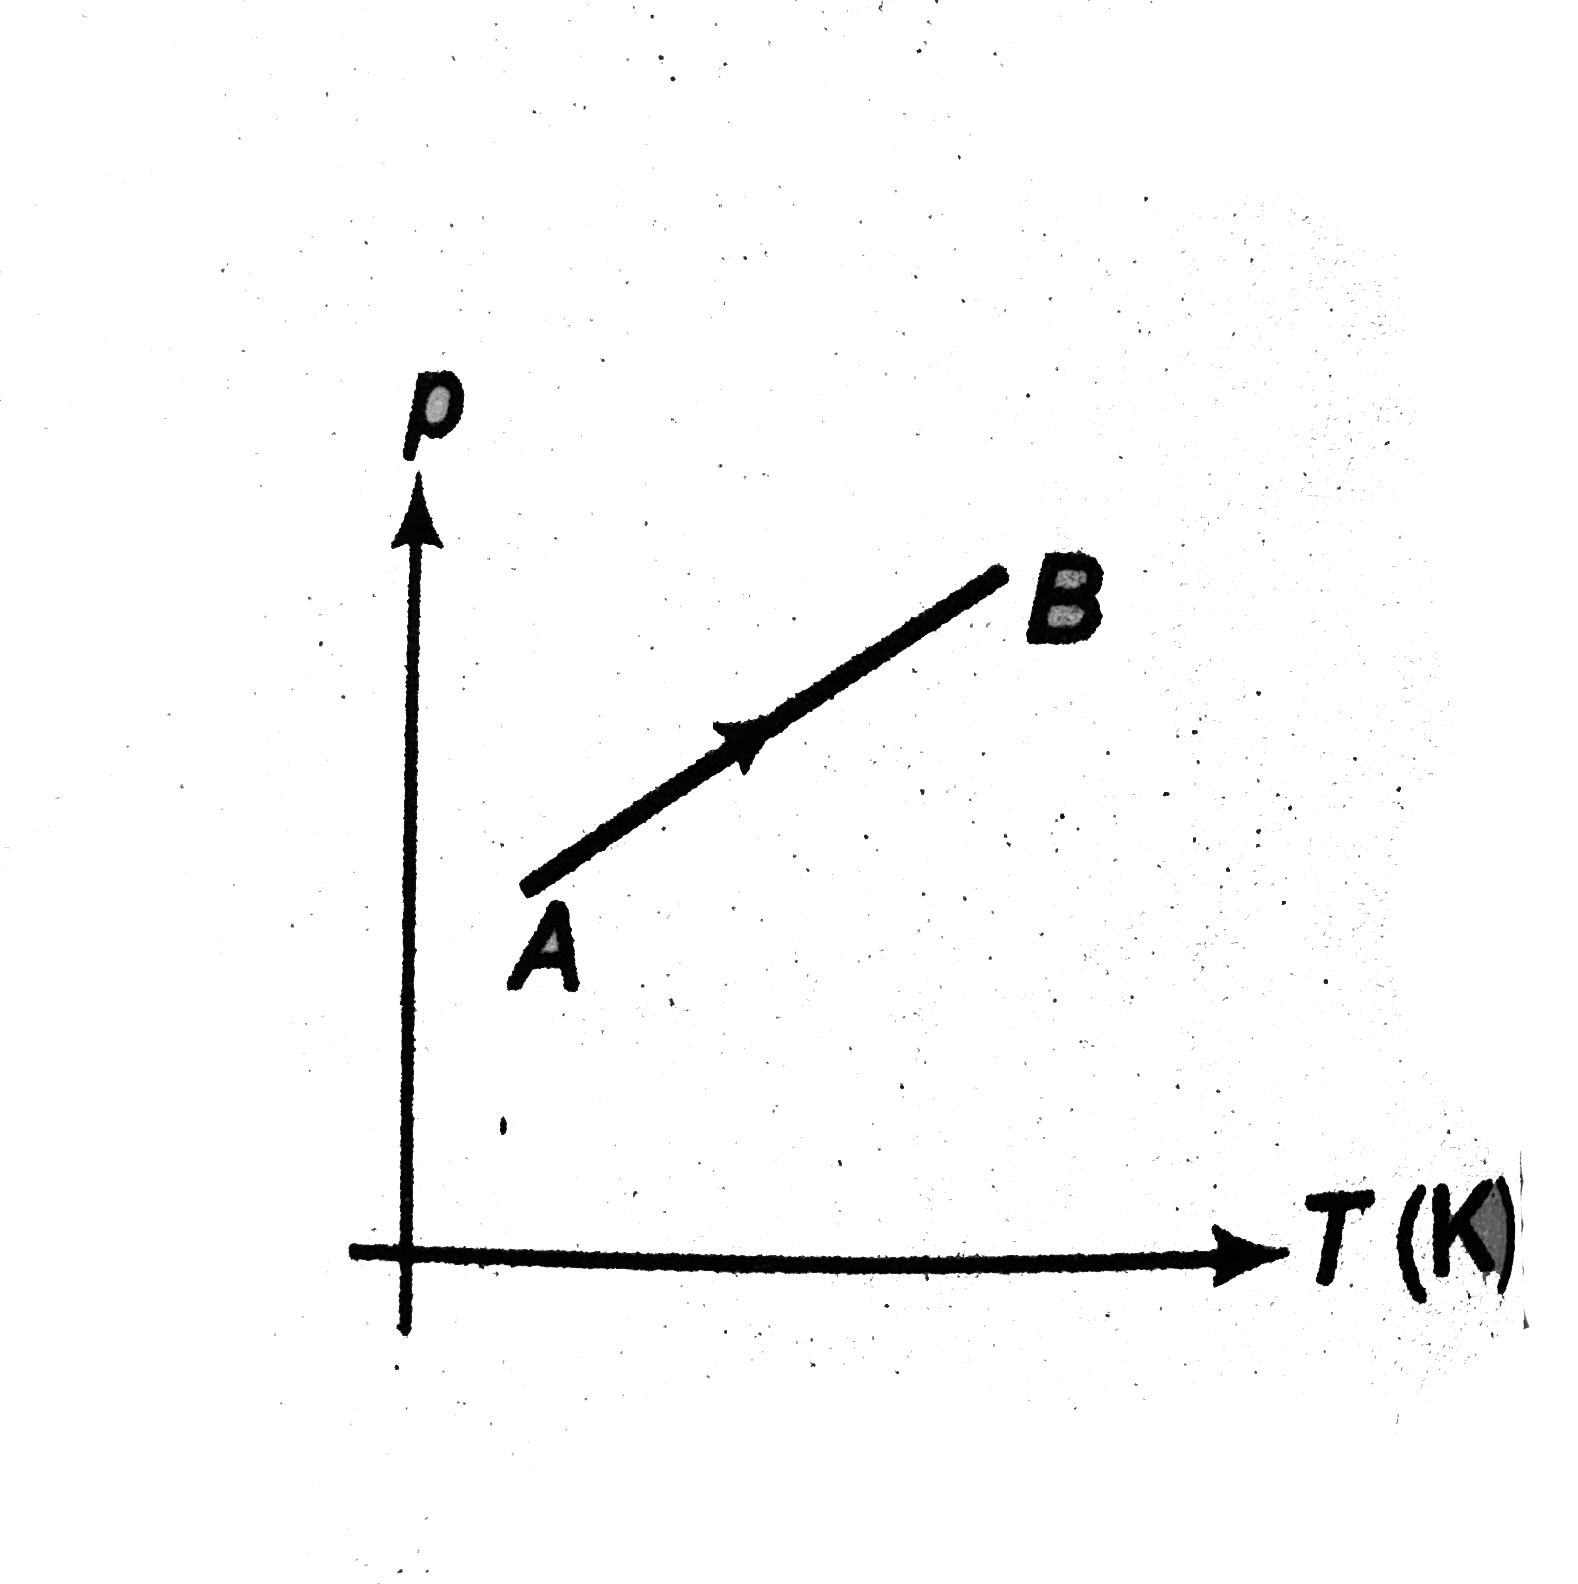
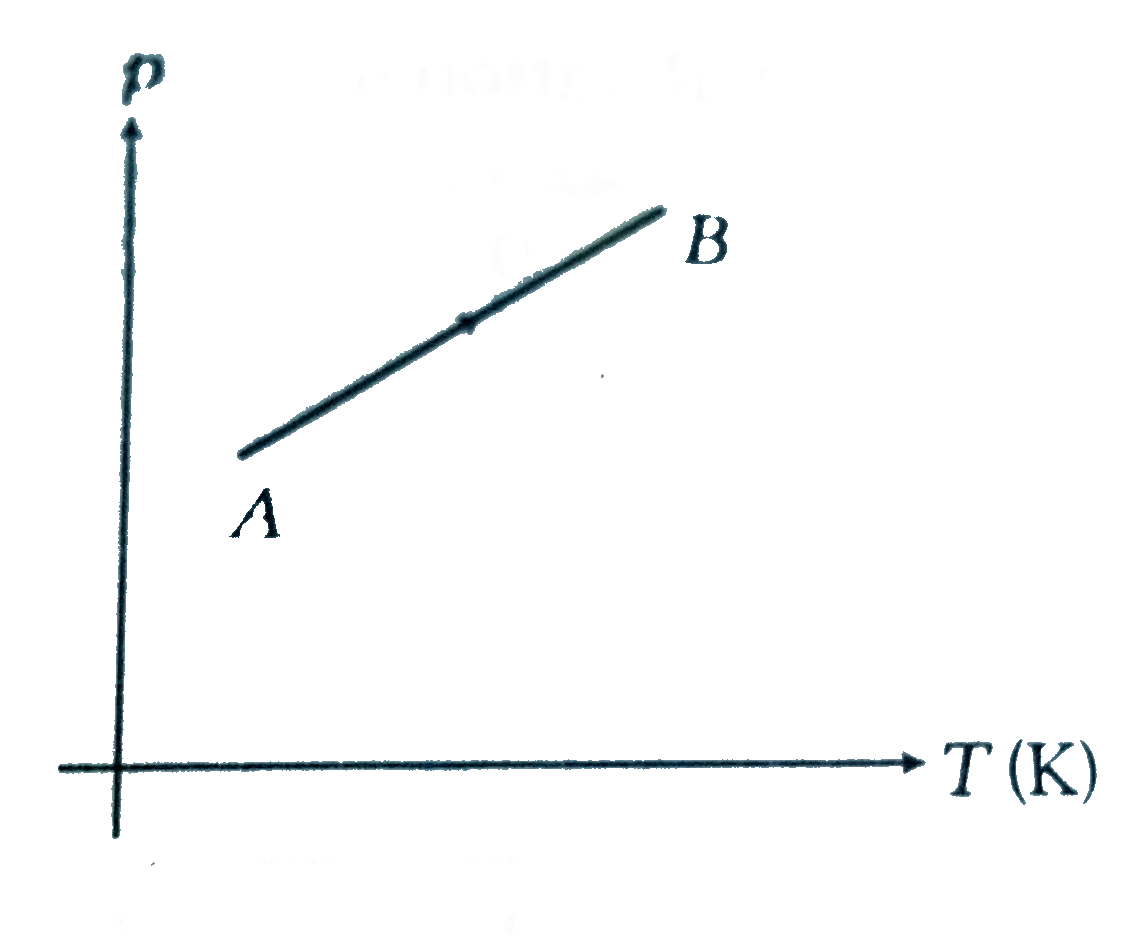
The p-T graph for the given mass of an ideal gas is shown in figure. What inference can be drawn regarding the change in volume (whether it is constant, increasing or decreasing) ?
How to proceed Definitely, it is not constant. Because when volume of the gas is constant p−T graph is a straight line passing through origin. The given line does not pass through origin, hence volume is not constant.  .
.
V=(nR)(TP)
Now, to see volume of the gas we will have to see whether TP is increasing or decreasing.
The correct Answer is:A, B
From the given graph, we can write the p−Tequation as
p=aT+b
Now, TB>TA
:. bTB<bTAor(PT)B<(PT)A
or (TP)B>(PT)A
or VB>VA
Thus, as we move from A to B, volume of the gas is increasimg.
Topper's Solved these Questions
- THERMOMETRY,THERMAL EXPANSION & KINETIC THEORY OF GASESBOOK - DC PANDEY ENGLISHCHAPTER - THERMOMETRY,THERMAL EXPANSION & KINETIC THEORY OF GASESEXERCISE - Example Type 1
1 Videos
- THERMOMETRY,THERMAL EXPANSION & KINETIC THEORY OF GASESBOOK - DC PANDEY ENGLISHCHAPTER - THERMOMETRY,THERMAL EXPANSION & KINETIC THEORY OF GASESEXERCISE - Example Type 2
1 Videos
- THERMOMETRY THERMAL EXPANSION AND KINETIC THEORY OF GASESBOOK - DC PANDEY ENGLISHCHAPTER - THERMOMETRY THERMAL EXPANSION AND KINETIC THEORY OF GASESEXERCISE - Medical entrance gallary
30 Videos
- UNIT AND DIMENSIONSBOOK - DC PANDEY ENGLISHCHAPTER - UNIT AND DIMENSIONSEXERCISE - Assertion And Reason
2 Videos
Similar Questions
The p−T graph for the given mass of an ideal gas is shown in figure. What inference can be drawn regarding the change in Volume (whtherit is constant, increasing or decreasing) ?

View SolutionAssertion : V = iR is Ohm's law.
Reason : V - I graph is always a straight line passing through origin.
View SolutionP-V diagram of a diatomic gas is a straight line passing through origin. The molar heat capacity of the gas in the process will be
View SolutionP-V diagram of a diatomic gas is a straight line passing through origin. The molar heat capacity of the gas in the process will be
View SolutionThe position-time graph of a moving particle is a straight line inclined with time axis and passing through origin, therefore
View SolutionThe pressure of a given mass of a gas contained in a vessel at constant temperature is reduced to half. Calculte the change in volume of the gas
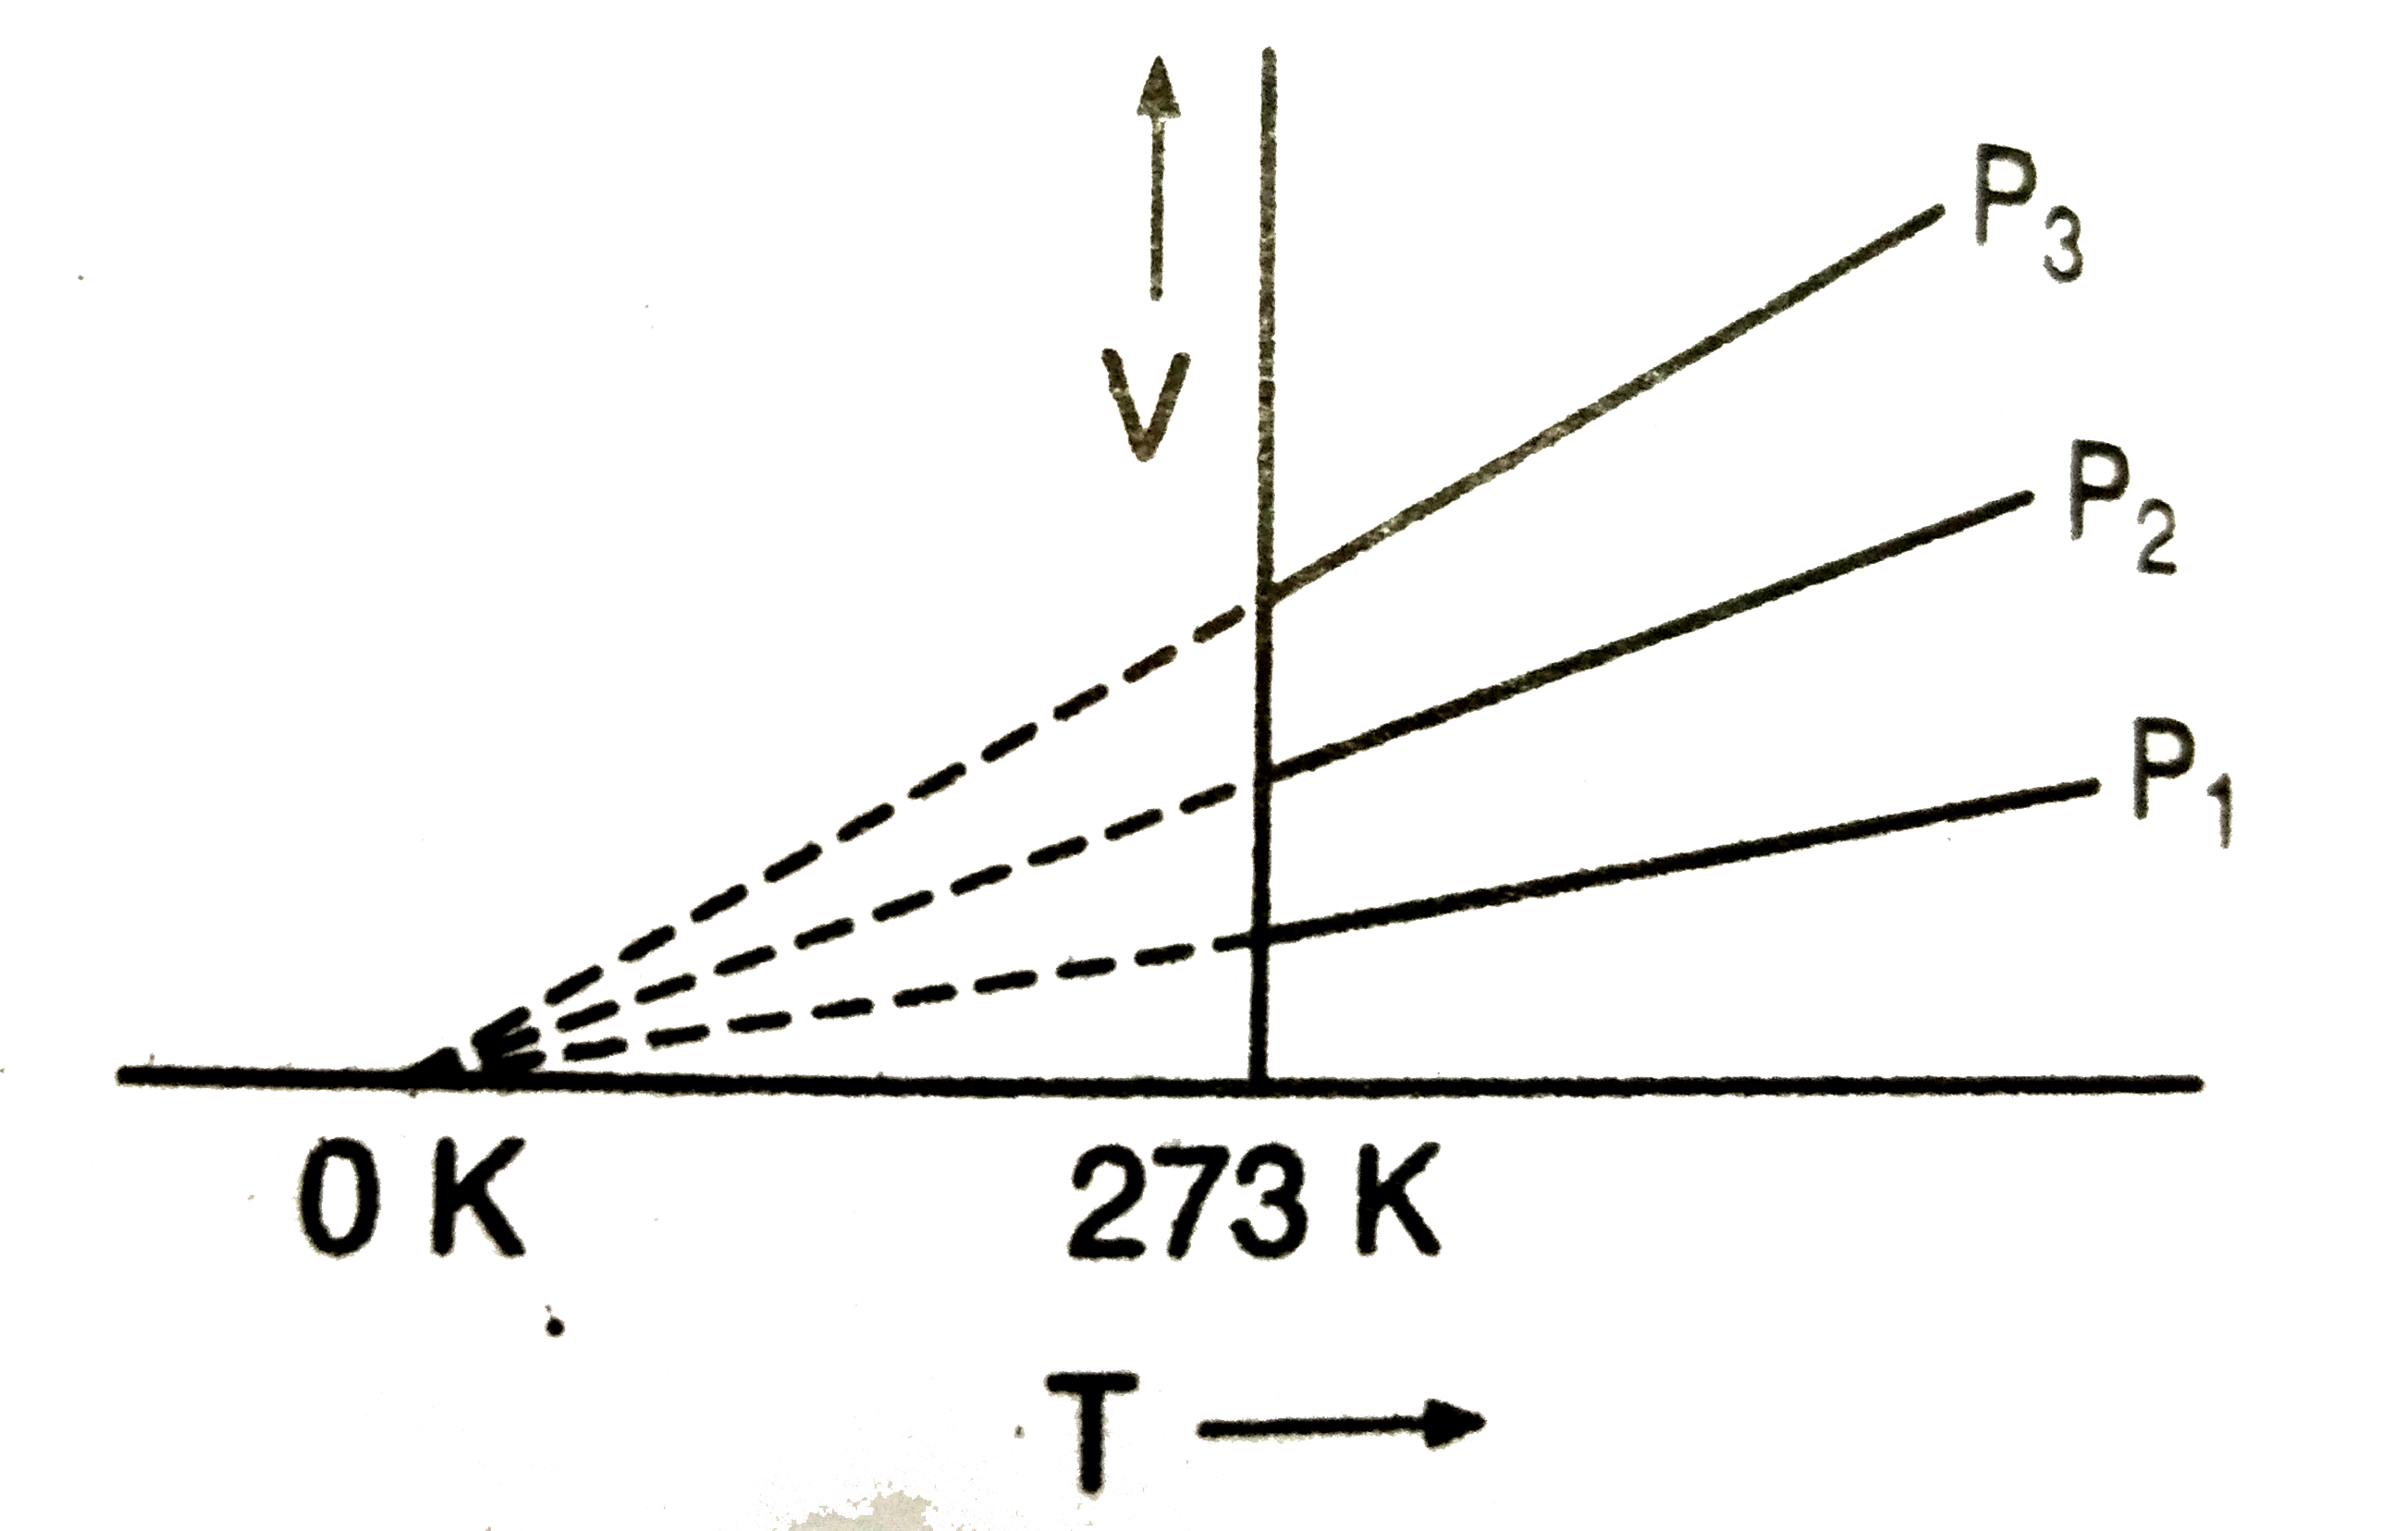
View SolutionThe volume-temperature graphs of a given mass of an ideal gas at constant pressure are shown below. What is the correct order of pressure ?

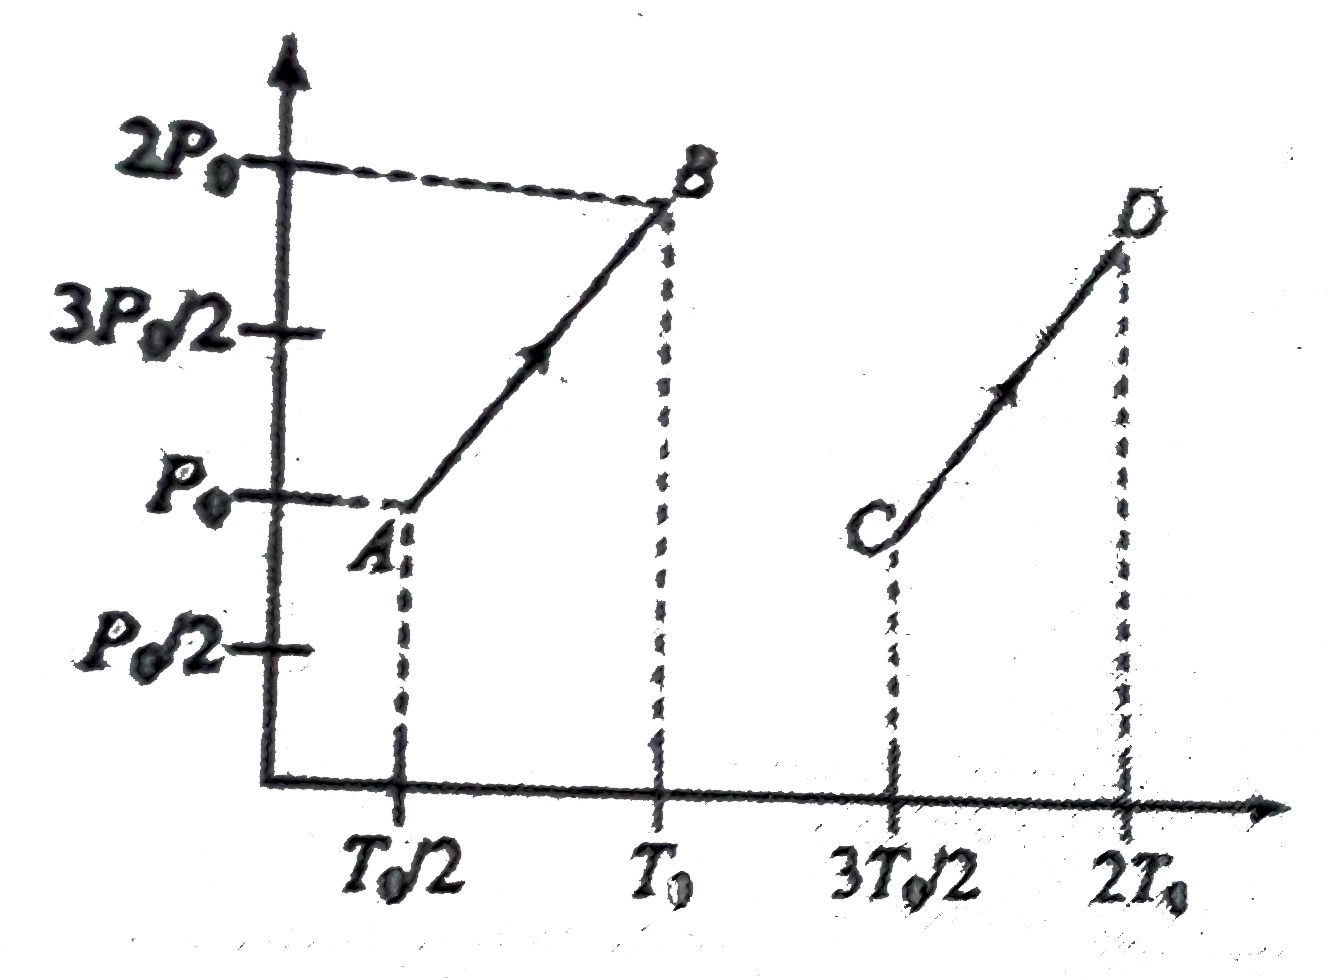
View SolutionP-T graph for same number of moles of two ideal gases are shown . Find the path along which volume decreases .

View SolutionThe volume of a given mass of a gas in a vessel is reduced to half at constant temperature what is the change in pressure?
View SolutionHow many lines can be drawn to pass through two given fixed points P and Q ?
View Solution
