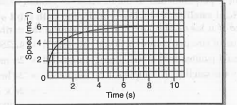
The speed time graph for a car is shown in fig 8.12
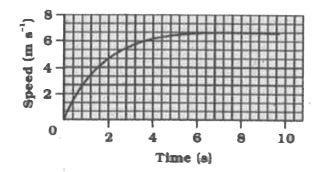
Find out how far the car travels in the first 4 seconds. Shade the area on the graph that represents the distance travelled by the car during the period.
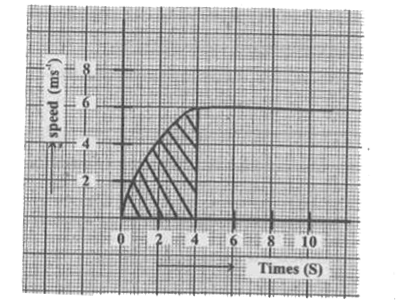
The shaded area which is equal to ½×4×6=12m represents the distance travelled by the car in the first 4s.
Topper's Solved these Questions
- MOTIONBOOK - CPC CAMBRIDGE PUBLICATIONCHAPTER - MOTIONEXERCISE - Additional Question ( Answer the Question )
11 Videos
- MOTIONBOOK - CPC CAMBRIDGE PUBLICATIONCHAPTER - MOTIONEXERCISE - Unit Test
6 Videos
- MOTIONBOOK - CPC CAMBRIDGE PUBLICATIONCHAPTER - MOTIONEXERCISE - Unit Test
6 Videos
- GRAVITATIONBOOK - CPC CAMBRIDGE PUBLICATIONCHAPTER - GRAVITATIONEXERCISE - ADDITIONAL QUESTIONS (MATCH THE FOLLOWING)
1 Videos
- SOUNDBOOK - CPC CAMBRIDGE PUBLICATIONCHAPTER - SOUNDEXERCISE - ADDITIONAL QUESTIONS (IV. Answer the following :-)
10 Videos
Similar Questions
The speed-time graph for a car is shown is Figure
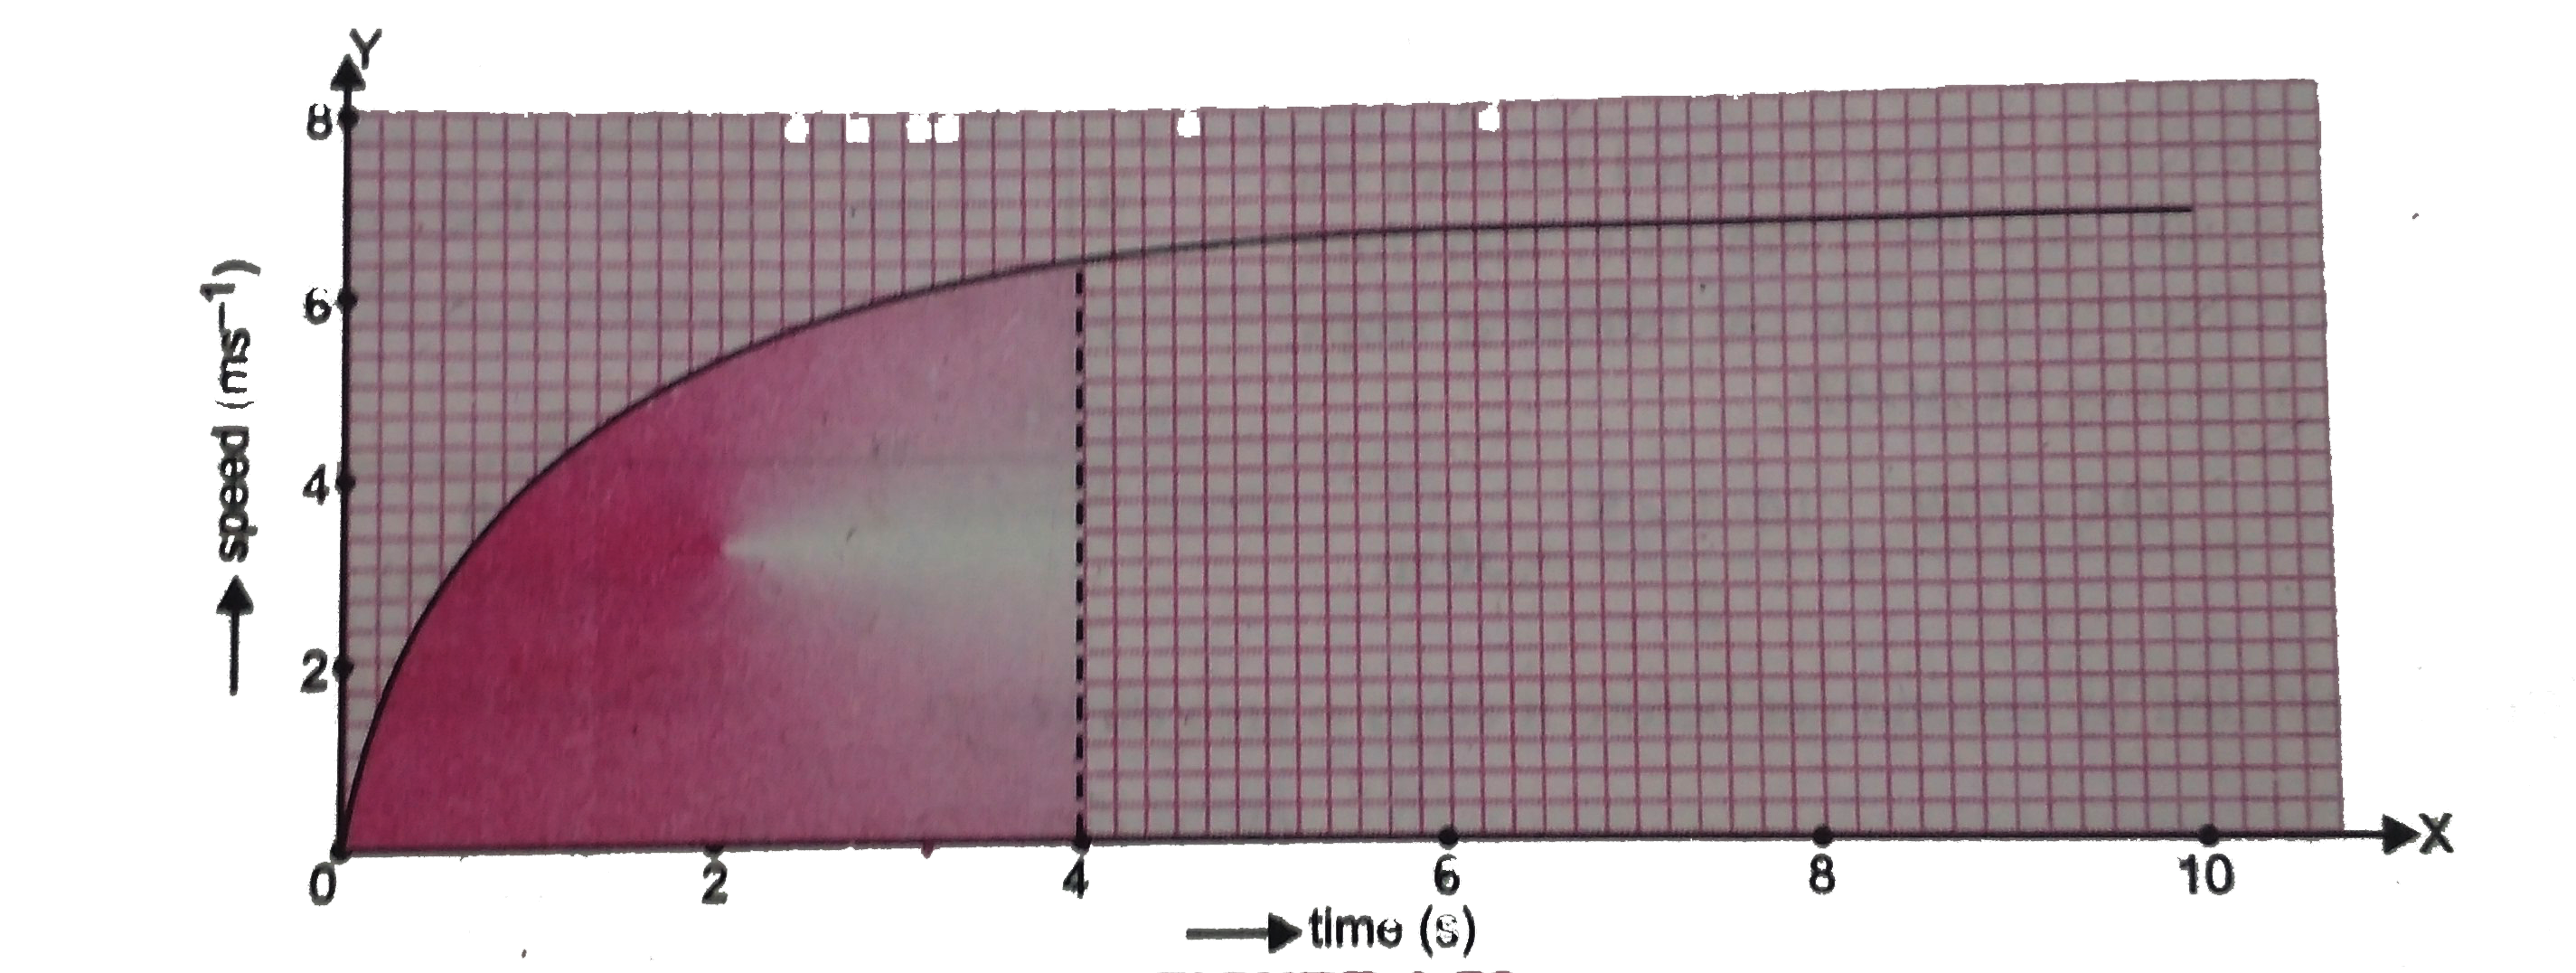
(a) Find how far does the car travel in the first 4 seconds. Shade the area on the graph that represents the distance travelled by the car during this period.
(b) Which part of the graph represents uniform motion of the car ?
View SolutionThe speed-time graph for a car is shown is Figure

(a) Find how far does the car travel in the first 4 seconds. Shade the area on the graph that represents the distance travelled by the car during this period.
(b) Which part of the graph represents uniform motion of the car ?
View Solution
Knowledge Check
A car travels at a speed of 75 m/s. for 2 hours. What is the distance (in km) travelled by the car?
A500B525C540D550A car travels at a speed of 50 m/s. for 5 hours. What is the distance (in km) travelled by the car?
A1000B900C990D500The graph given here shows a car following the linear path with uniform speed. Study the graph and answer the questions.
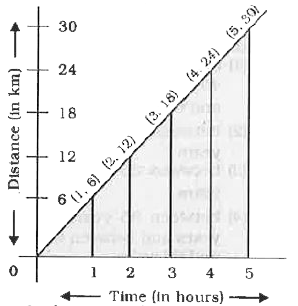
The distance travelled by the car in 4.5 hours isA27 kmB30 kmC36 kmD40 km
The speed-time graph for a car is shown is Figure

(a) Find how far does the car travel in the first 4 seconds. Shade the area on the graph that represents the distance travelled by the car during this period.
(b) Which part of the graph represents uniform motion of the car ?
View SolutionSpeed - time graph for a car is show in the fig 1.13:Which part of the graph represents uniform motion of the car ?
View SolutionThe speed of a car as a function of time is shown in figure.
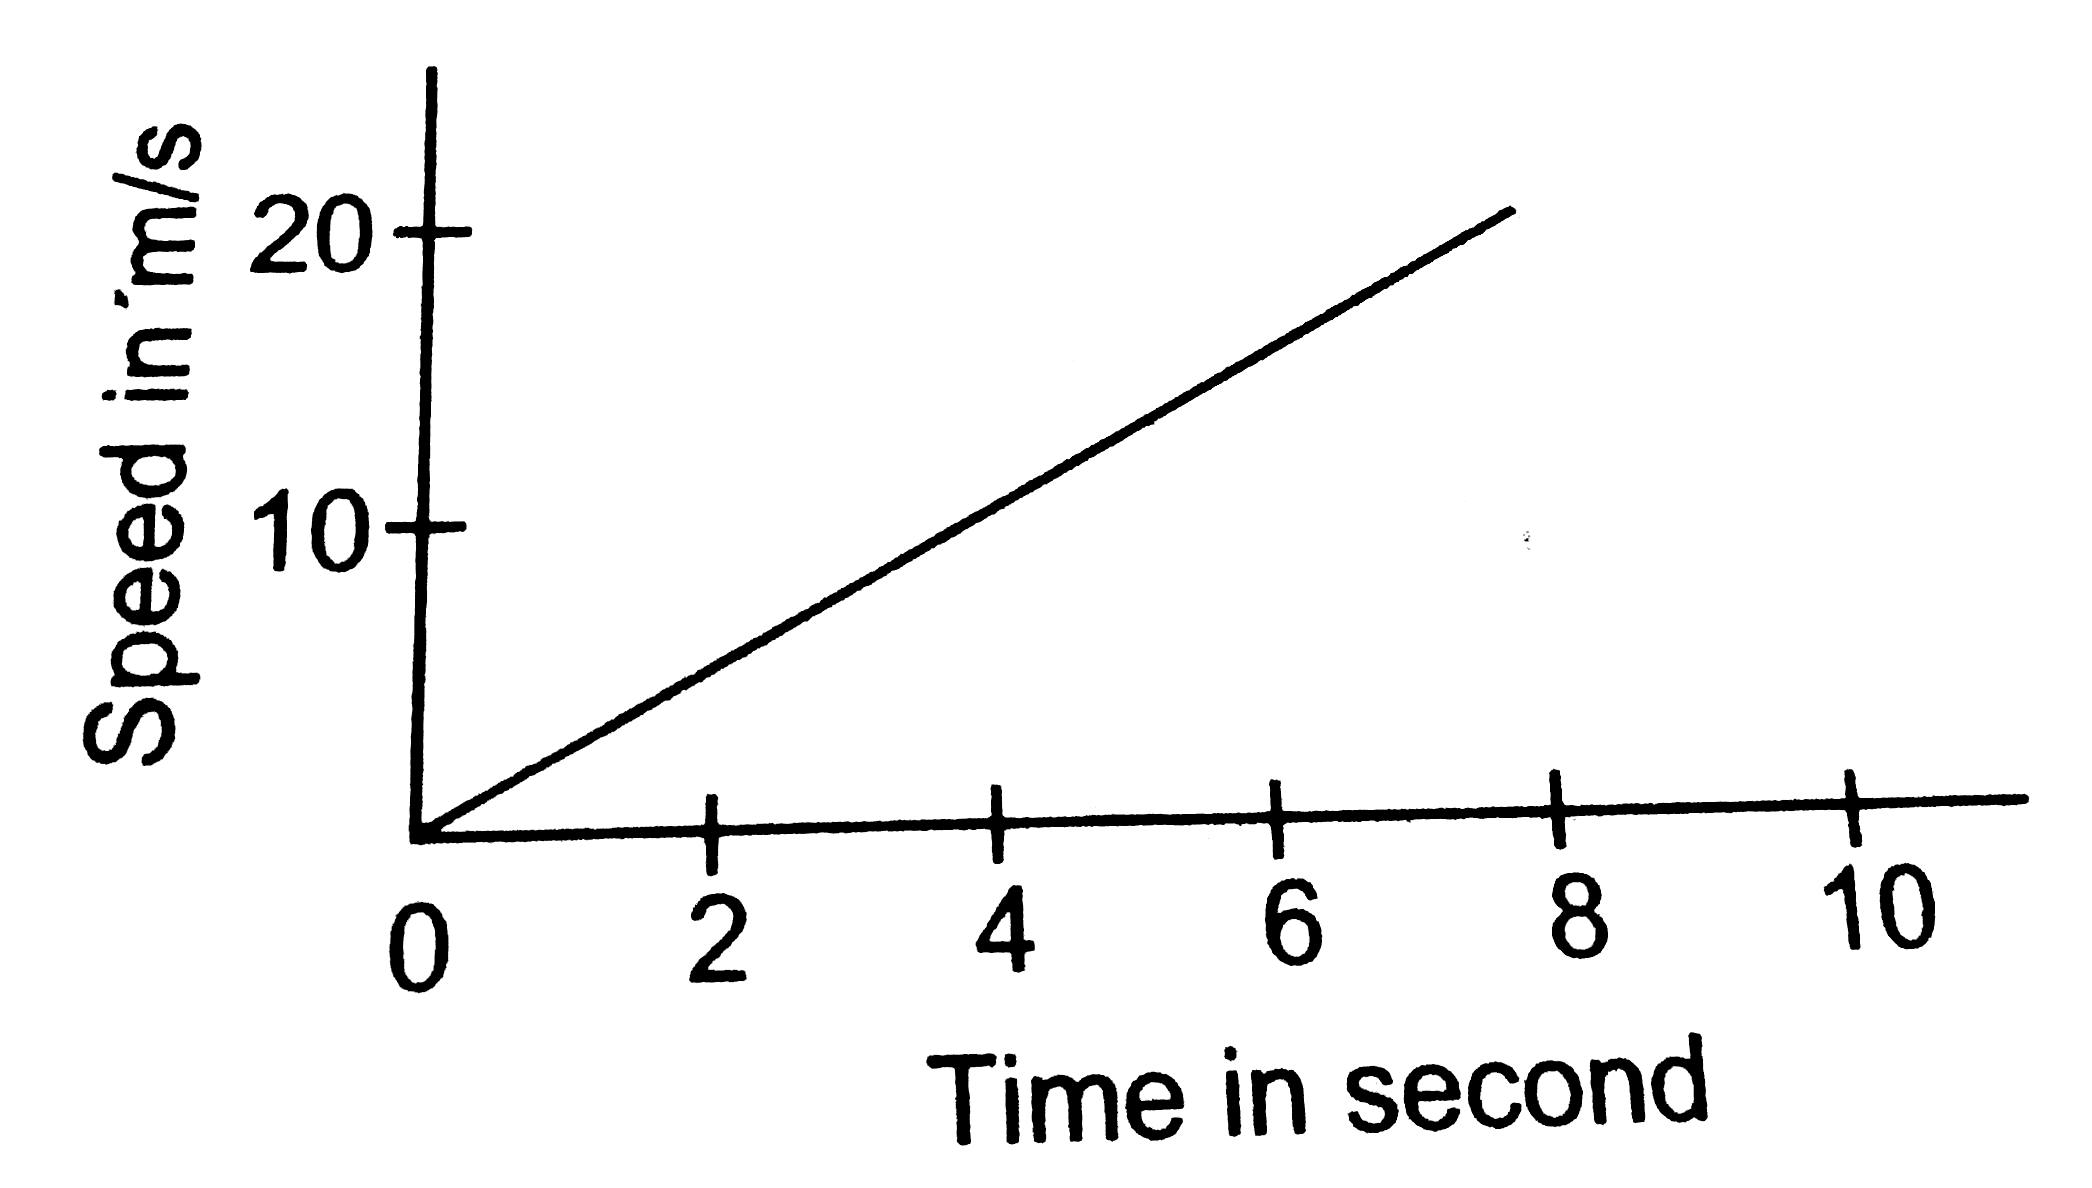
Find the distance travelled by the car in 8 seconds and its acceleration.
View SolutionThe speed of a car as a function of time is shown in figure.

Find the distance travelled by the car in 8 seconds and its acceleration.
View SolutionA car travels for 20 min with a constant speed of 54 km h−1 Find the distance travelled by the car.
View Solution
