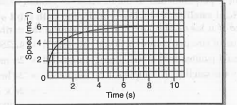
The speed time graph for a car is shown in fig 8.12
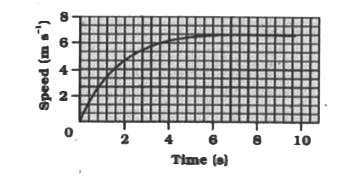
Which part of the graph represents uniform motion of the car?
The part of the graph in red color between time 6s to 10s represents uniform motion of the car.
Topper's Solved these Questions
- MOTIONBOOK - CPC CAMBRIDGE PUBLICATIONCHAPTER - MOTIONEXERCISE - Additional Question ( Answer the Question )
11 Videos
- MOTIONBOOK - CPC CAMBRIDGE PUBLICATIONCHAPTER - MOTIONEXERCISE - Unit Test
6 Videos
- MOTIONBOOK - CPC CAMBRIDGE PUBLICATIONCHAPTER - MOTIONEXERCISE - Unit Test
6 Videos
- GRAVITATIONBOOK - CPC CAMBRIDGE PUBLICATIONCHAPTER - GRAVITATIONEXERCISE - ADDITIONAL QUESTIONS (MATCH THE FOLLOWING)
1 Videos
- SOUNDBOOK - CPC CAMBRIDGE PUBLICATIONCHAPTER - SOUNDEXERCISE - ADDITIONAL QUESTIONS (IV. Answer the following :-)
10 Videos
Similar Questions
Knowledge Check
Which of the following graph represents uniform motion
A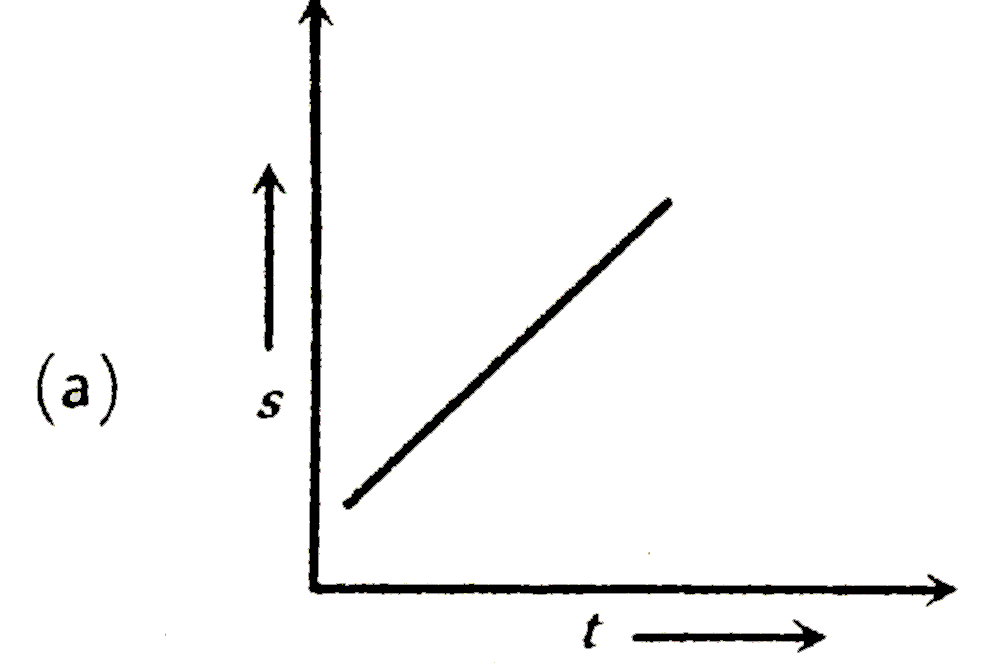 B
B C
C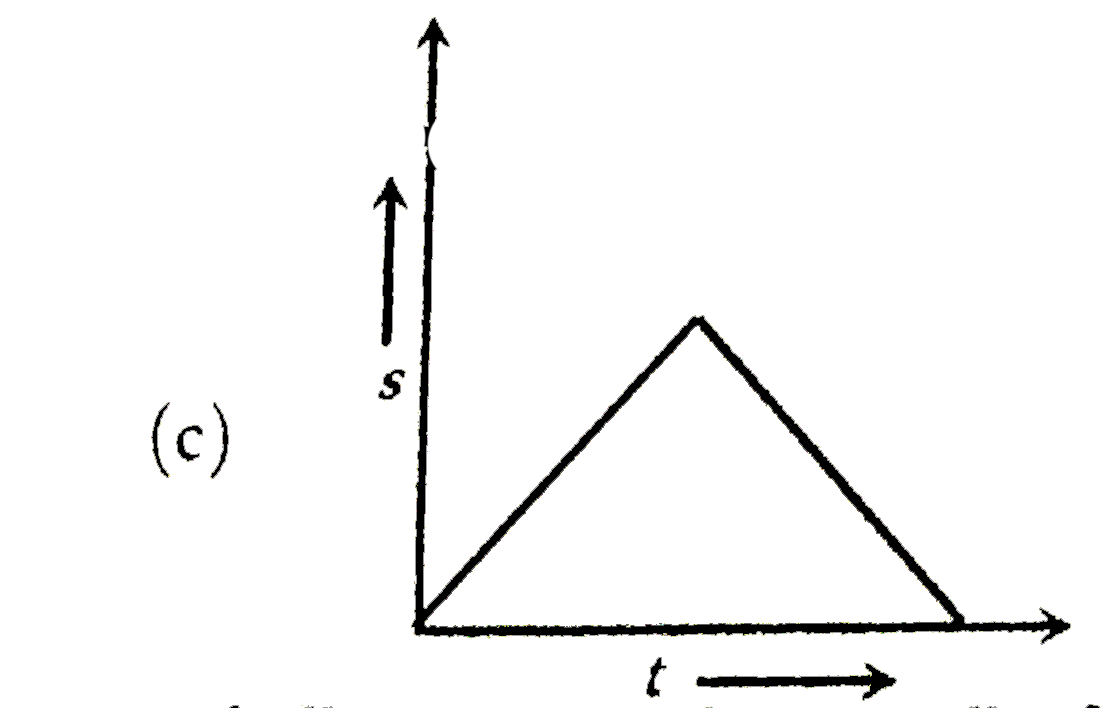 D
D
The distance- time graph of a body is as shown in the figure. The part of the graph that represent the unifrom speed of the body is
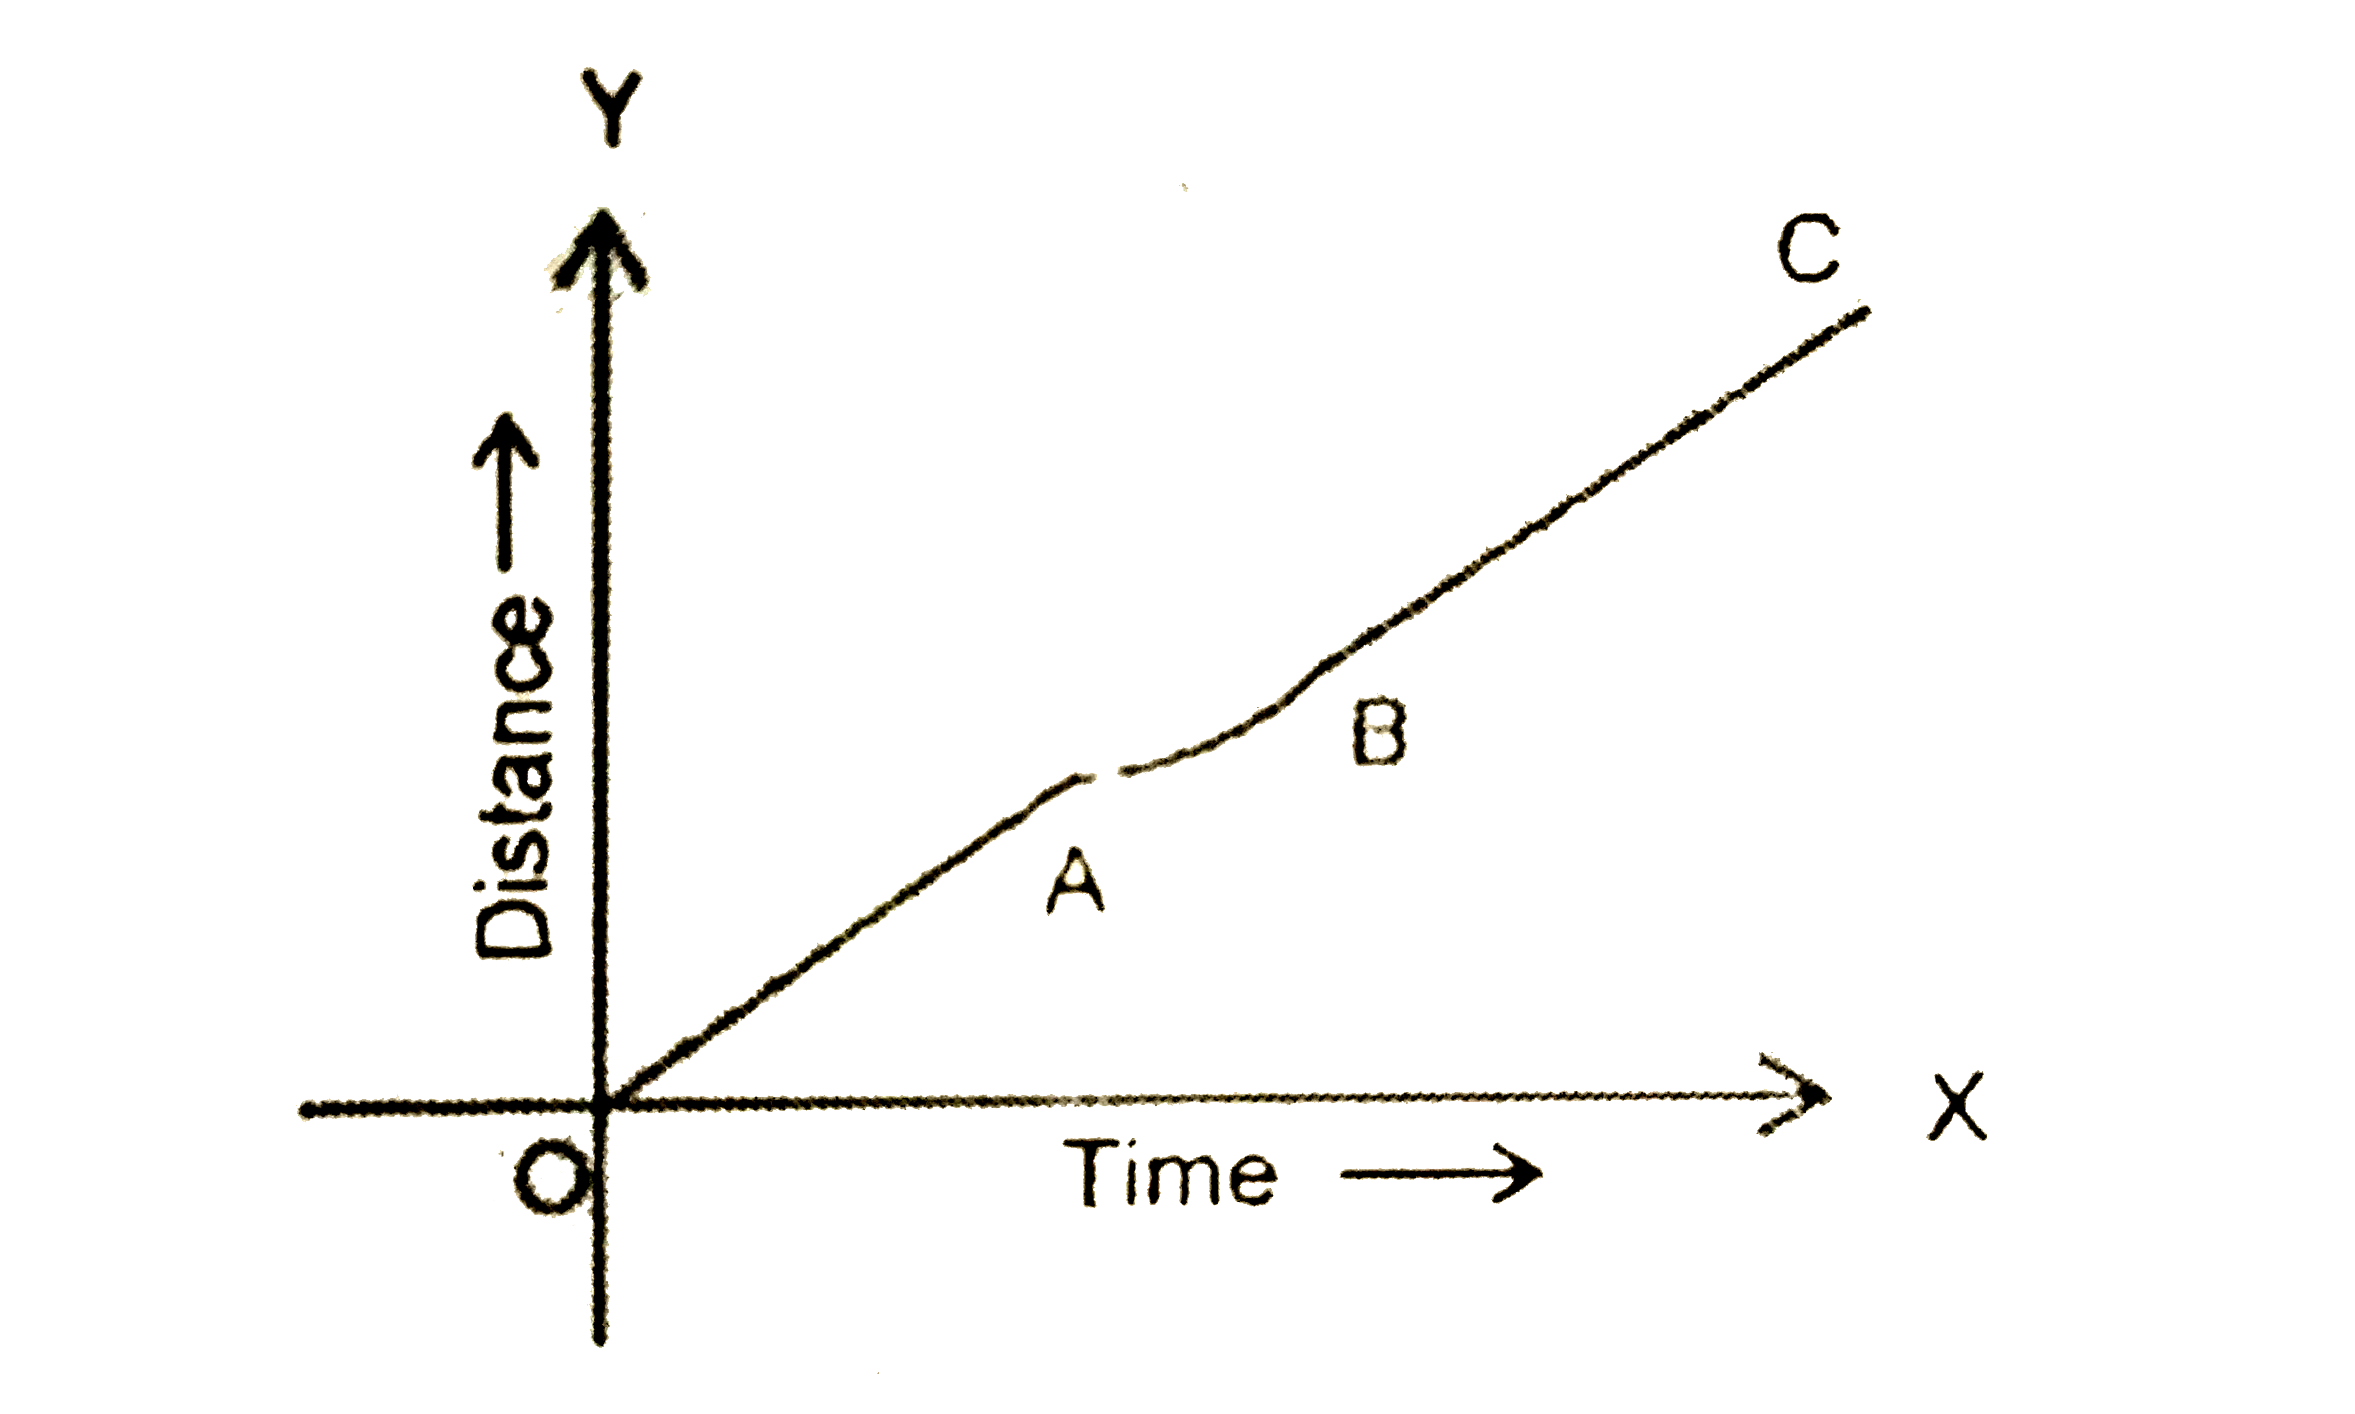 AOABABCBCDBoth OA and BC
The distance- time graph of a body is as shown in the figure. The part of the graph that represent the unifrom speed of the body is
 AOABABCBCDBoth OA and BC
Which of the following graph represents uniform motion
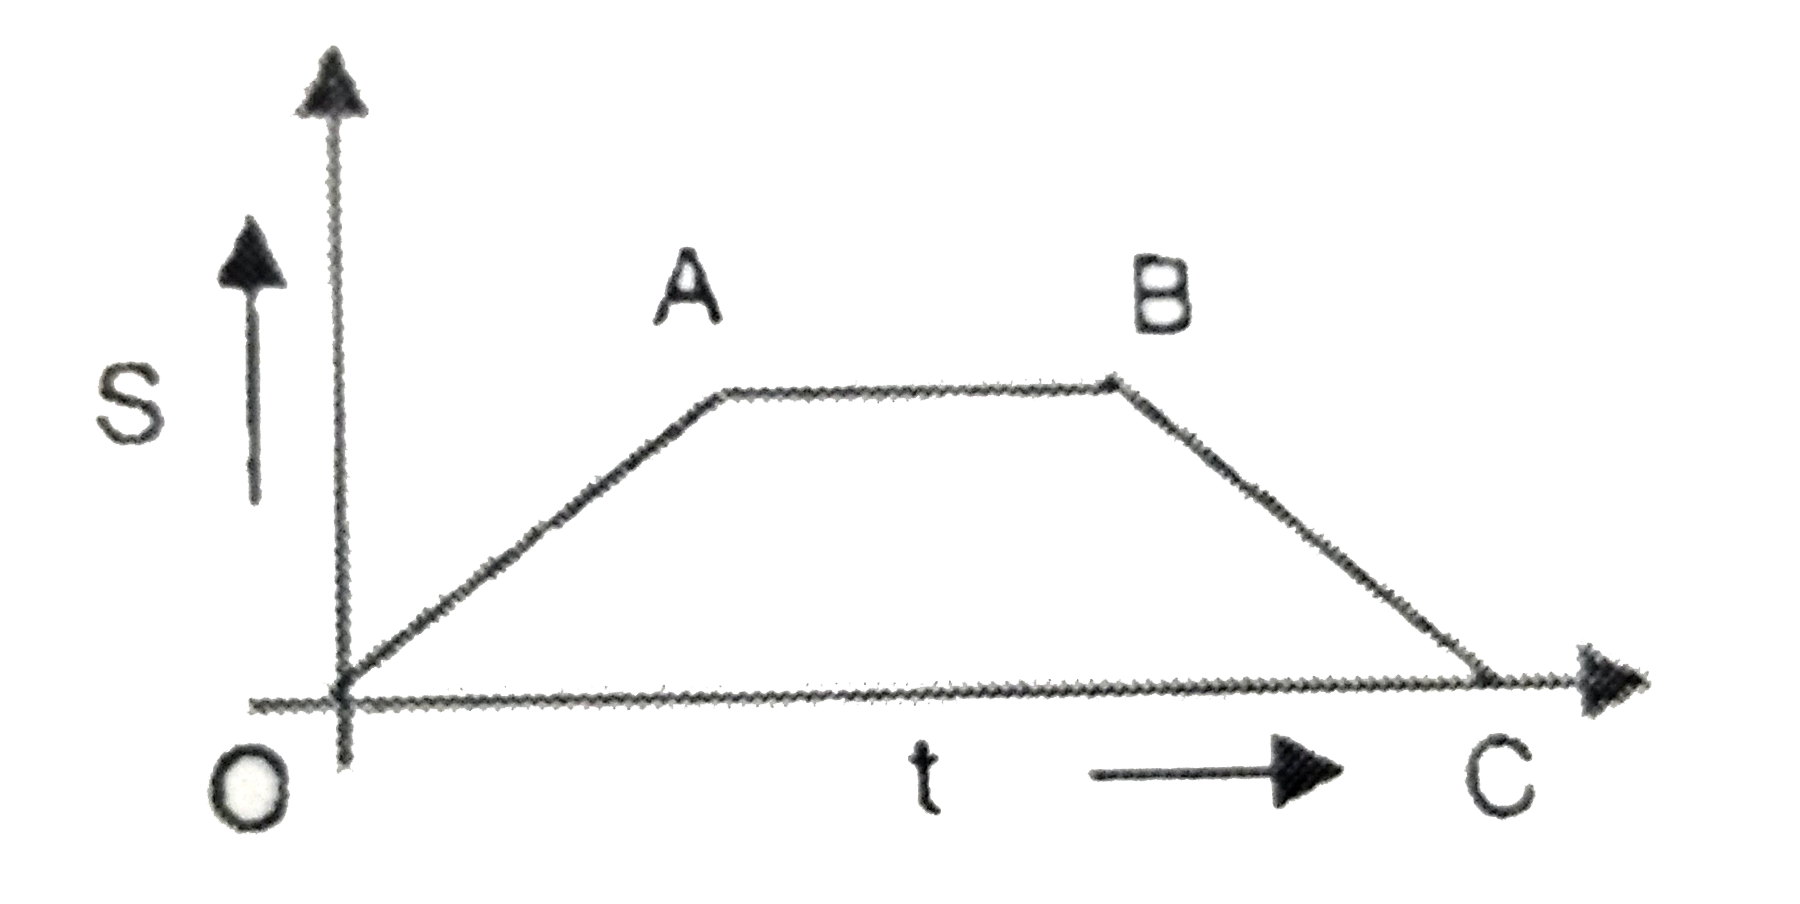
View SolutionThe displacement-time graph of a body is shown in the figure below. The part of the graph that represents the uniform motion of the body is _________
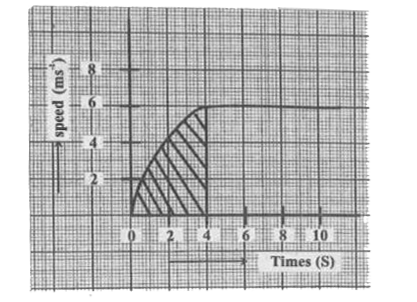
View SolutionThe speed-time graph for a car is shown is Figure
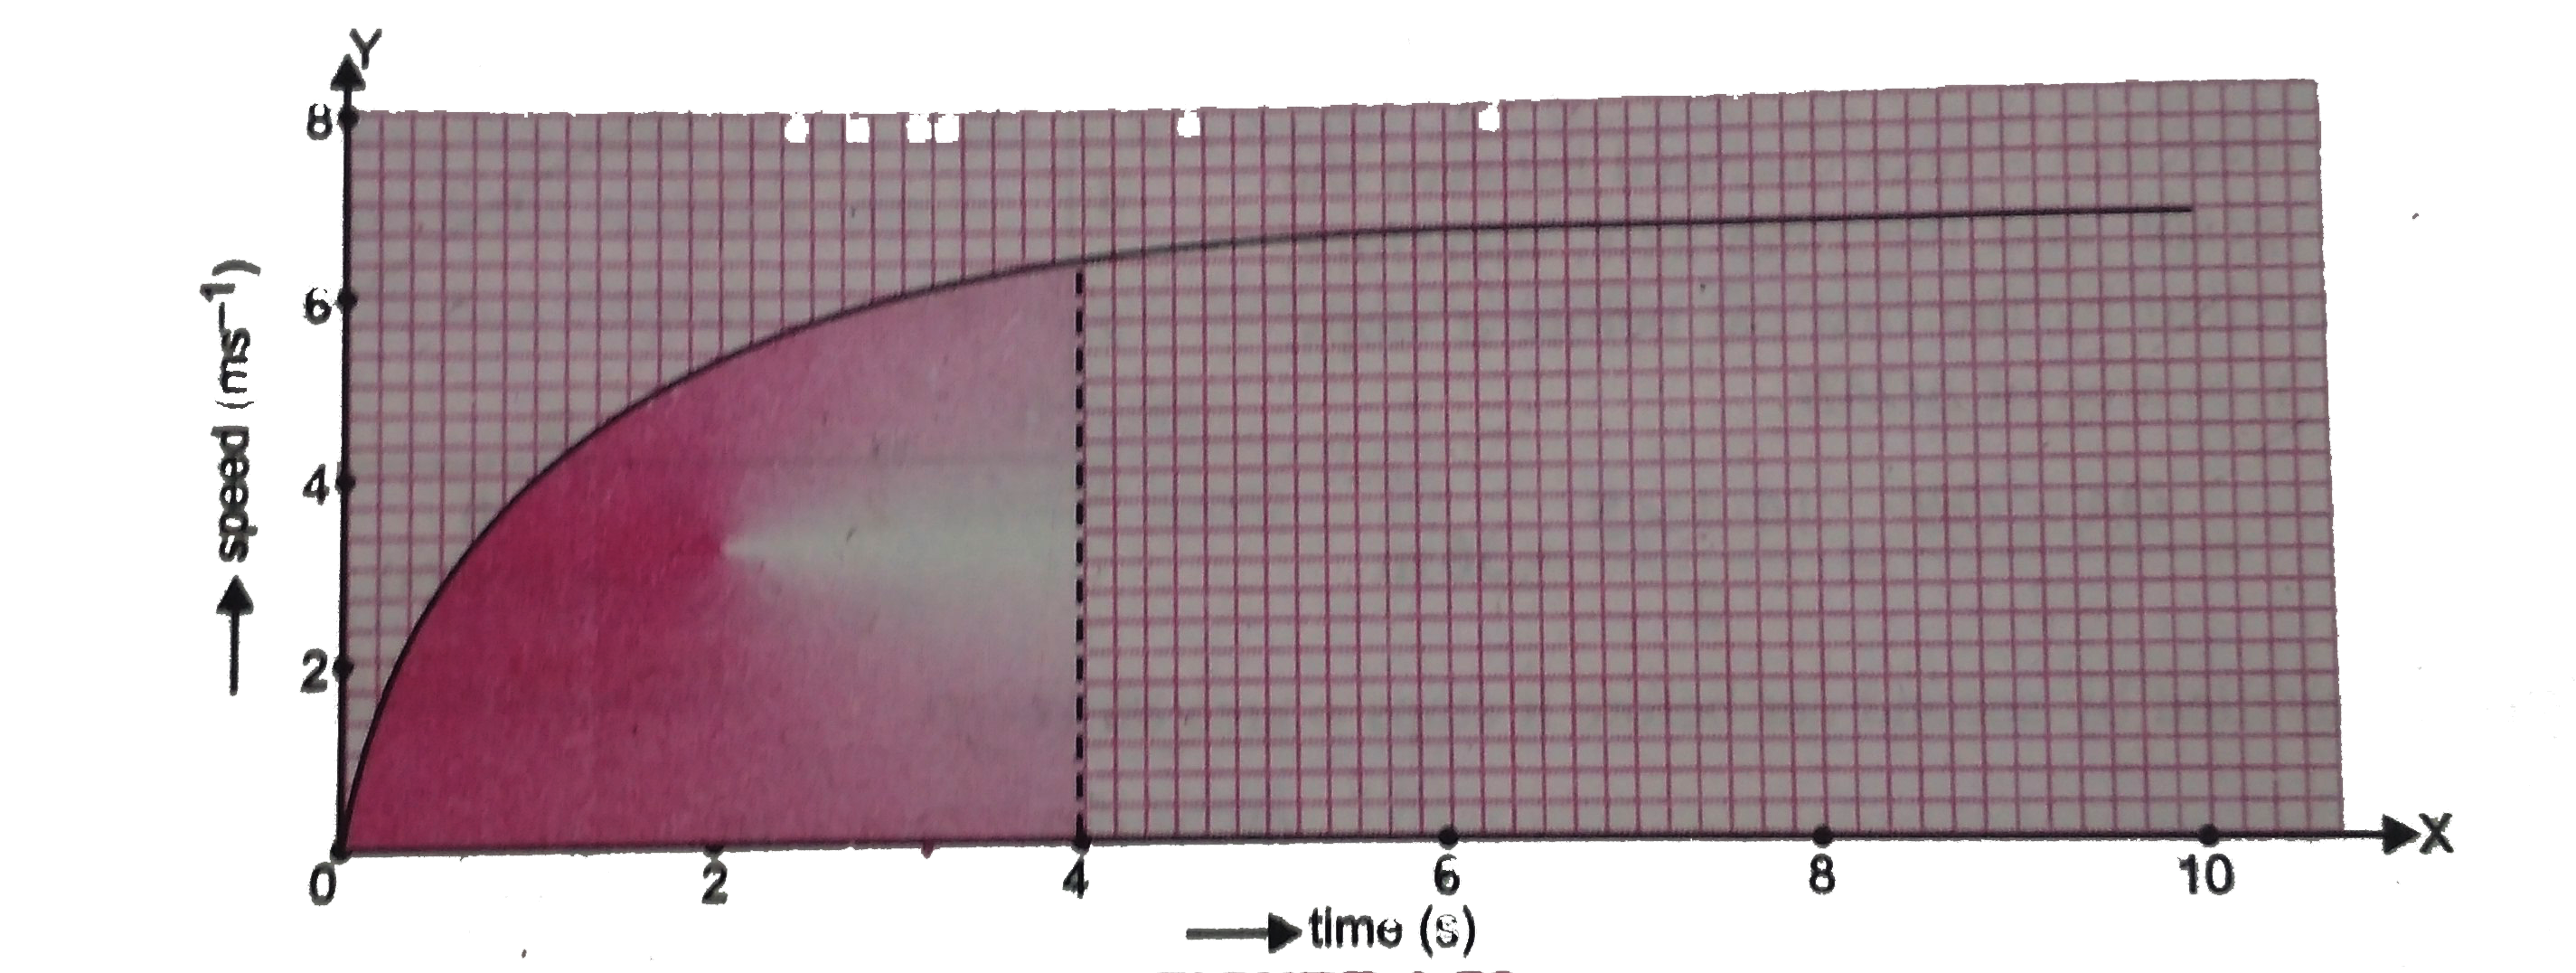
(a) Find how far does the car travel in the first 4 seconds. Shade the area on the graph that represents the distance travelled by the car during this period.
(b) Which part of the graph represents uniform motion of the car ?
View SolutionThe speed-time graph for a car is shown is Figure

(a) Find how far does the car travel in the first 4 seconds. Shade the area on the graph that represents the distance travelled by the car during this period.
(b) Which part of the graph represents uniform motion of the car ?
View SolutionThe speed-time graph for a car is shown is Figure

(a) Find how far does the car travel in the first 4 seconds. Shade the area on the graph that represents the distance travelled by the car during this period.
(b) Which part of the graph represents uniform motion of the car ?
View Solution

