The speed-time graph of a particle moving along a fixed direction is shown in Fig. Then which of the following is wrong?

A) distance travelled by the particle in 10 sec is 60 m.
B) average speed in 10 sec is 6 m/s.
c) average speed between t=2, t=6 sec is 9m/s
D) average speed between t=2, t=6 sec is 6 m/s
The correct Answer is:D
Step by step video & image solution for The speed-time graph of a particle moving along a fixed direction is shown in Fig. Then which of the following is wrong? by Physics experts to help you in doubts & scoring excellent marks in Class 12 exams.
Updated on:21/07/2023Topper's Solved these Questions
- APPENDICES (REVISION EXERCISE)BOOK - AAKASH SERIESCHAPTER - APPENDICES (REVISION EXERCISE)EXERCISE - MOTION IN A PLANE
87 Videos
- APPENDICES (REVISION EXERCISE)BOOK - AAKASH SERIESCHAPTER - APPENDICES (REVISION EXERCISE)EXERCISE - LAW OF MOTION
128 Videos
- APPENDICES (REVISION EXERCISE)BOOK - AAKASH SERIESCHAPTER - APPENDICES (REVISION EXERCISE)EXERCISE - LAW OF MOTION
128 Videos
- APPENDICES ( REVISION EXERCISE )BOOK - AAKASH SERIESCHAPTER - APPENDICES ( REVISION EXERCISE )EXERCISE - REVISION EXERCISE (MAGNETISM AND MATTER )
52 Videos
- ATOMSBOOK - AAKASH SERIESCHAPTER - ATOMSEXERCISE - PRACTICE EXERCISE
21 Videos
Similar Questions
The speed-time graph of a particle moving along a fixed direction is shown in the Fig. The distance traversed by the particle between (a) t=0s→10s .
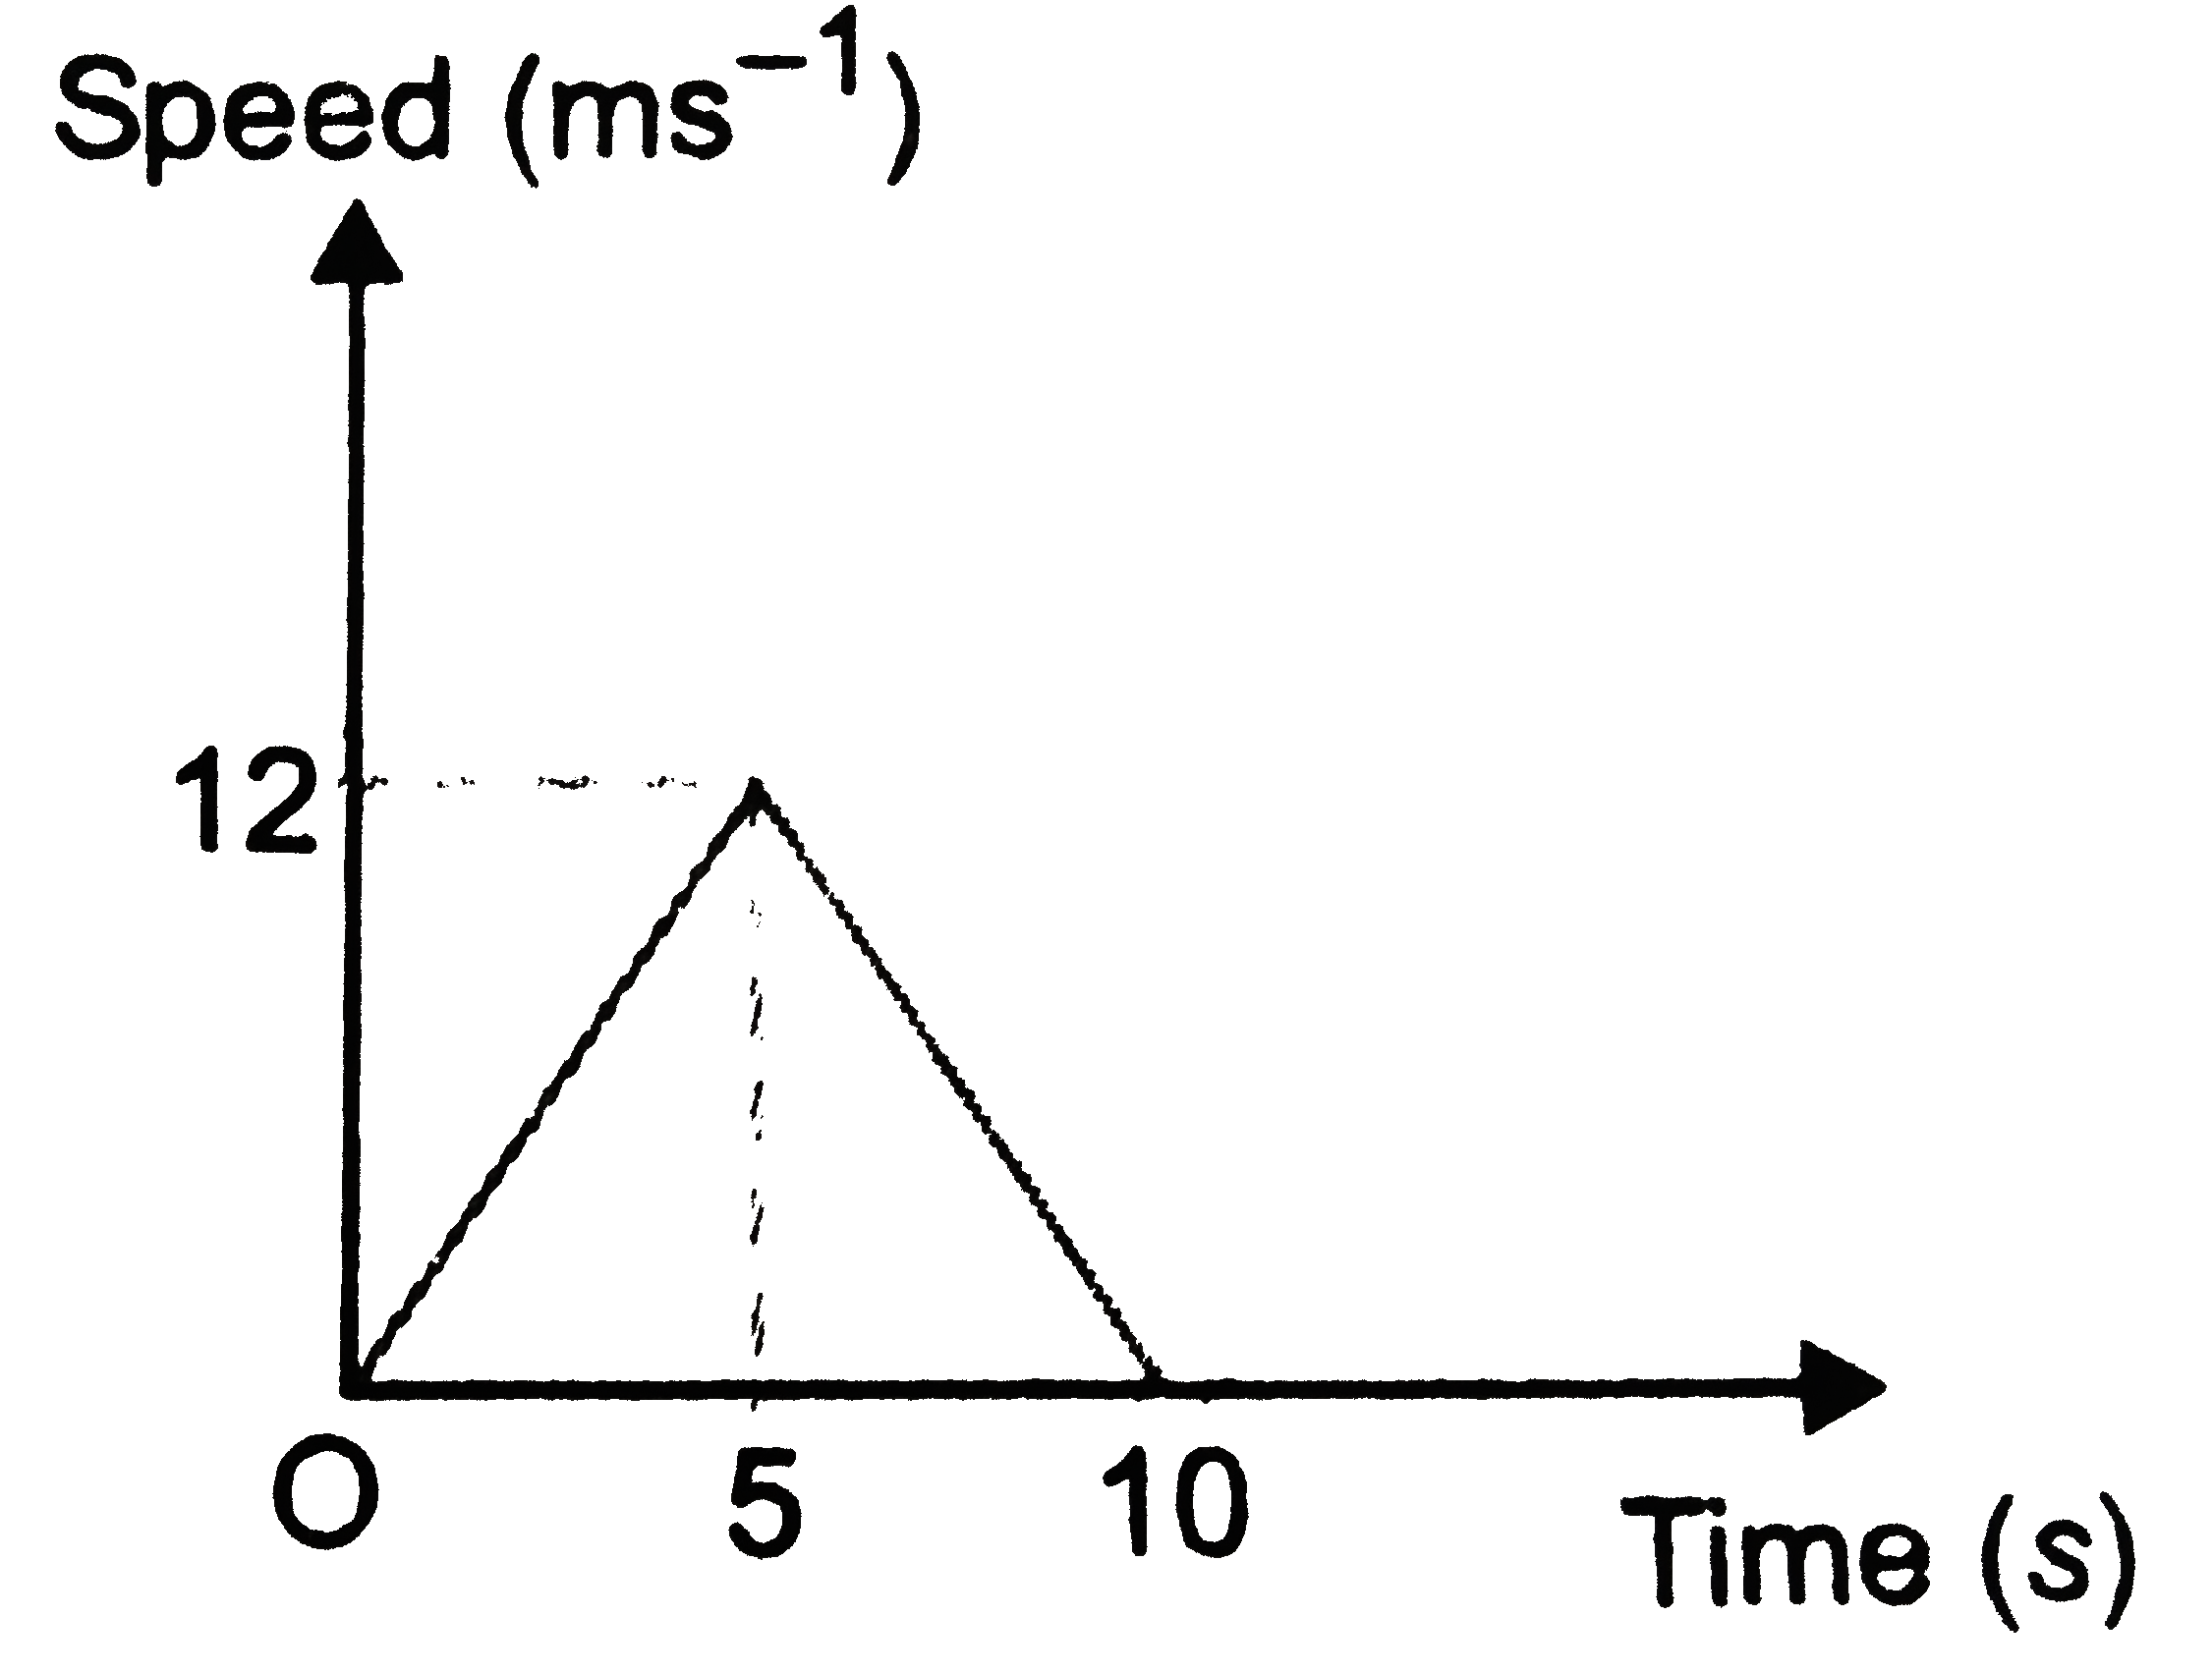 .
what is the average speed of the particle over the intervals?
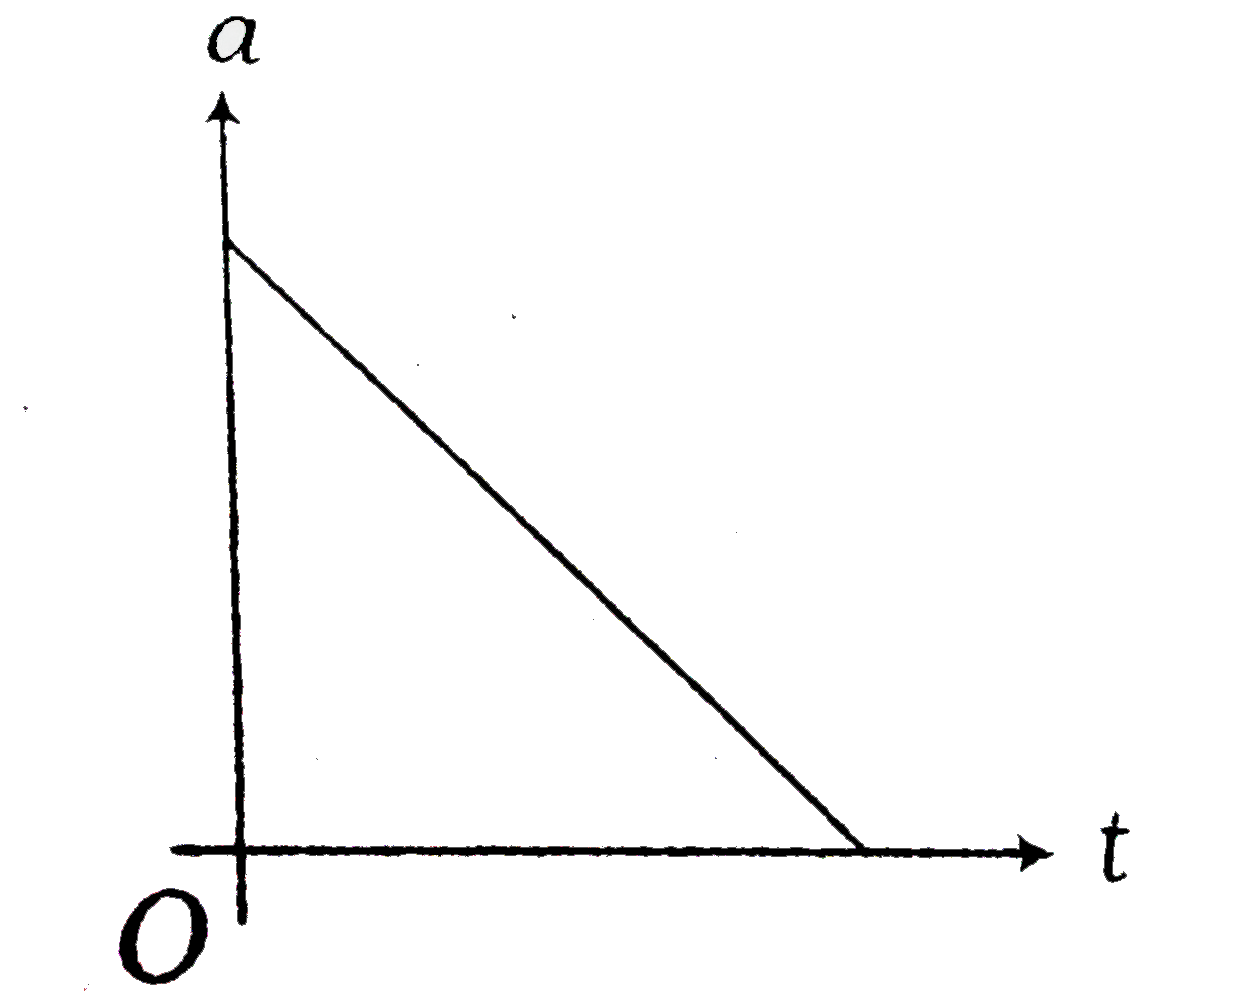
View SolutionThe acceleration (a)-time(t) graph for a particle moving along a straight from rest is shown in figur. Which of the following graph is the best representation of its velocity (v) with time (t) ?
View Solution
Knowledge Check
The speed-time graph of a particle moving along a fixed direction as shown in the figure. The distance traversed by the particle between t = 0 s to t = 10 s is
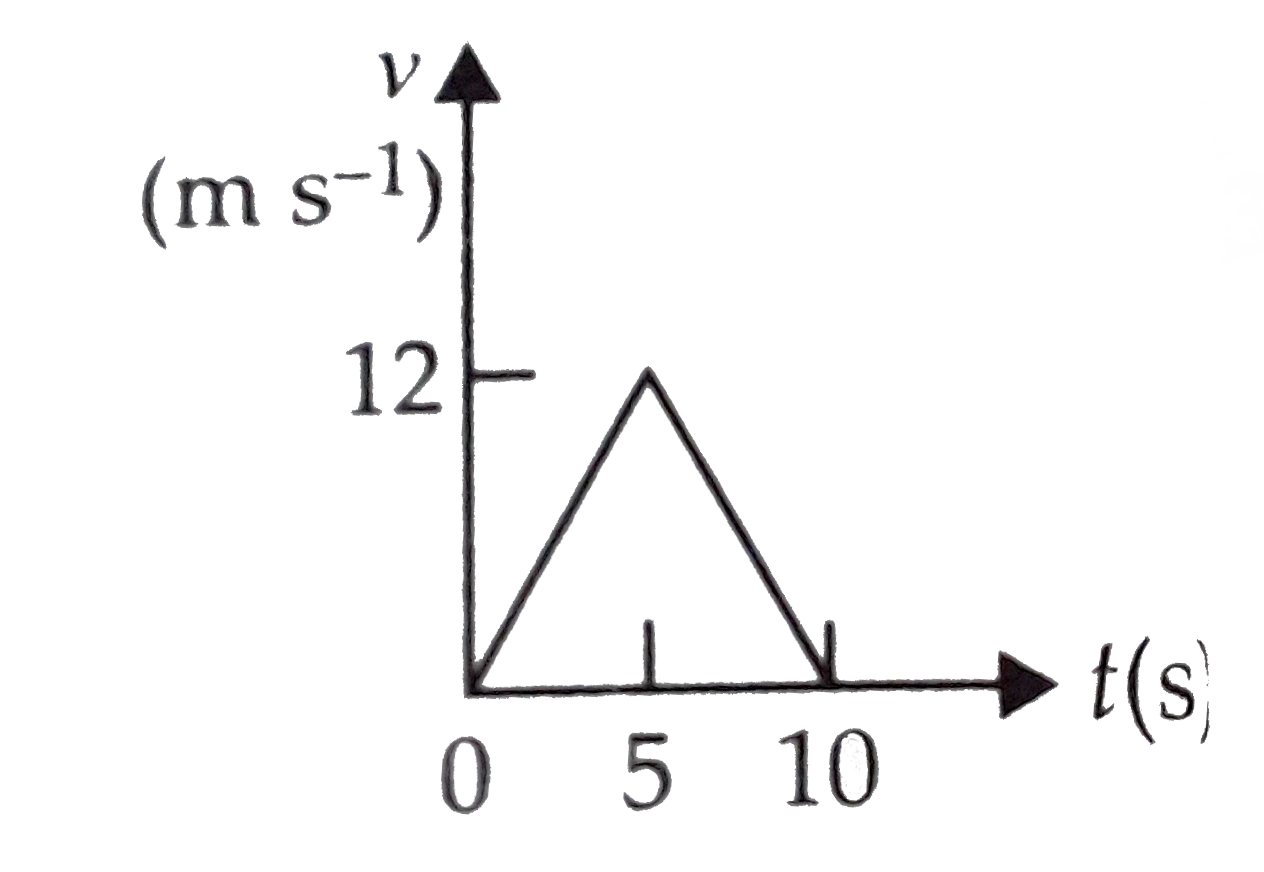 A20 mB40 mC60 mD80 m
The speed-time graph of a particle moving along a fixed direction is shown in the Fig. 2 (CF) . 15. The distance traversed by the particle between t=2s and 6s is .
 .A1. 26 mB2. 36 mC3. 46 mD4. 56 m
The acceleration (a)-time(t) graph for a particle moving along a straight from rest is shown in figure. Which of the following graph is the best representation of its velocity (v) with time (t) ?

View SolutionDisplacement time graph of a particle moving in a straight line is a shown in figure.

View SolutionThe x-t graph of a particle moving along a straight line is shown in figure
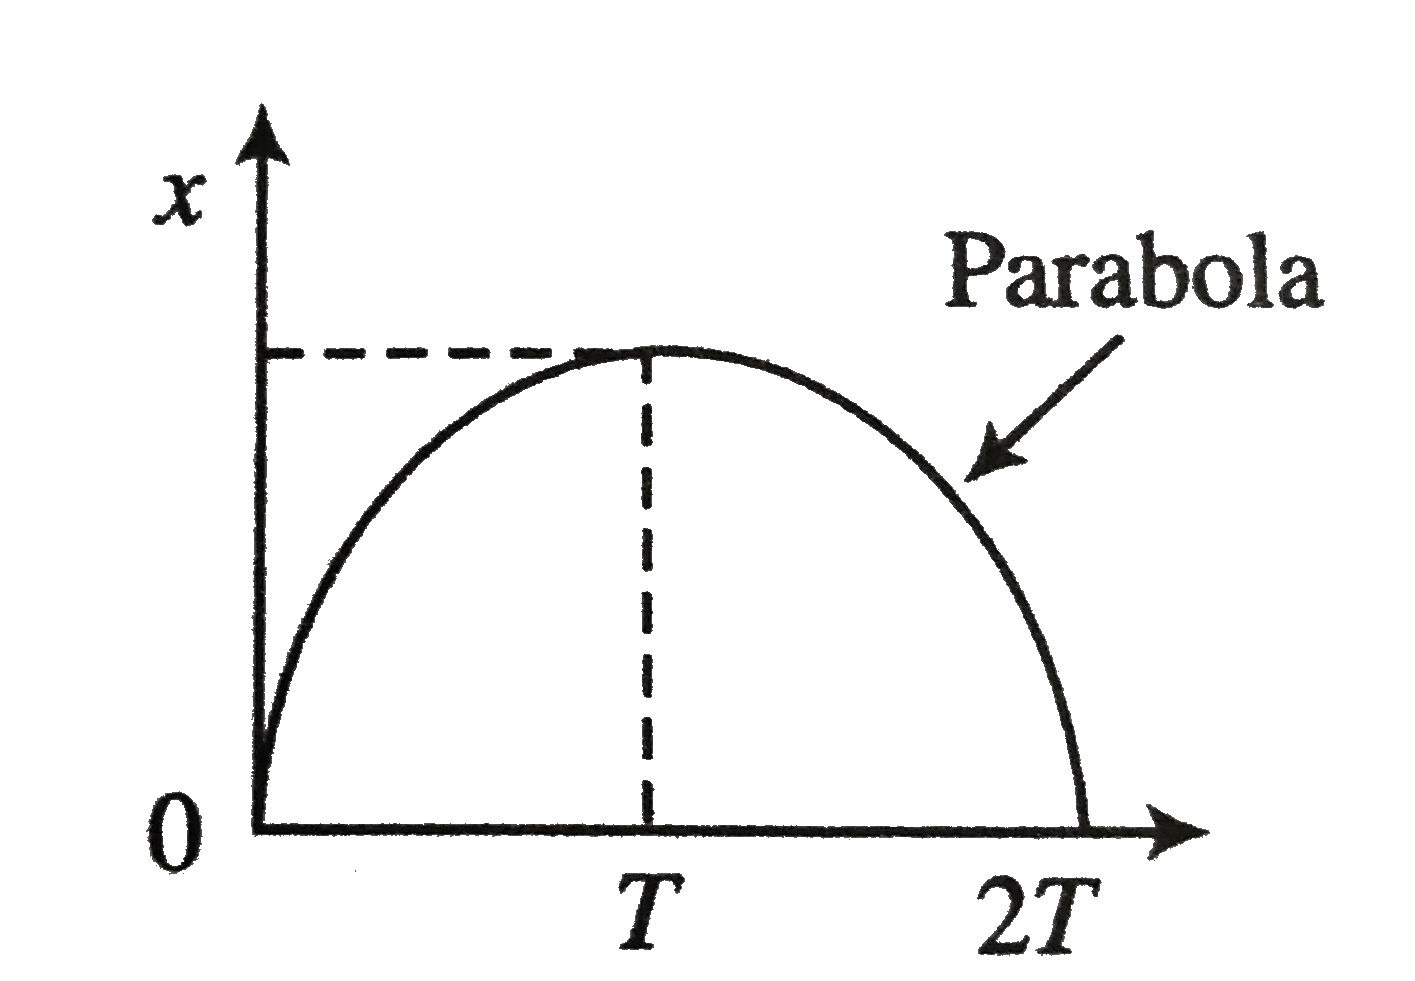
The speed-time graph of the particle is correctly shown by
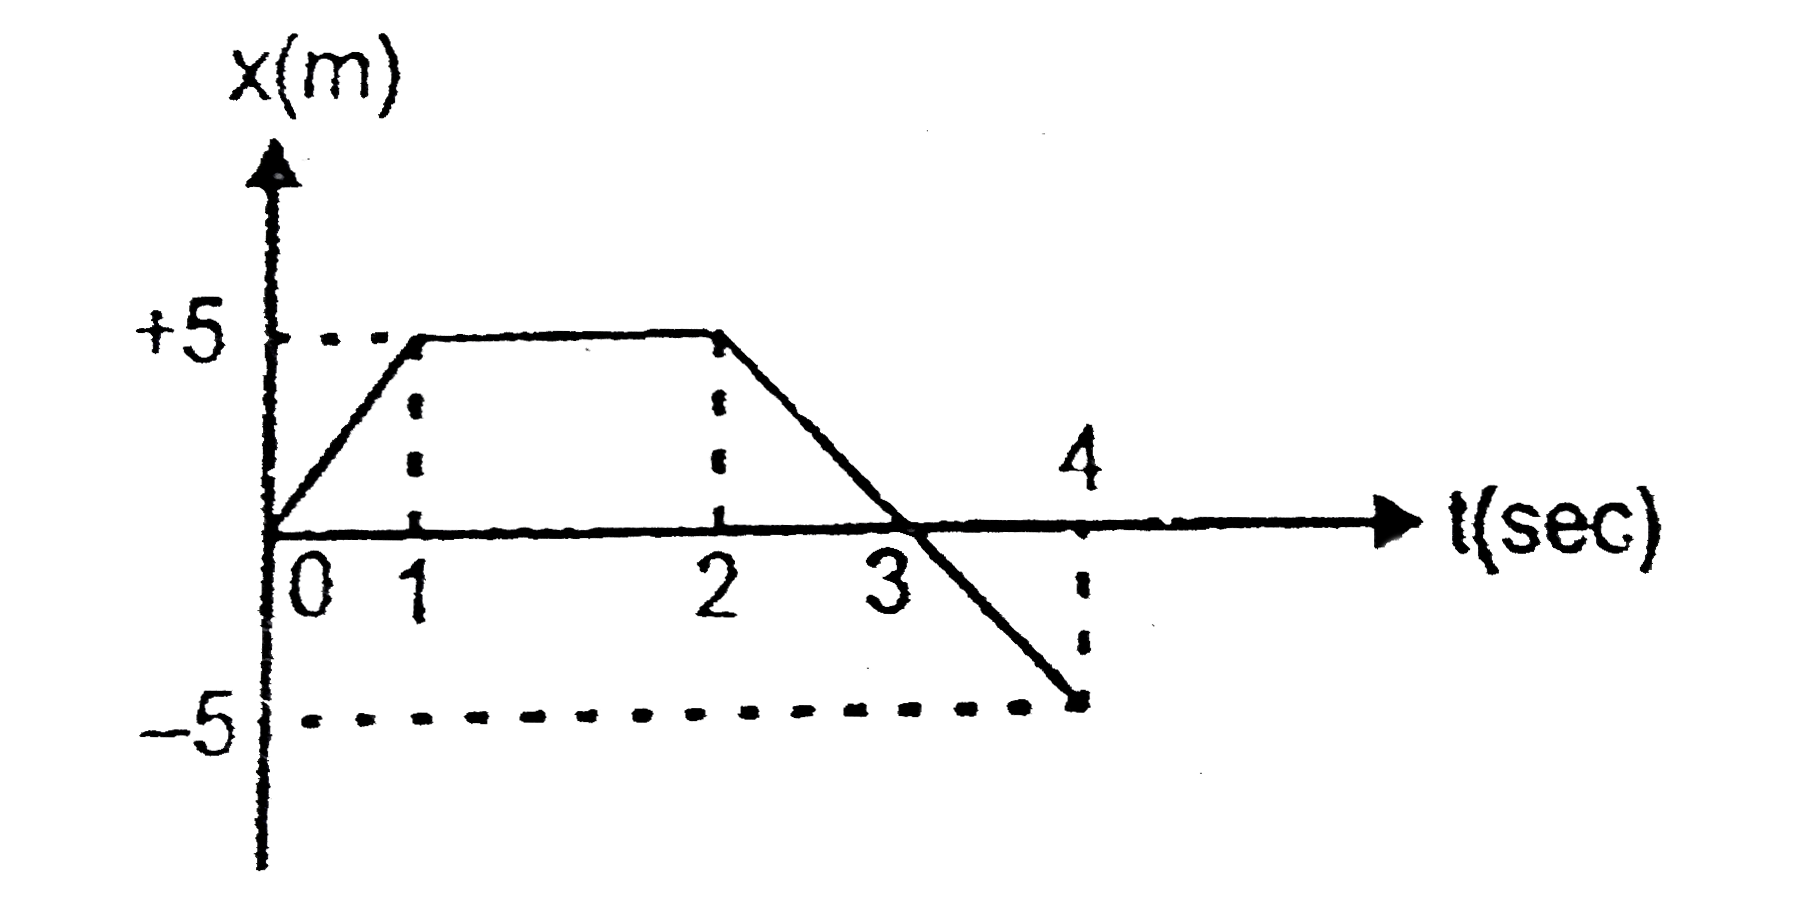
View SolutionPosition-time graph for a particle moving along x− direction is as shown in the figure. Average speed of the particle from t=0 to t=4 is :
View SolutionThe force acting on a particle moving along a straight line varies with time as shown in diagram.
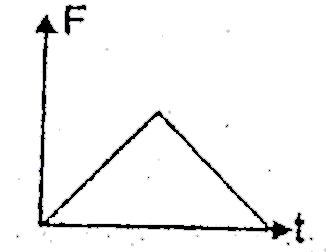
Which of the following graphs is best representative of its speed and time graphs. Initial velocity the particle is zero.
View SolutionThe force acting on a particle moving along a straight line varies with time as shown in diagram.

Which of the following graphs is best representative of its speed and time graphs. Initial velocity the particle is zero.
View Solution
