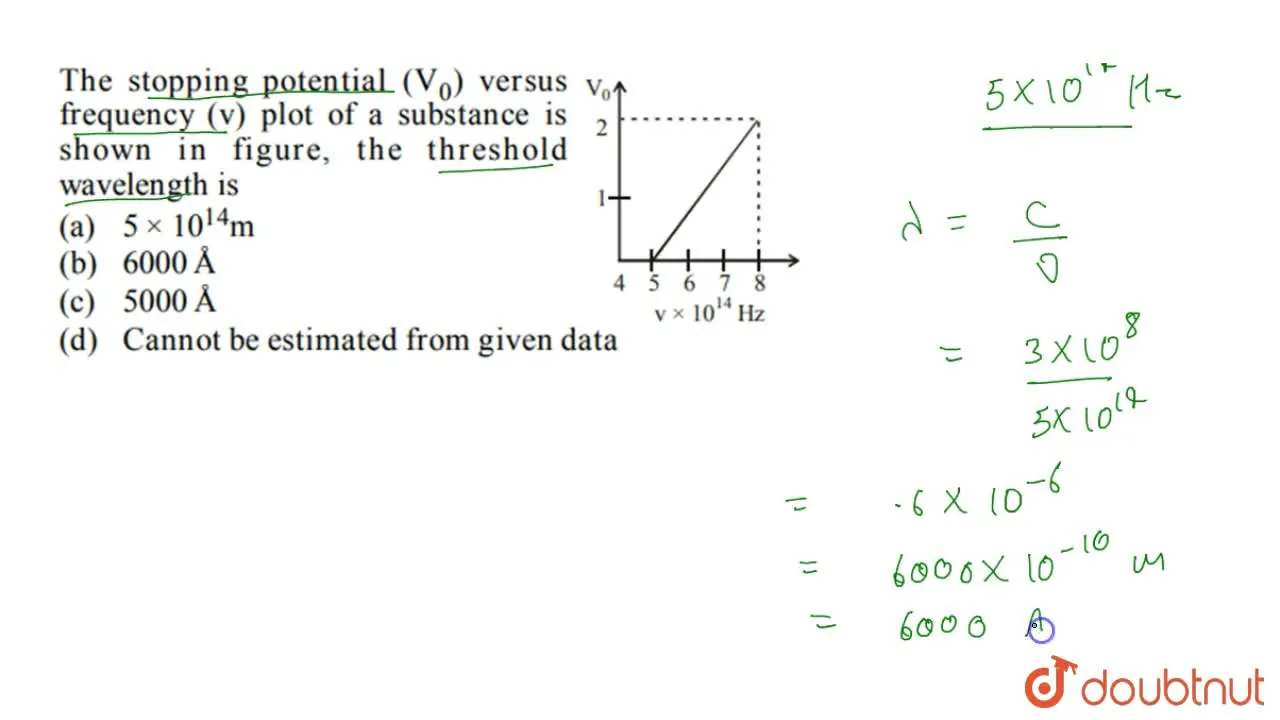
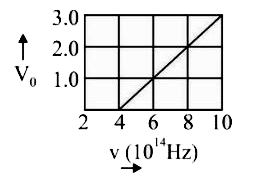
The stopping potential (V0) versus frequency (v) plot of a substance is shown in figure, the threshold wavelength is
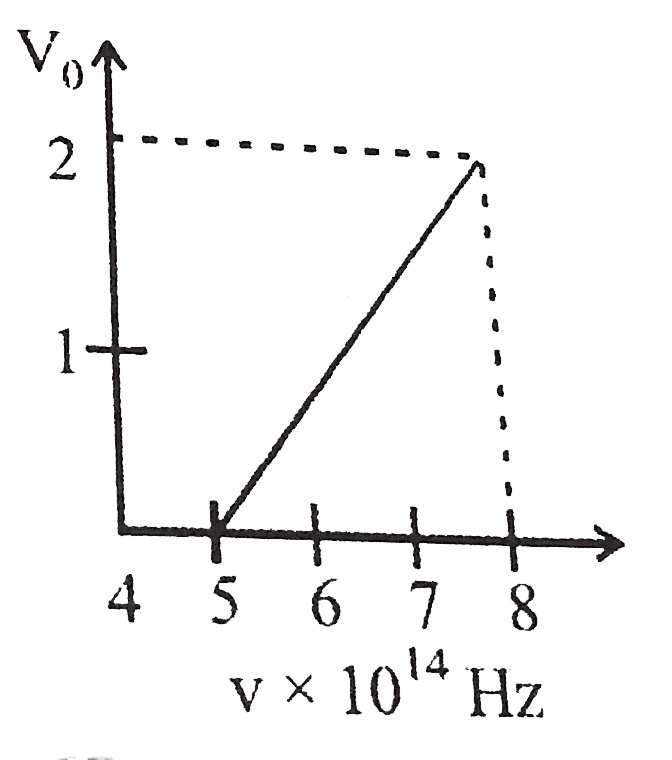
5×10¹⁴m
6000 Å
5000 Å
cannot be estimated from given data
Step by step video & image solution for The stopping potential (V_(0)) versus frequency (v) plot of a substance is shown in figure, the threshold wavelength is by Physics experts to help you in doubts & scoring excellent marks in Class 11 exams.
Related Playlists
Similar Questions
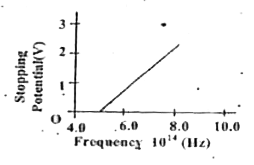
The stopping potential vs frequency plot for a substance is shown in the figure. The work function of the substance is
 View Solution
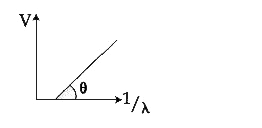
In a photoelectric effect experiment, the graph of stopping potential V versus reciprocal of wavelength obtained is shown in the figure. As the intensity of incident radiation is increased :
 View Solution
The stopping potential V0 (in volt) as a function of frequency (v) for a sodium emitter, is shown in the figure. The work function of sodium, from the data plotted in the figure, will be:
(Given : Planck’s constant)
(h)=6.63×10⁻³⁴Js electron charge e=1.6×10⁻¹⁹C)
 View Solution
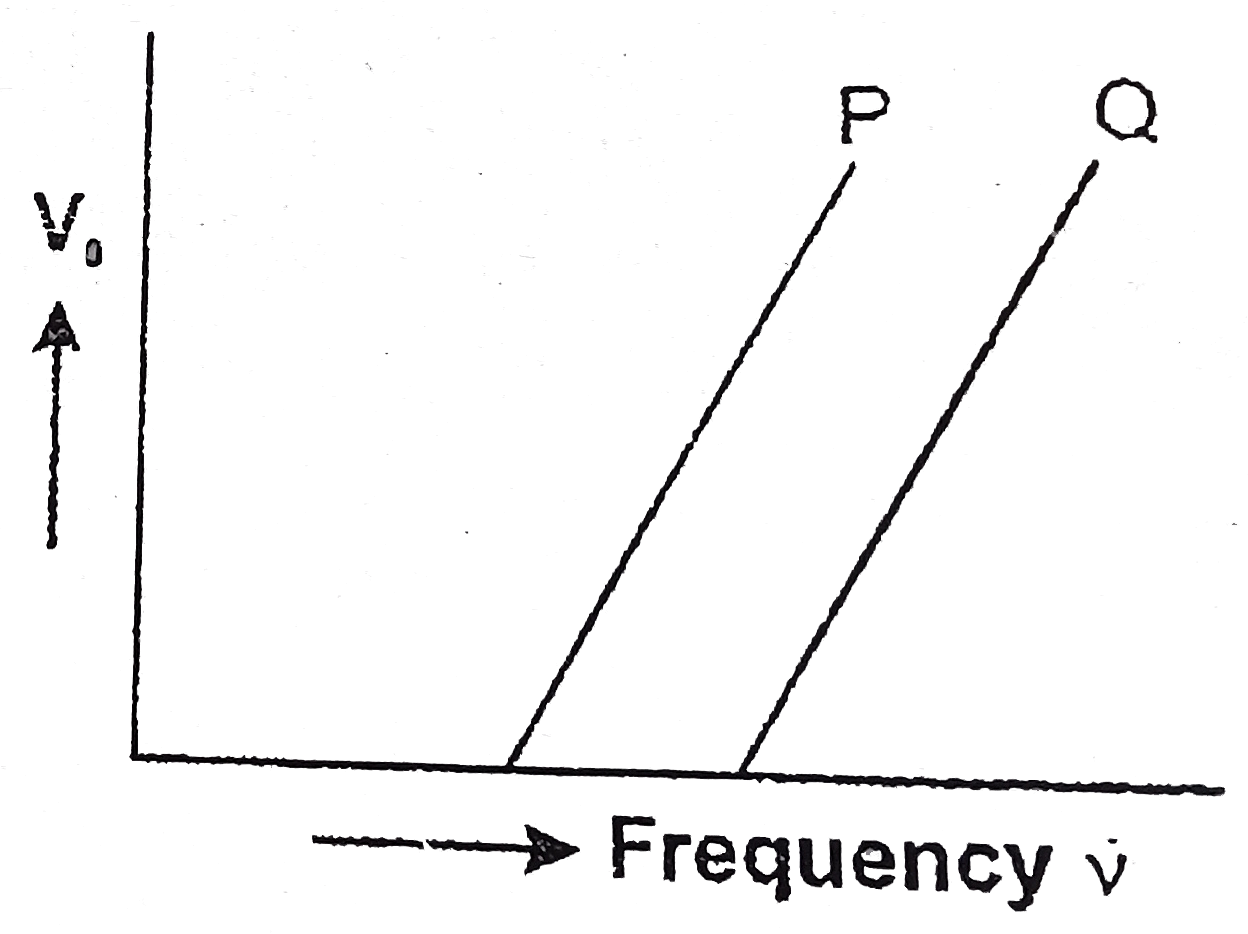
The graph between the stopping potential V0 and frequency v for two different metal plates P and Q are shown in the figure. Which of the metals has greater threshold wavelength and work function.
 View Solution
When a metal is illuminated by light of wavelength λ , the stopping potential is V∘ and for wavelength 2λ, it is 3V∘.Then the threshold wavelength is ?
View SolutionPlot a graph showing variation of stopping potential (V0) with the frequency (v) of the incident radiation for a given photosensitive material. Hence, state the significance of the threshold frequency in photoelectric emission.
Using the principle of energy conservation, write the equation relating the energy of incident photon, threshold frequency and the maximum kinetic energy of the emitted photoelectrons.View SolutionThe figure shows different graphs between stopping potential (V0) and frequency (v) for photosensitive surface of cesium , potassium , sodium and lithium. The plots are parallel. Correct ranking of the targets according to their work function greatest first will be
 View Solution
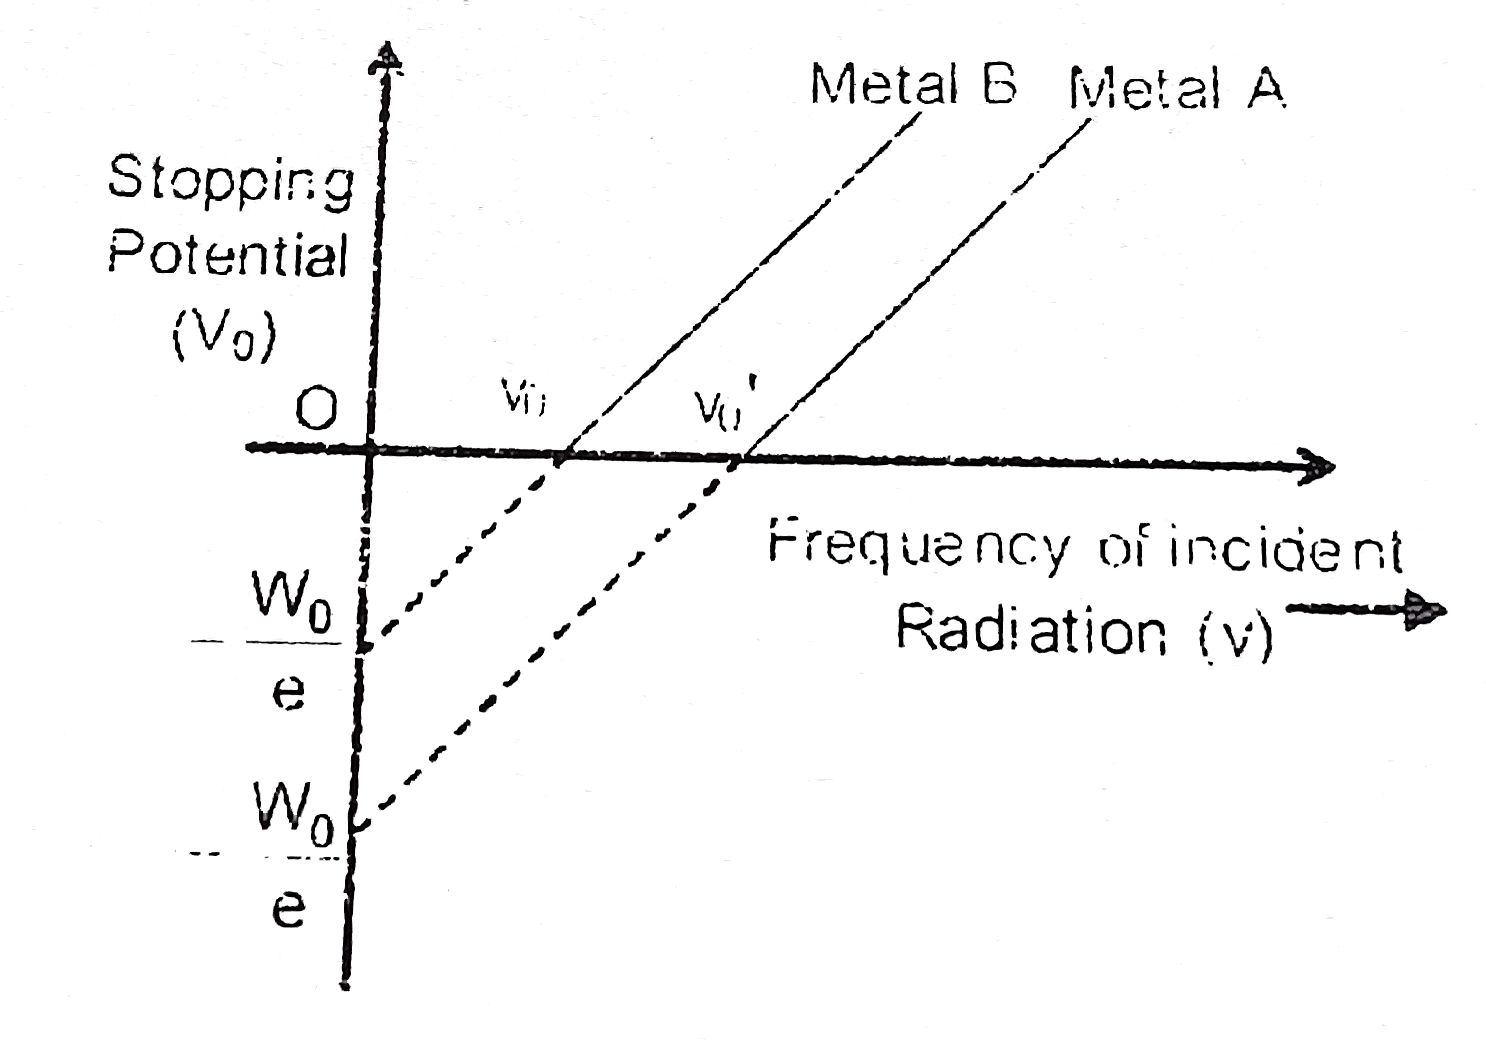
The graph shows variation of stopping potential V0 versus frequency of incident radiation v for two photosensitive metals A and B. Which of two metals has higher threshold frequency and why?
 View Solution
Draw a graph between stopping potential and the frequency of two metals A and B having threshold frequencies v0and2v0 .
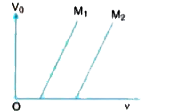
View SolutionThe variation of the stopping potential (V0) with the frequency (v) of the light incident on two different photosensitive surfaces M1andM2 is shown in the figure. Identify the surfaces which has greater value of the work function.
 View Solution

