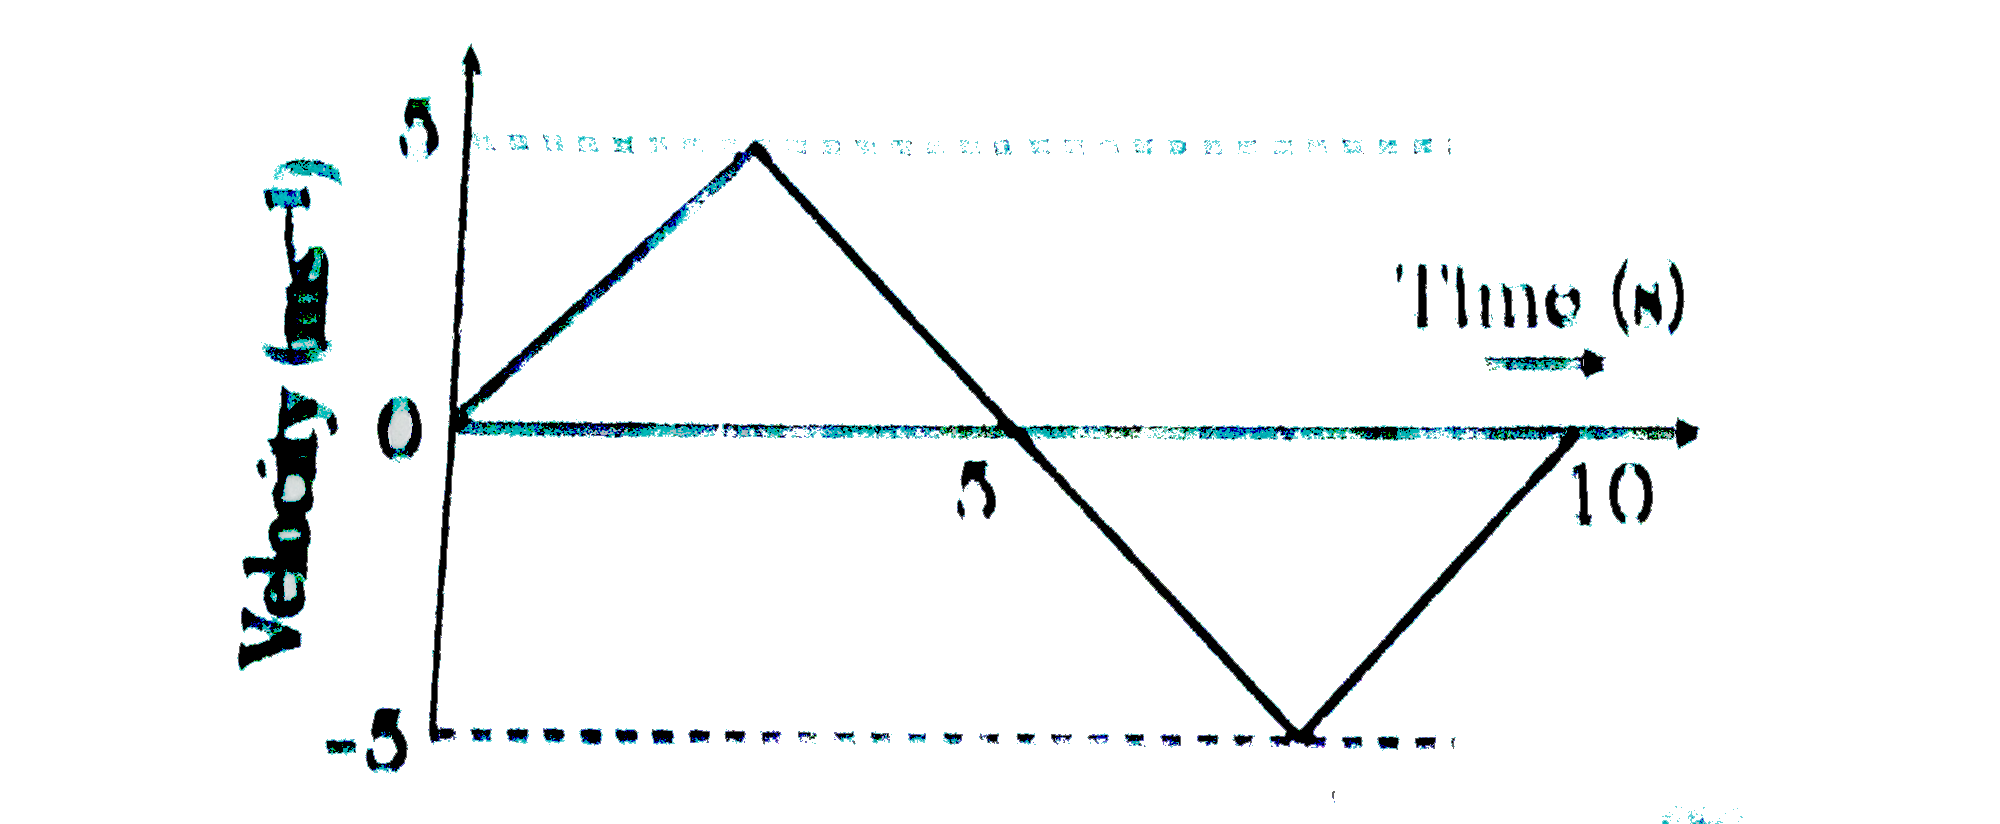
The v-t plot of a moving object ios shown in the figure. The average velocity of the object during the first 10 s is
zero
2.5ms−1
5ms−1
2ms−1
The correct Answer is:A
Since, total displacement is zero, hence average velocity is also zero.
Topper's Solved these Questions
- MOTION IN A PLANEBOOK - DC PANDEYCHAPTER - MOTION IN A PLANEEXERCISE - Check point 3.7
15 Videos
- MOTION IN A PLANEBOOK - DC PANDEYCHAPTER - MOTION IN A PLANEEXERCISE - (A) Taking it together
75 Videos
- MOTION IN A PLANEBOOK - DC PANDEYCHAPTER - MOTION IN A PLANEEXERCISE - Check point 3.5
25 Videos
- MOTIONBOOK - DC PANDEYCHAPTER - MOTIONEXERCISE - Medical entrances gallery
19 Videos
- PROJECTILE MOTIONBOOK - DC PANDEYCHAPTER - PROJECTILE MOTIONEXERCISE - Level - 2 Subjective
10 Videos
Similar Questions
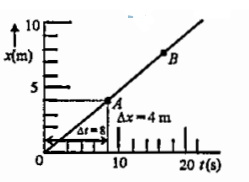
The graph of an object’s motion (along the x-axis) is shown in the figure.The instantaneous velocity of the object at points A and B arevA and vB respectively. Then
View SolutionThe v-t graph for a particle moving along x-axis is shown in the figure, find
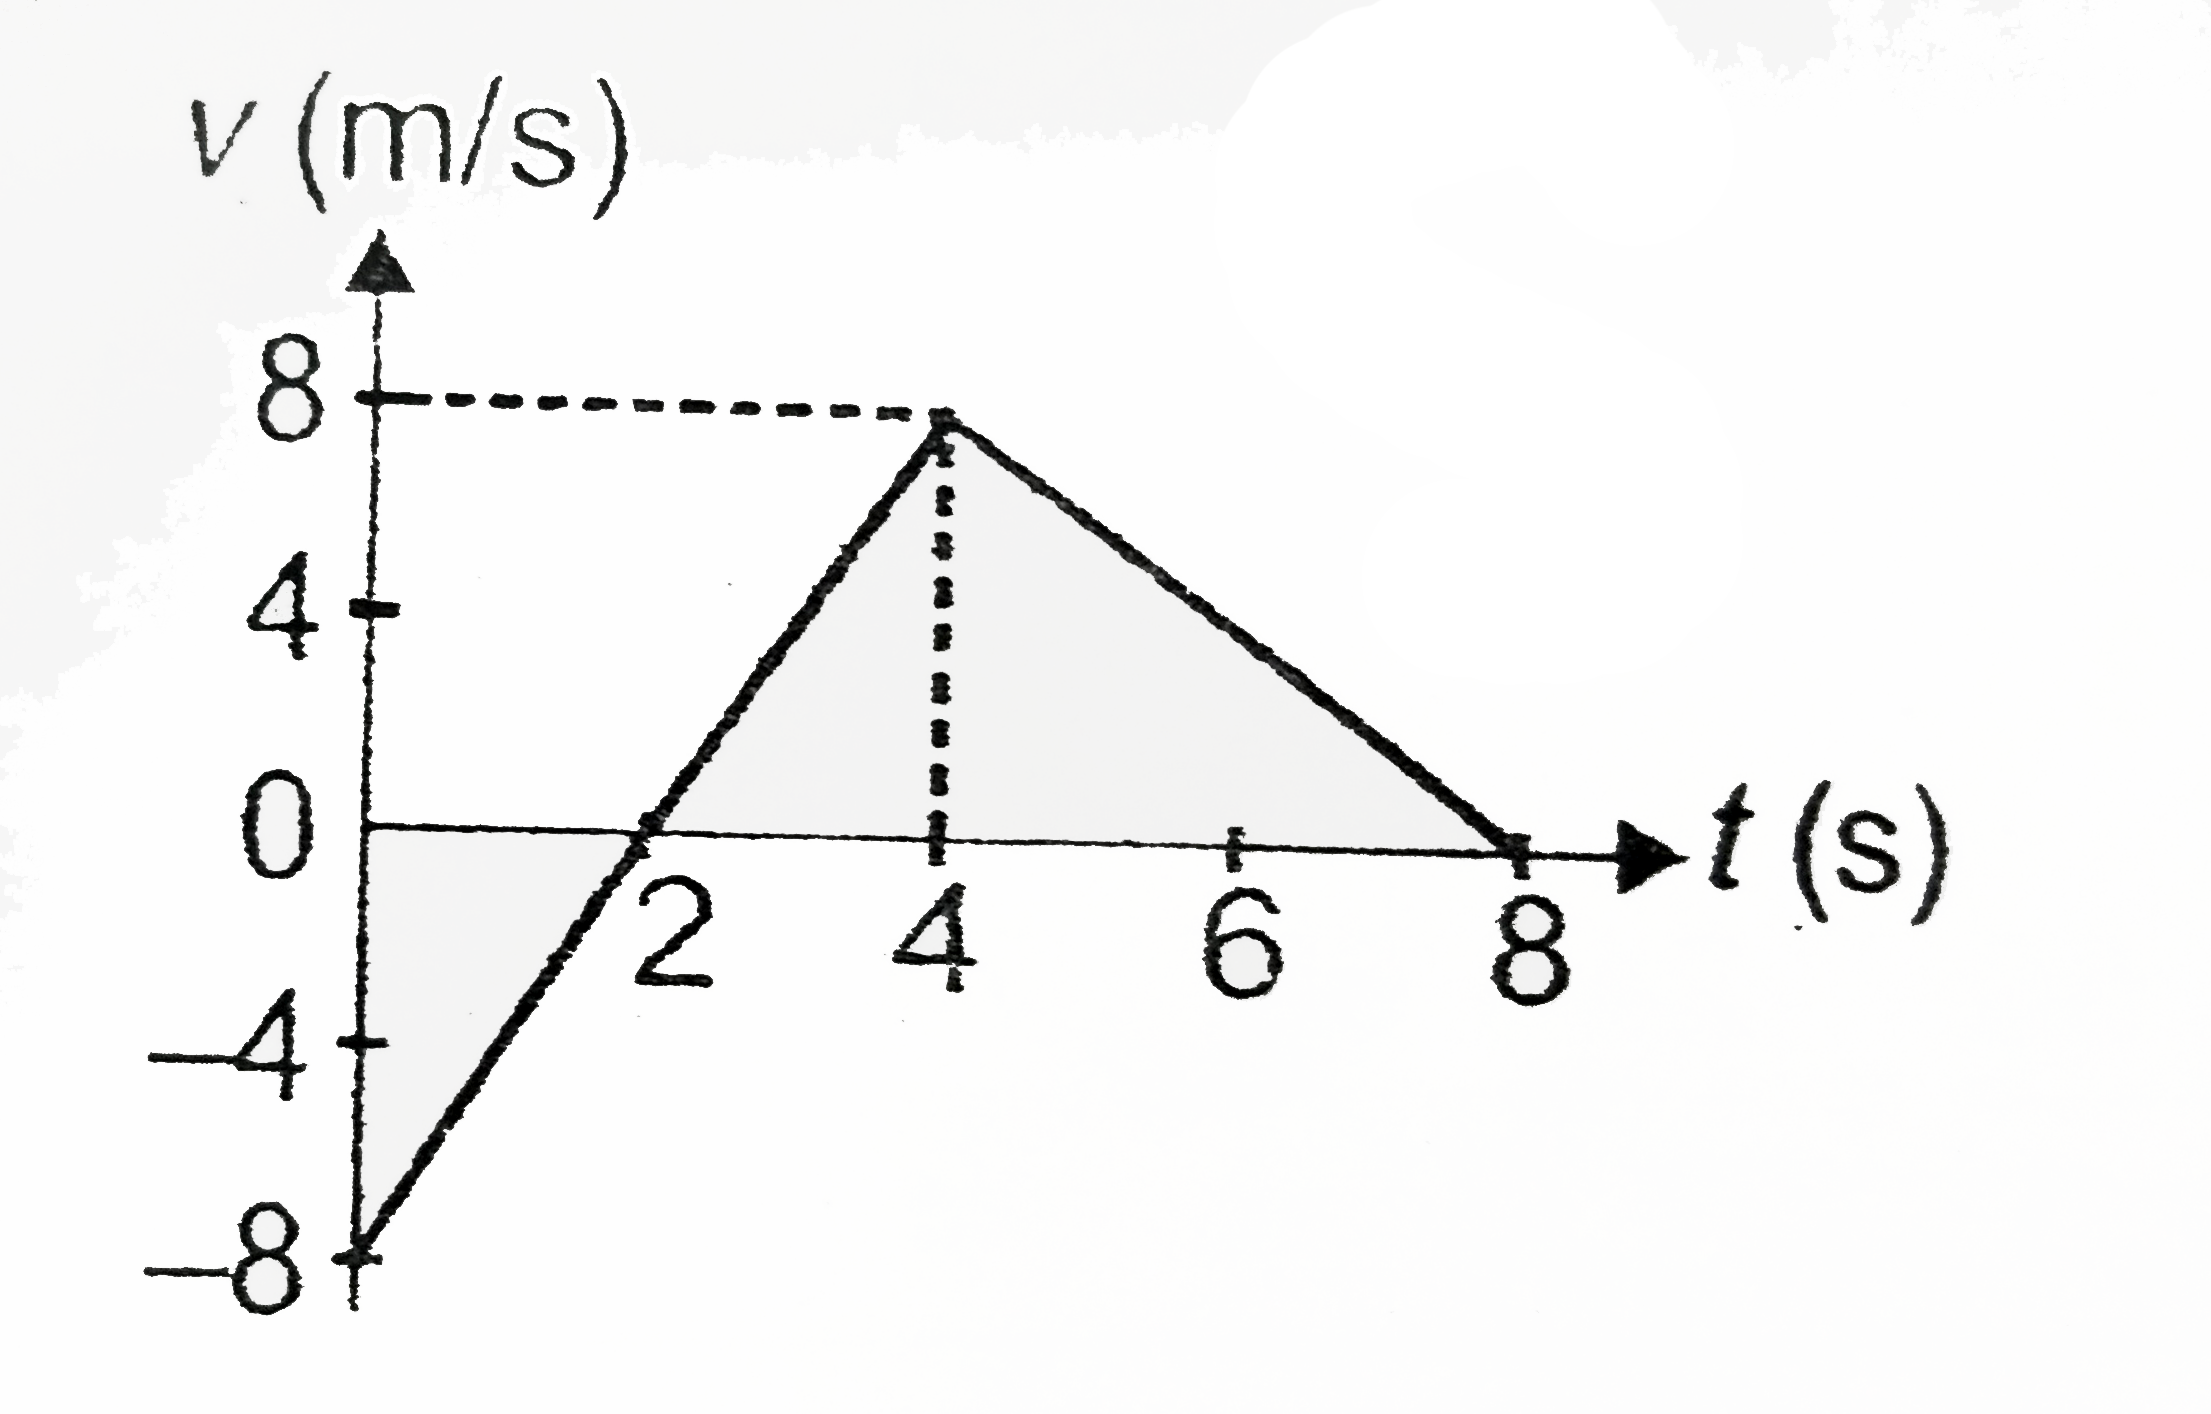
(a) Average velocity in the interval 0 to 8 s.
(b) Average speed in the interval 0 to 8 s.
(c) Average acceleration in the interval 0 to 4 s.
(d) Instantaneous acceleration at t = 2.5 s.
View Solution
Knowledge Check
Velocity-time graph for a moving object is shown in the figure. Total displacement of the object during the time interval when there is non-zero acceleration and retardation is.
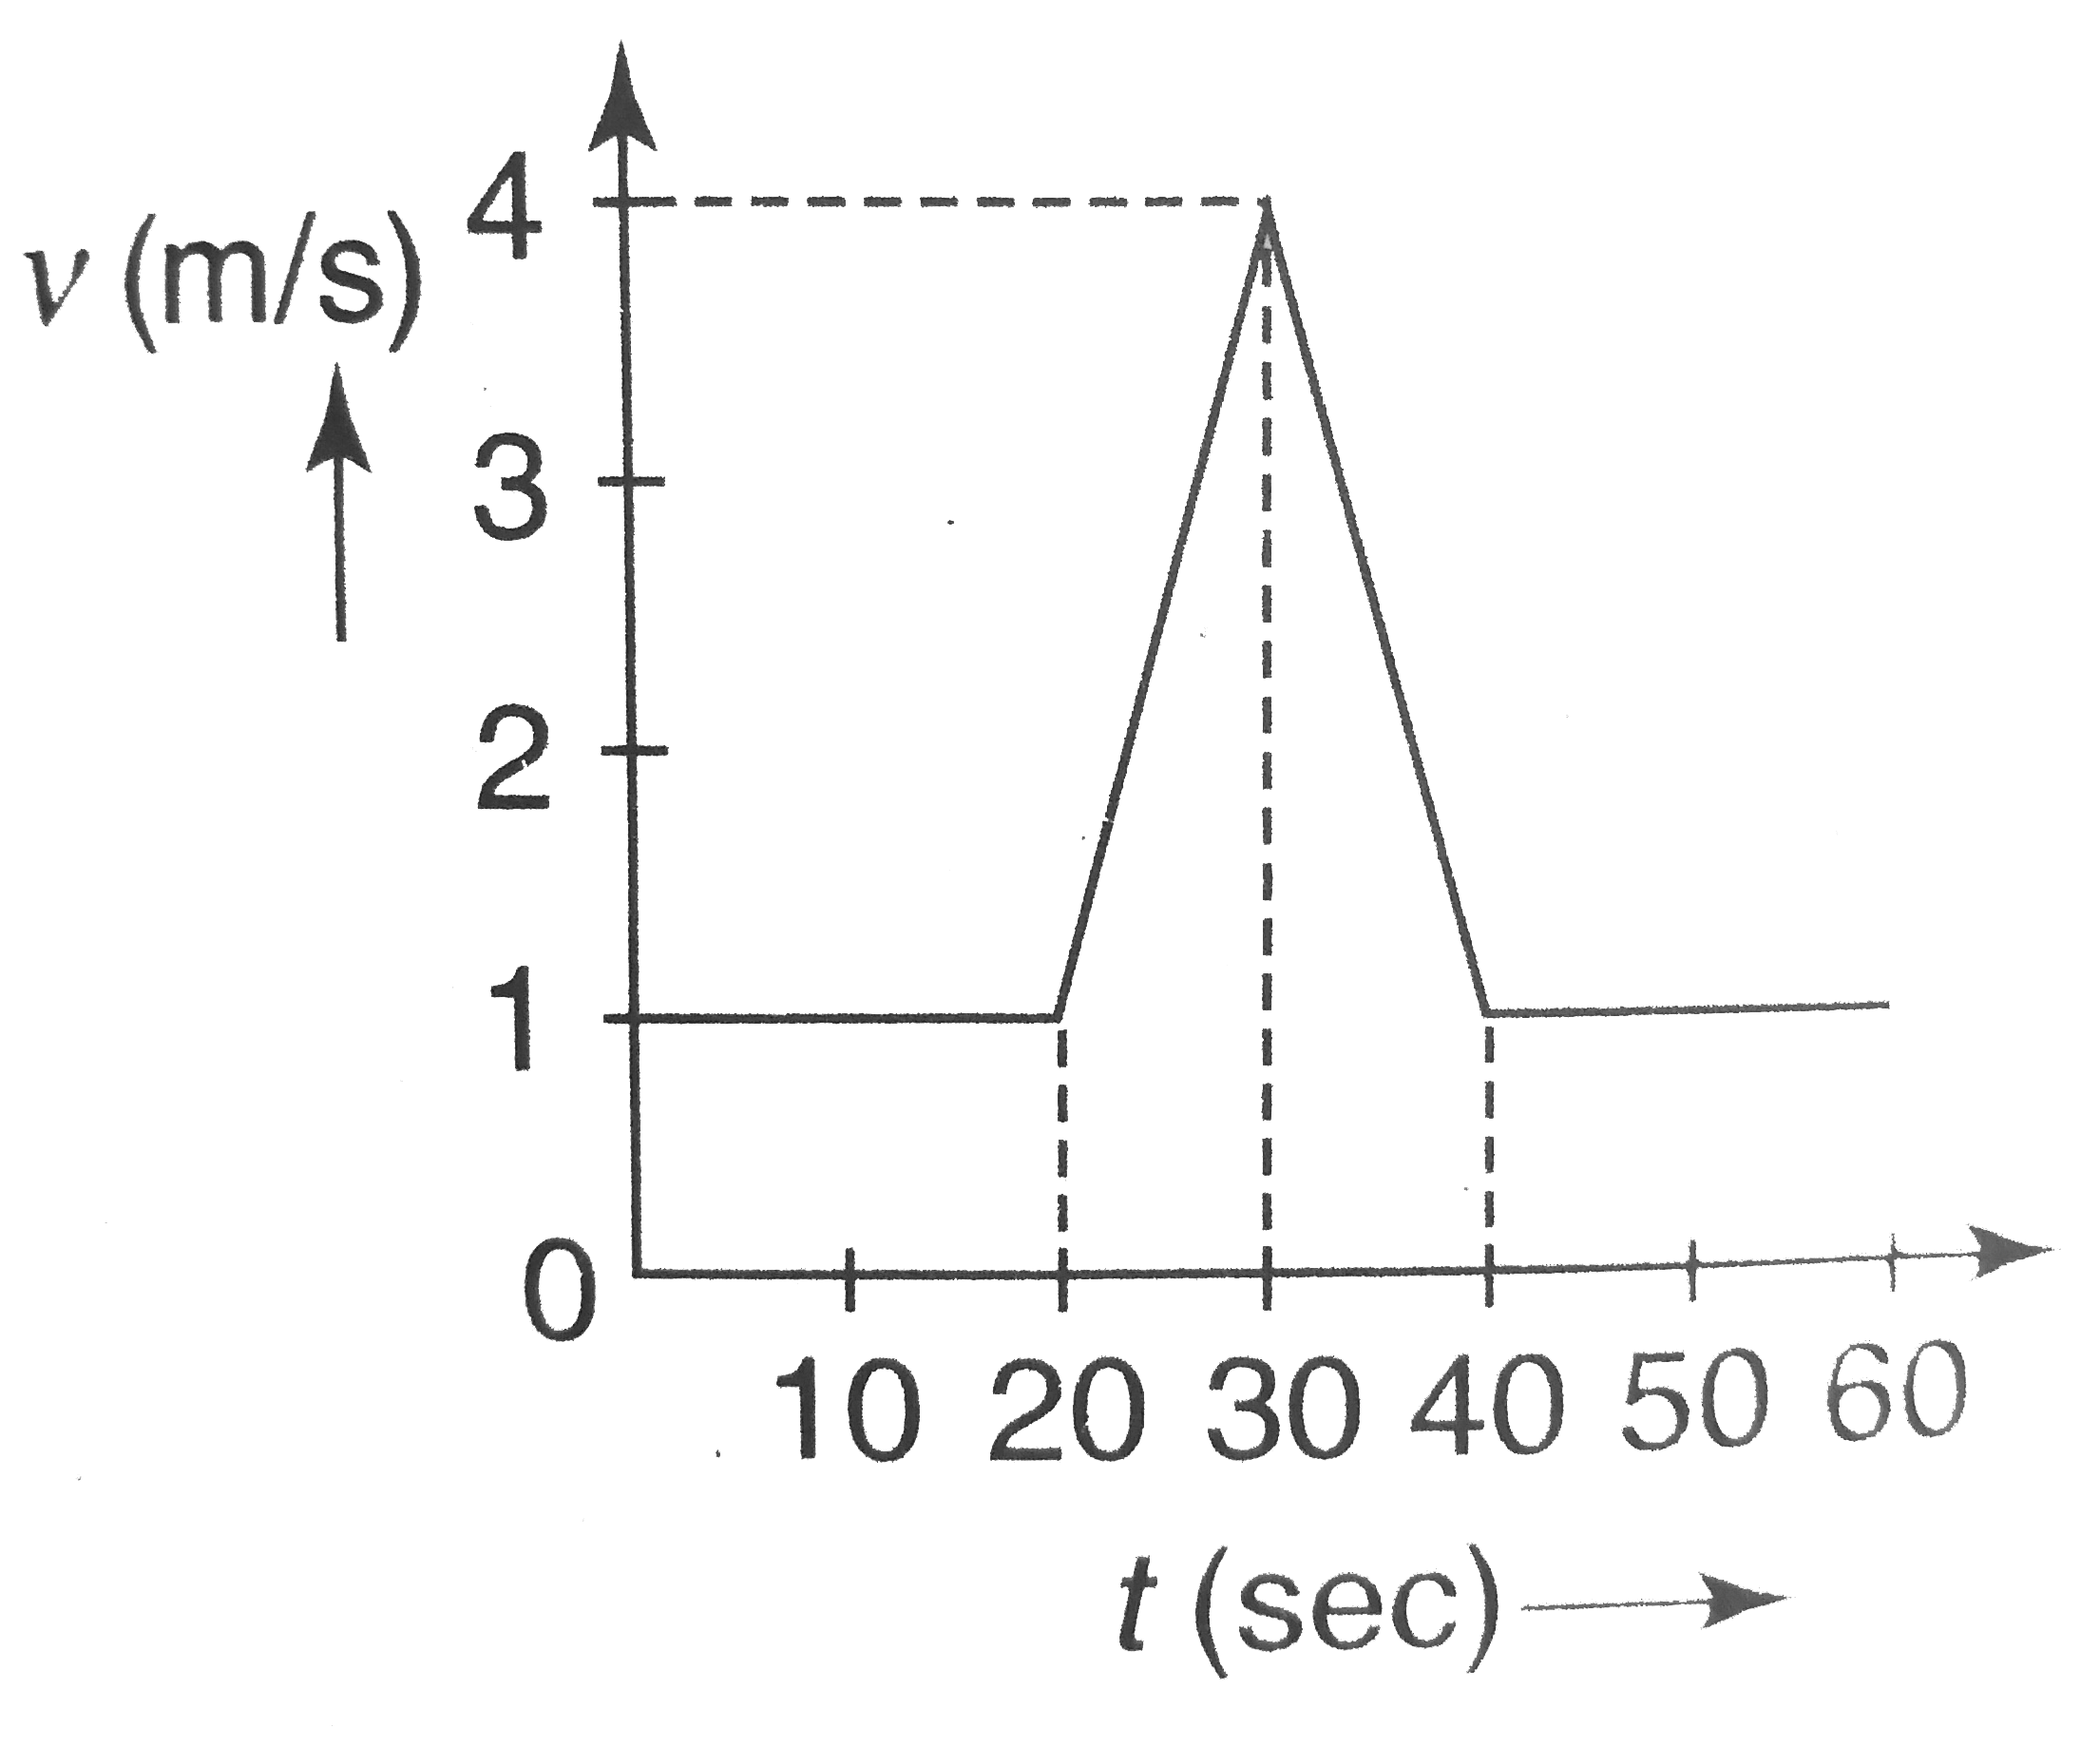 A60 mB50 mC30 mD40 m
The v−t graph of a moving object is given in figure. The maximum acceleration is
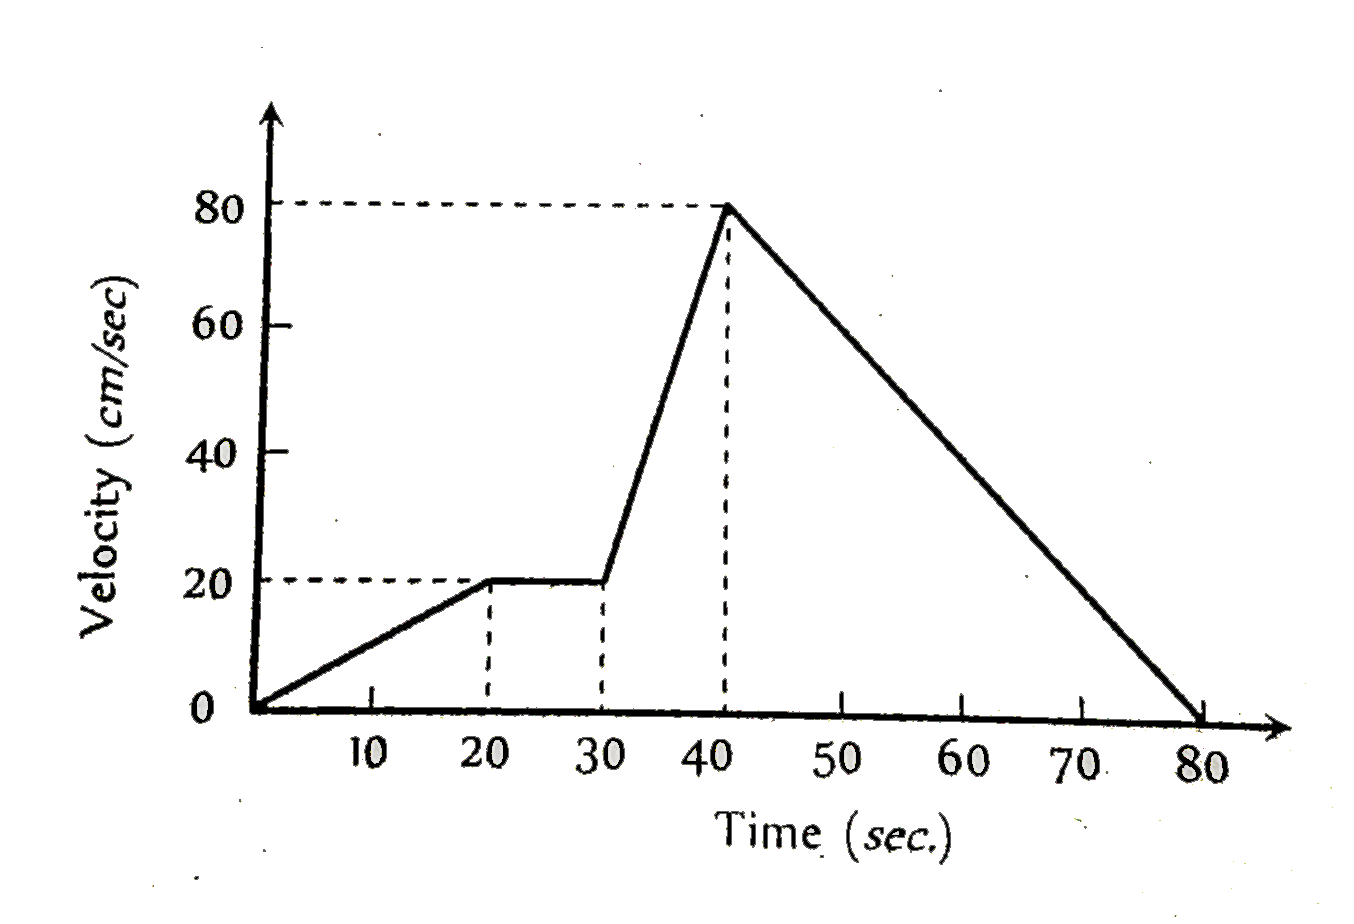 A1cm/secc2B2cm/sec2C3cm/sec2D6cm/sec2
The velocity-time graph of a car moving along a straight road is shown in figure. The average velocity of the car in first 25 seconds is
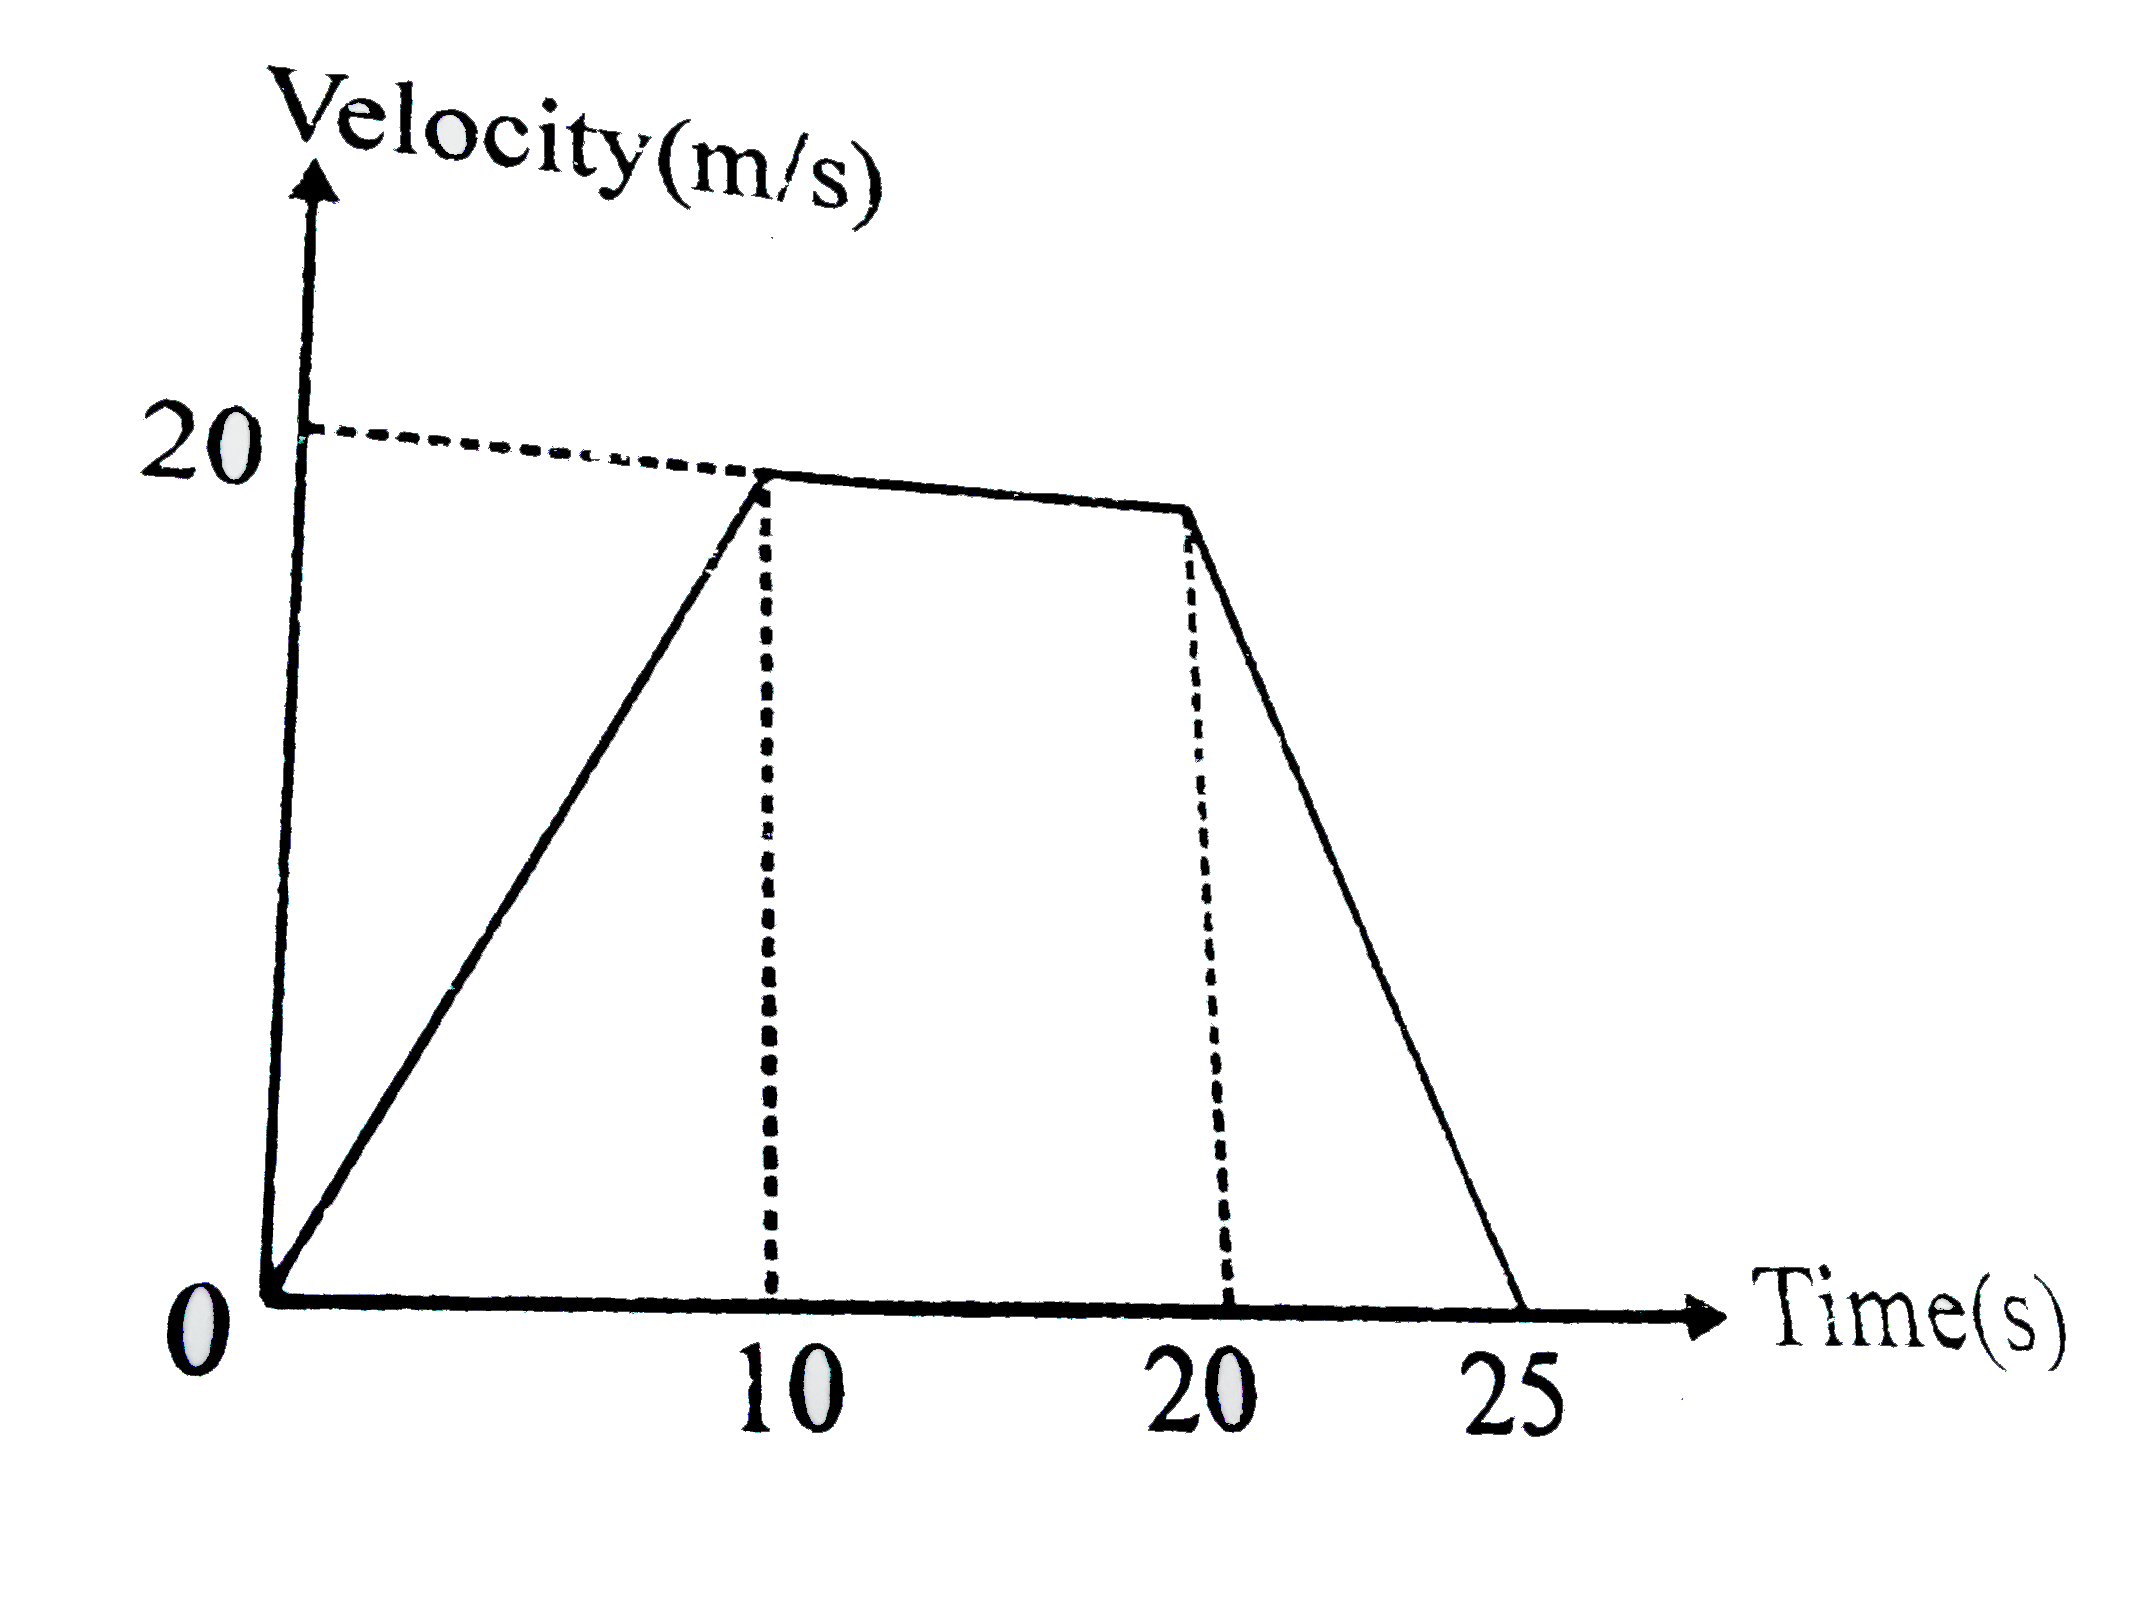 A20m/sB14m/sC10m/sD17.5m/s
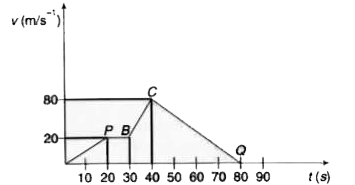
The v-t graph of a moving object is given in Figure. The maximum acceleration is
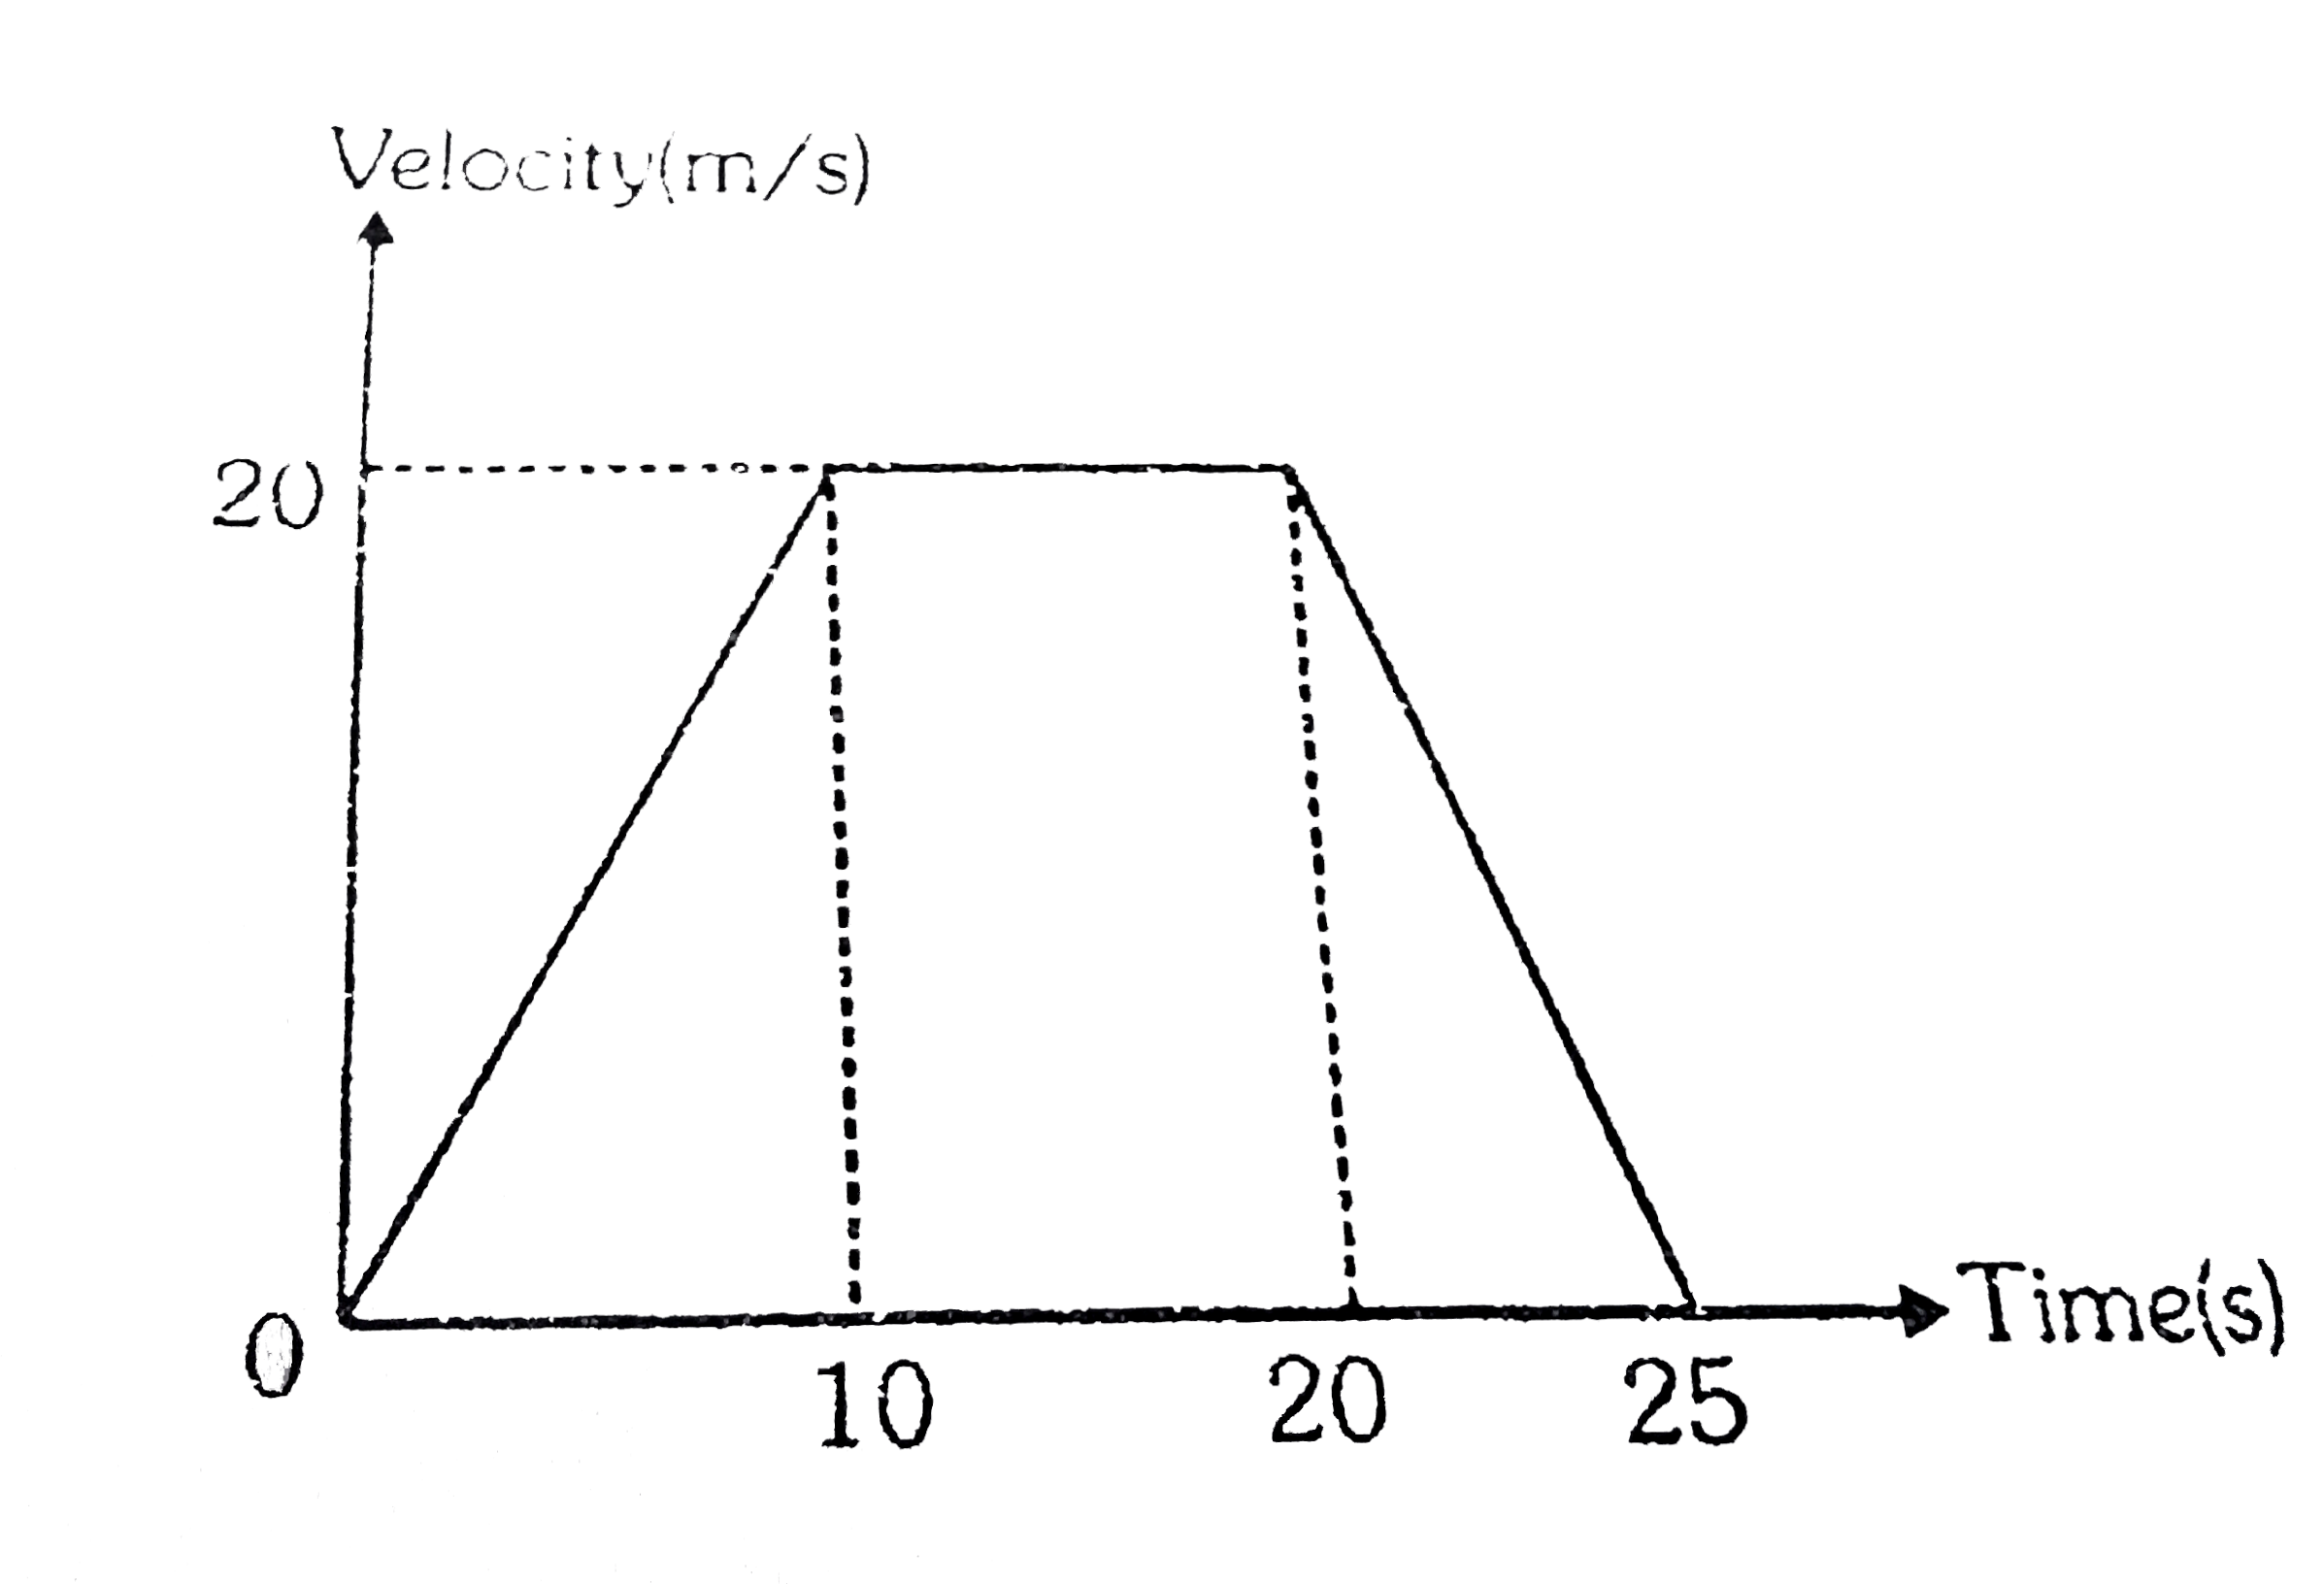
View SolutionThe velocity-time graph of a car moving along a straight road is shown in figure. The average velocity of the car is first 25 seconds is
View SolutionDistance versus time graph of an object is as shown in the figure. The average speed of the object is _____ ms−1
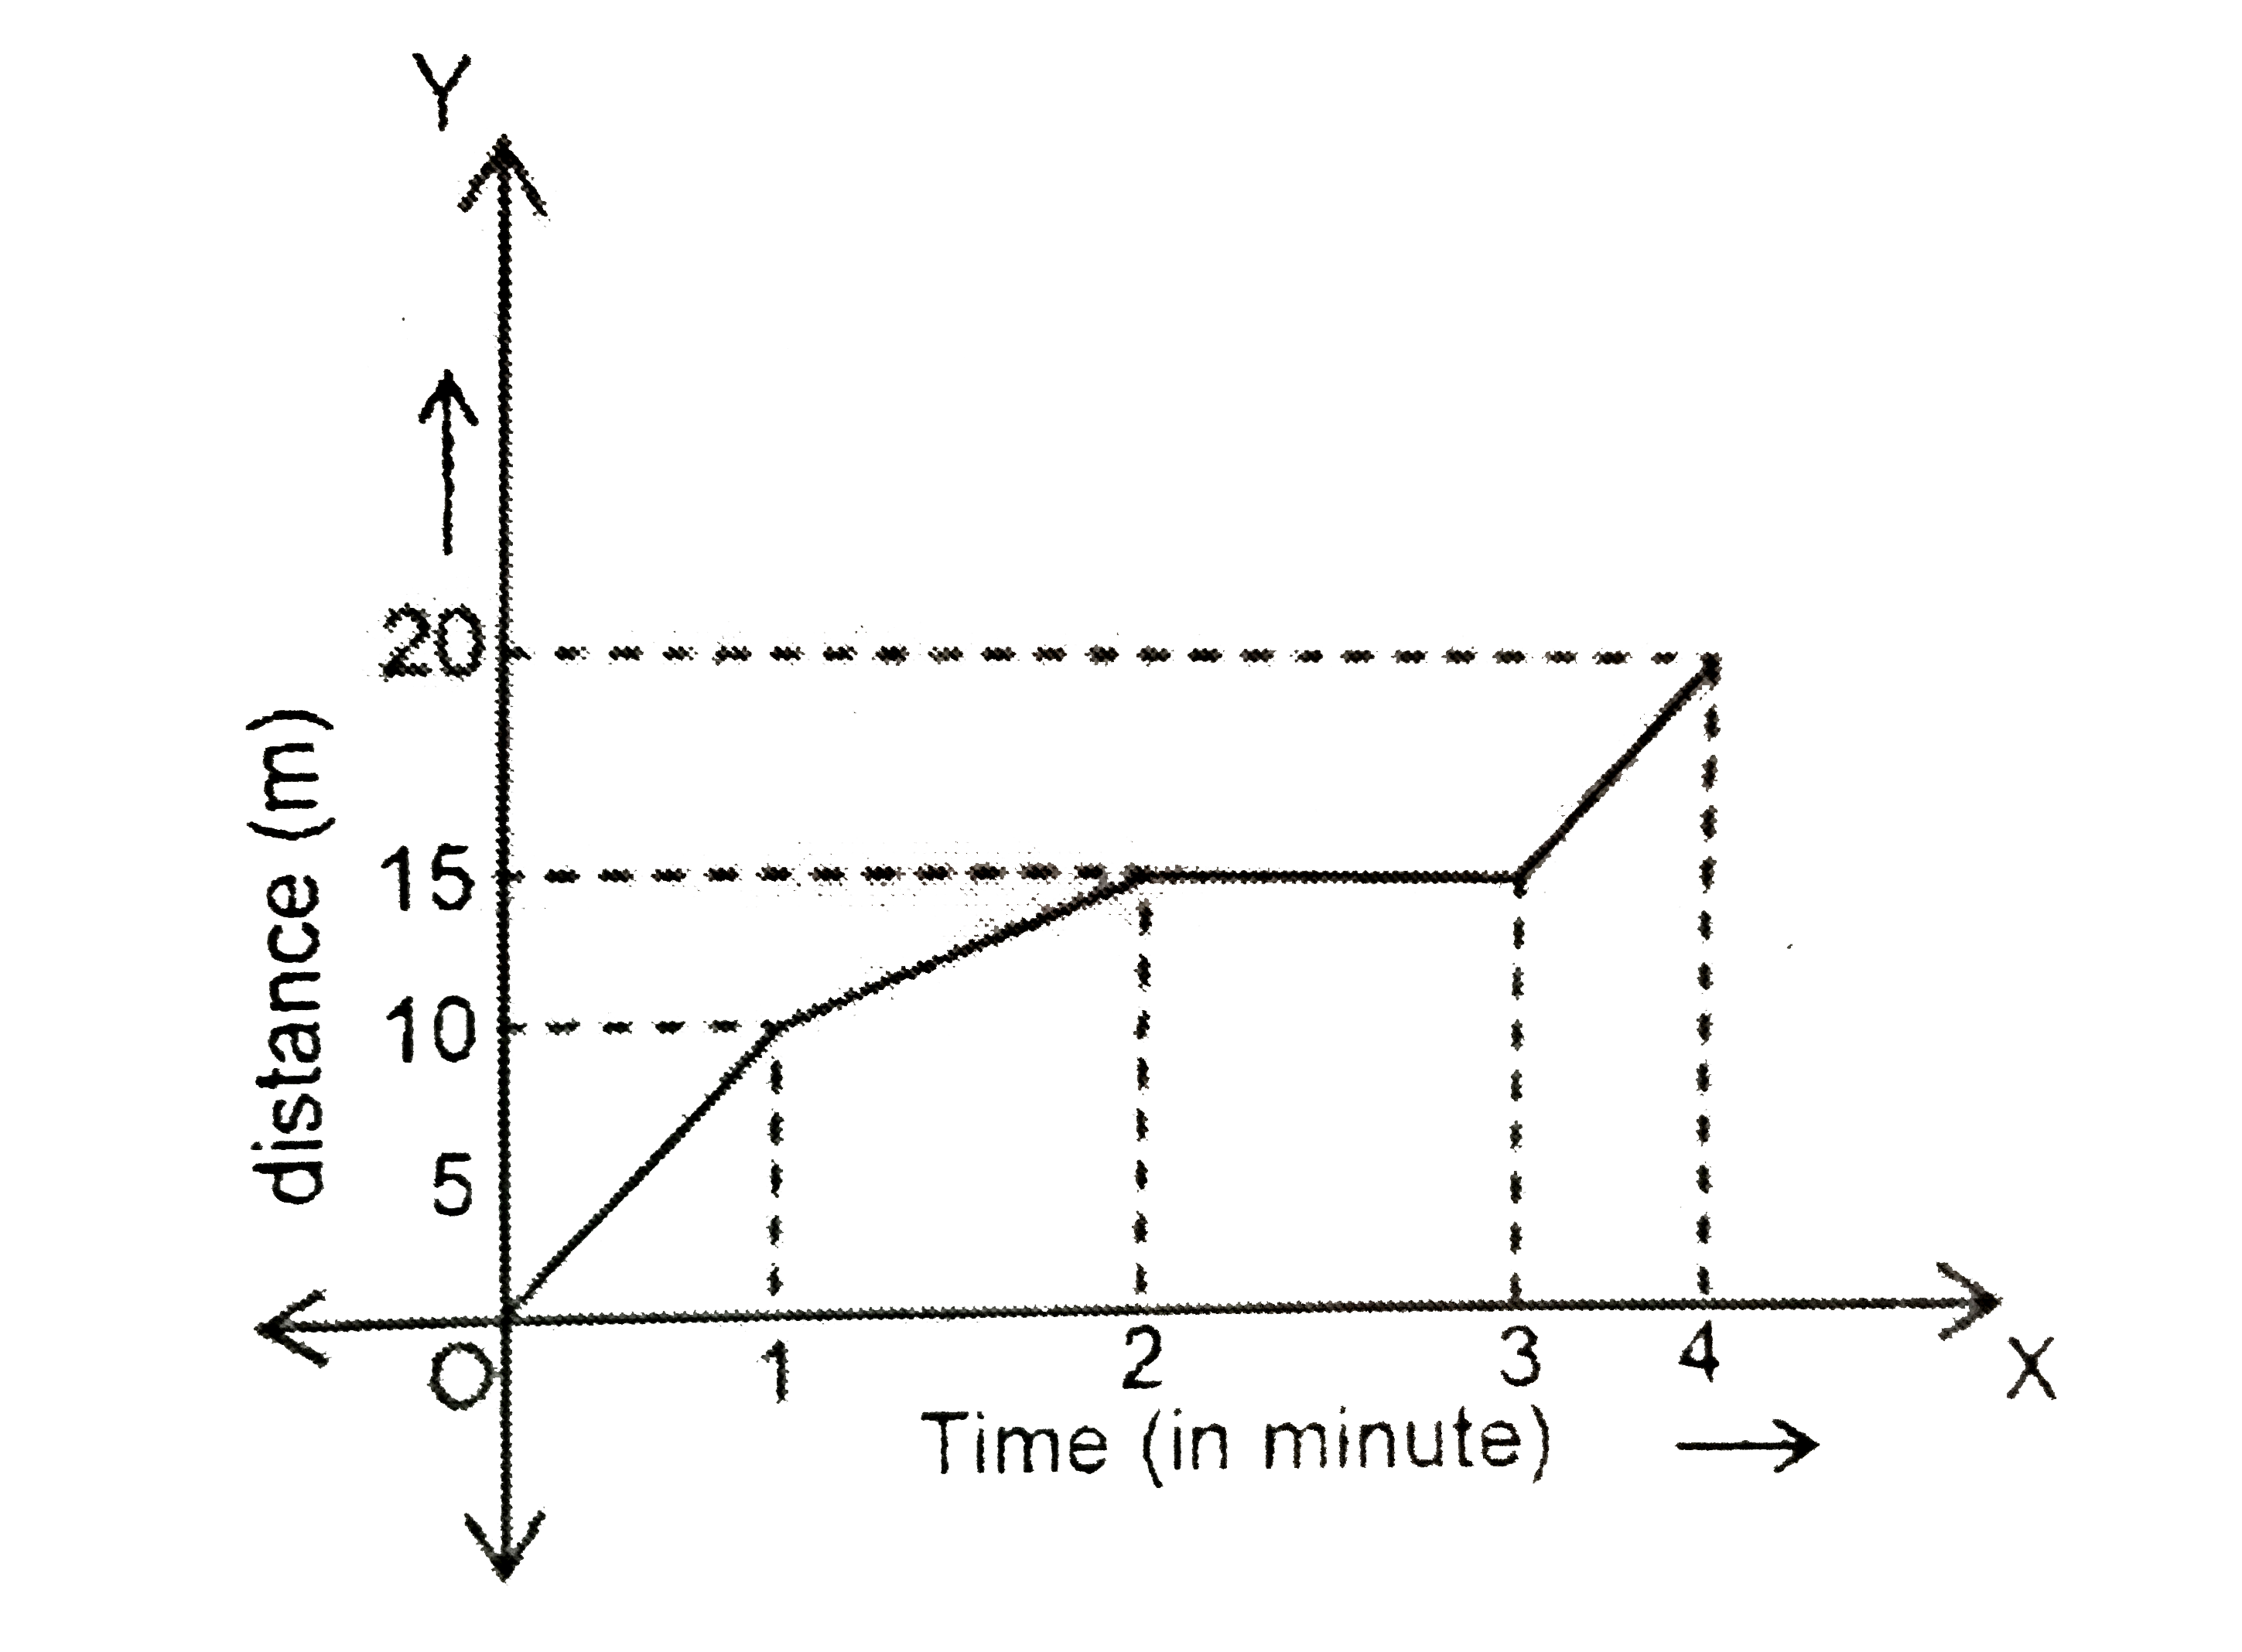
View SolutionDistance versus time graph of an object is as shown in the figure. The average speed of the object is _____ ms−1

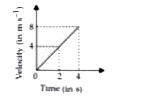
View SolutionVelocity time graph of an object of mass 2kg is shown in figure. The force required to move the object for first four seconds is
View Solution
