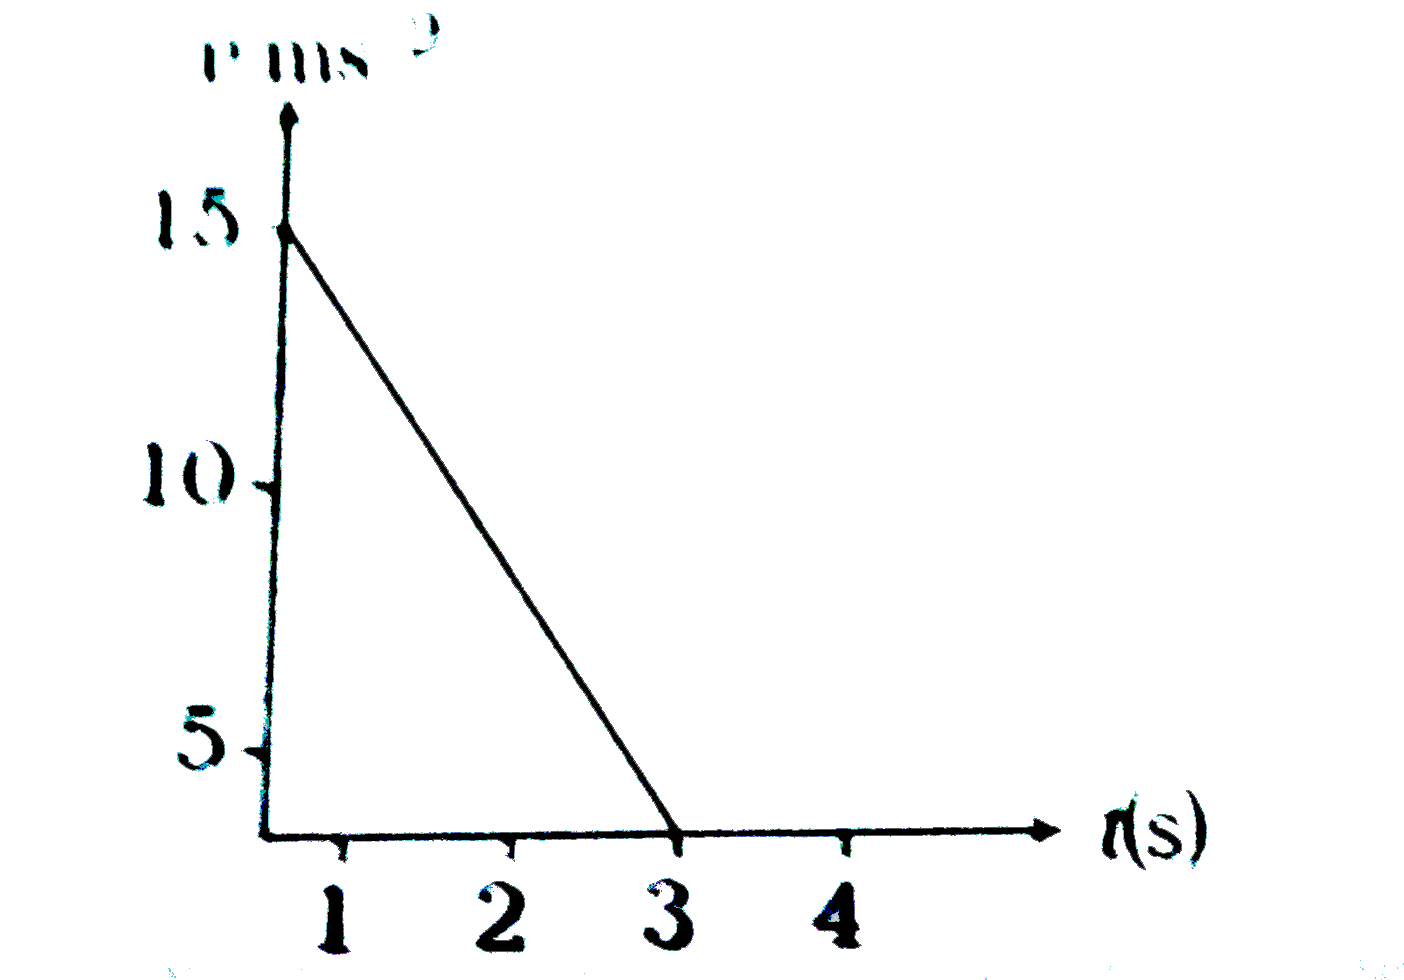
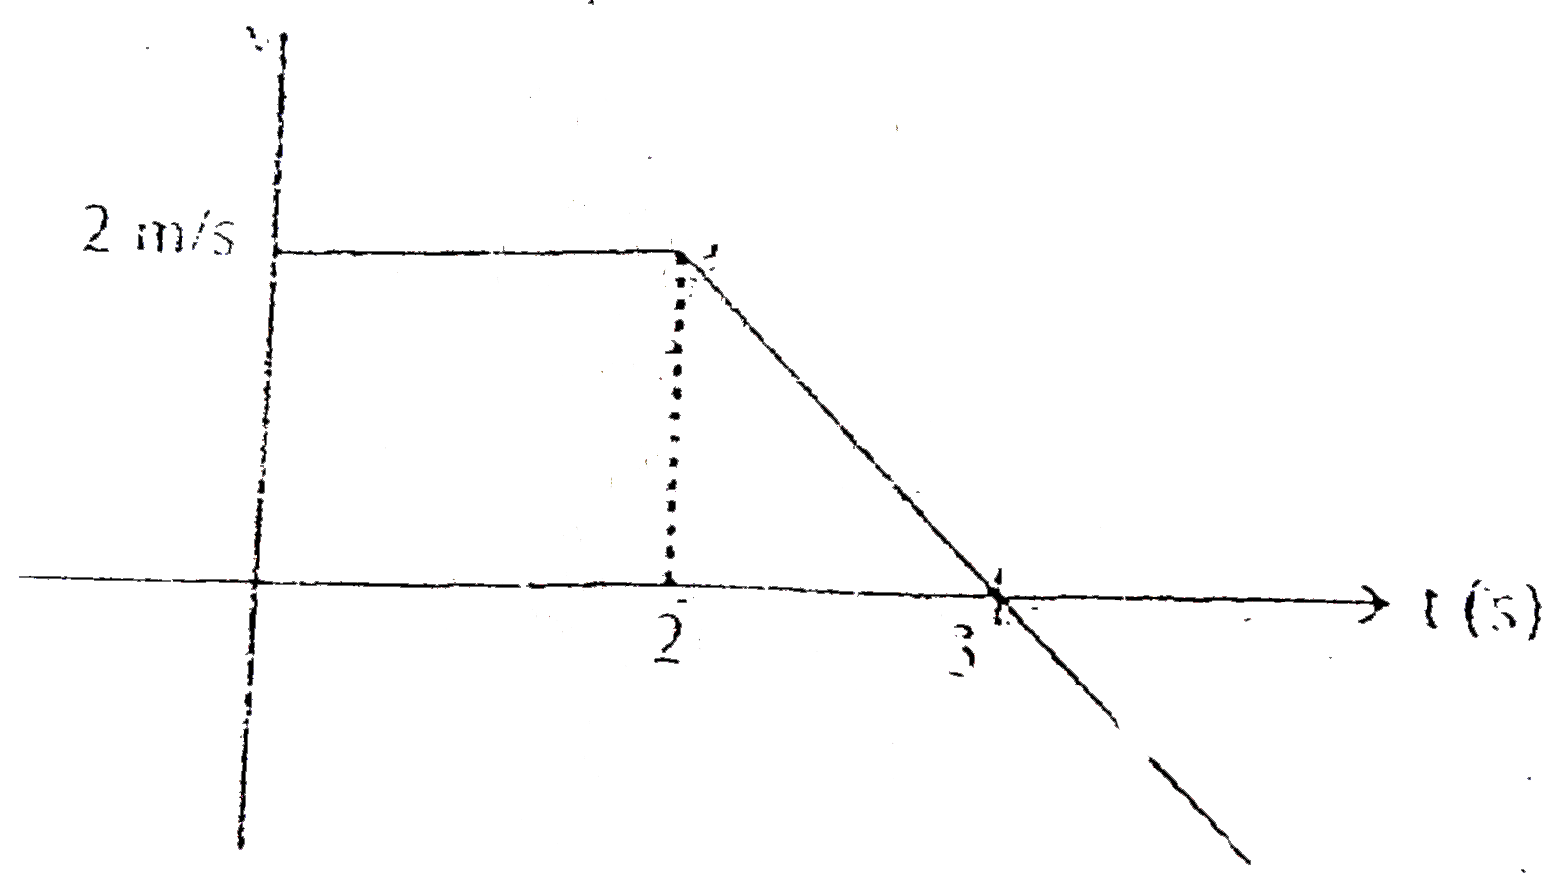
The velocity - time graph is shown in the figure, for a particle. The acceleration of particle is
22.5ms−2
5ms−2
−5ms−2
−3ms−2
The correct Answer is:C
a = slope of υ−t graph =−153=−5ms−2
Topper's Solved these Questions
- BOOK - DC PANDEY ENGLISHCHAPTER - MOTION IN A PLANEEXERCISE - Check point 3.715videos
MOTION IN A PLANE
- BOOK - DC PANDEY ENGLISHCHAPTER - MOTION IN A PLANEEXERCISE - (A) Taking it together75videos
MOTION IN A PLANE
- BOOK - DC PANDEY ENGLISHCHAPTER - MOTION IN A PLANEEXERCISE - Check point 3.525videos
MOTION IN A PLANE
- BOOK - DC PANDEY ENGLISHCHAPTER - MOTIONEXERCISE - Medical entrances gallery19videos
MOTION
- BOOK - DC PANDEY ENGLISHCHAPTER - PROJECTILE MOTIONEXERCISE - Level - 2 Subjective10videos
PROJECTILE MOTION
Similar Questions
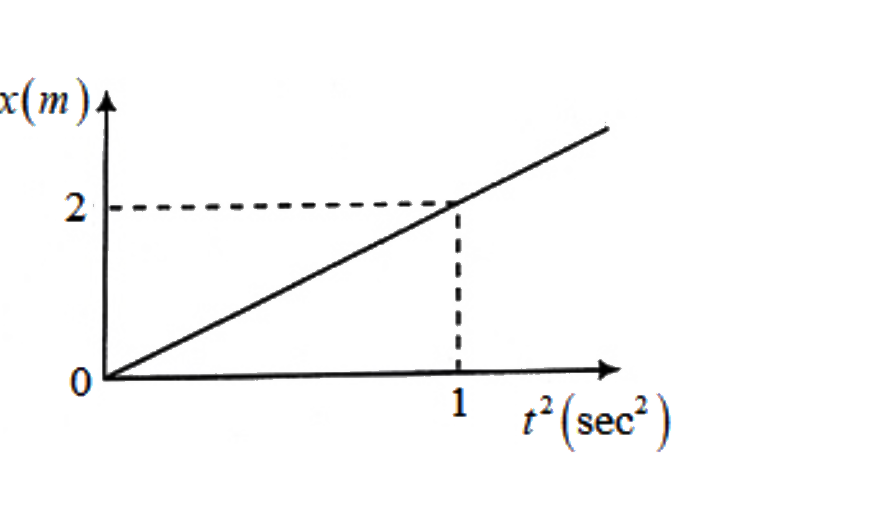
Displacement x versus t2 graph is shown for a particle. The acceleration of particle is
 View Solution
The velocity − time graph of a particle is as shown in figure
 View Solution
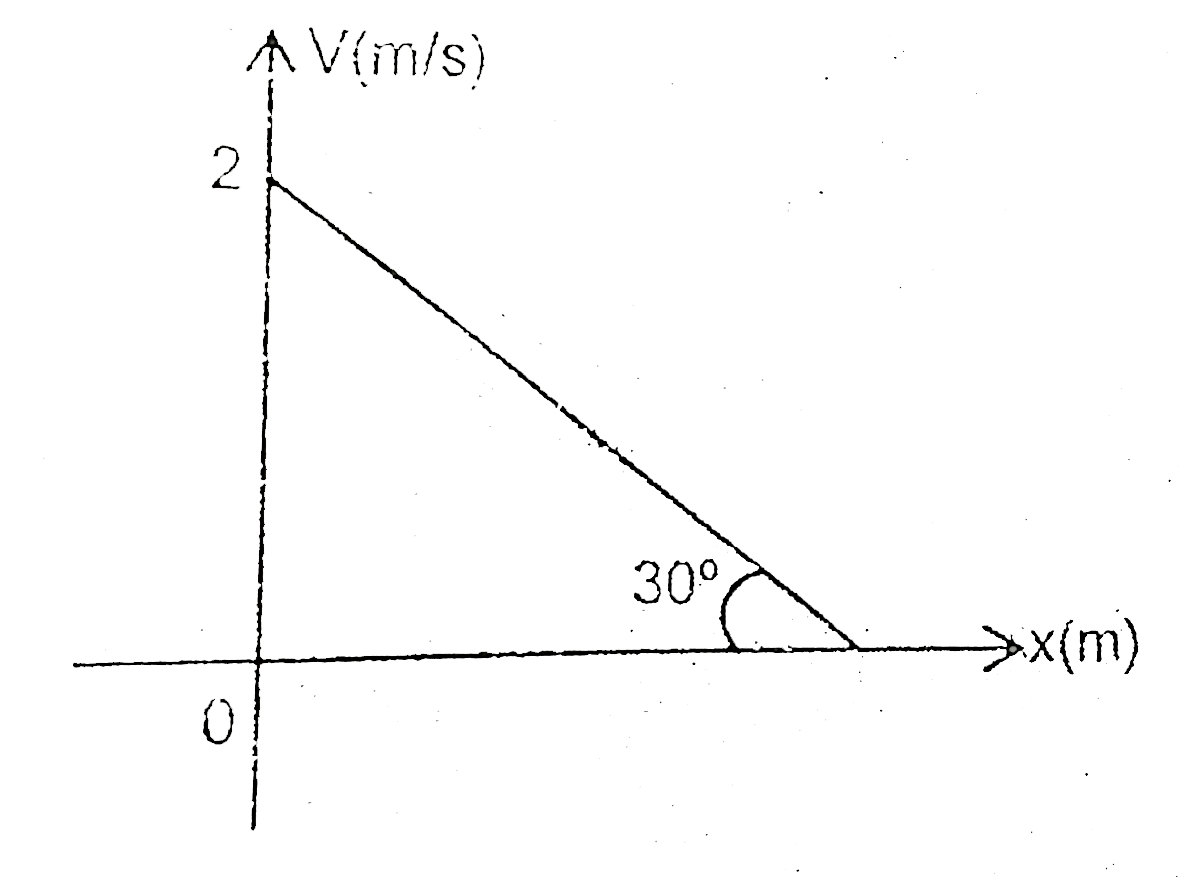
The velocity displacement graph of a particle is shown in figure. The acceleration of the particle when x=0 is.
 View Solution
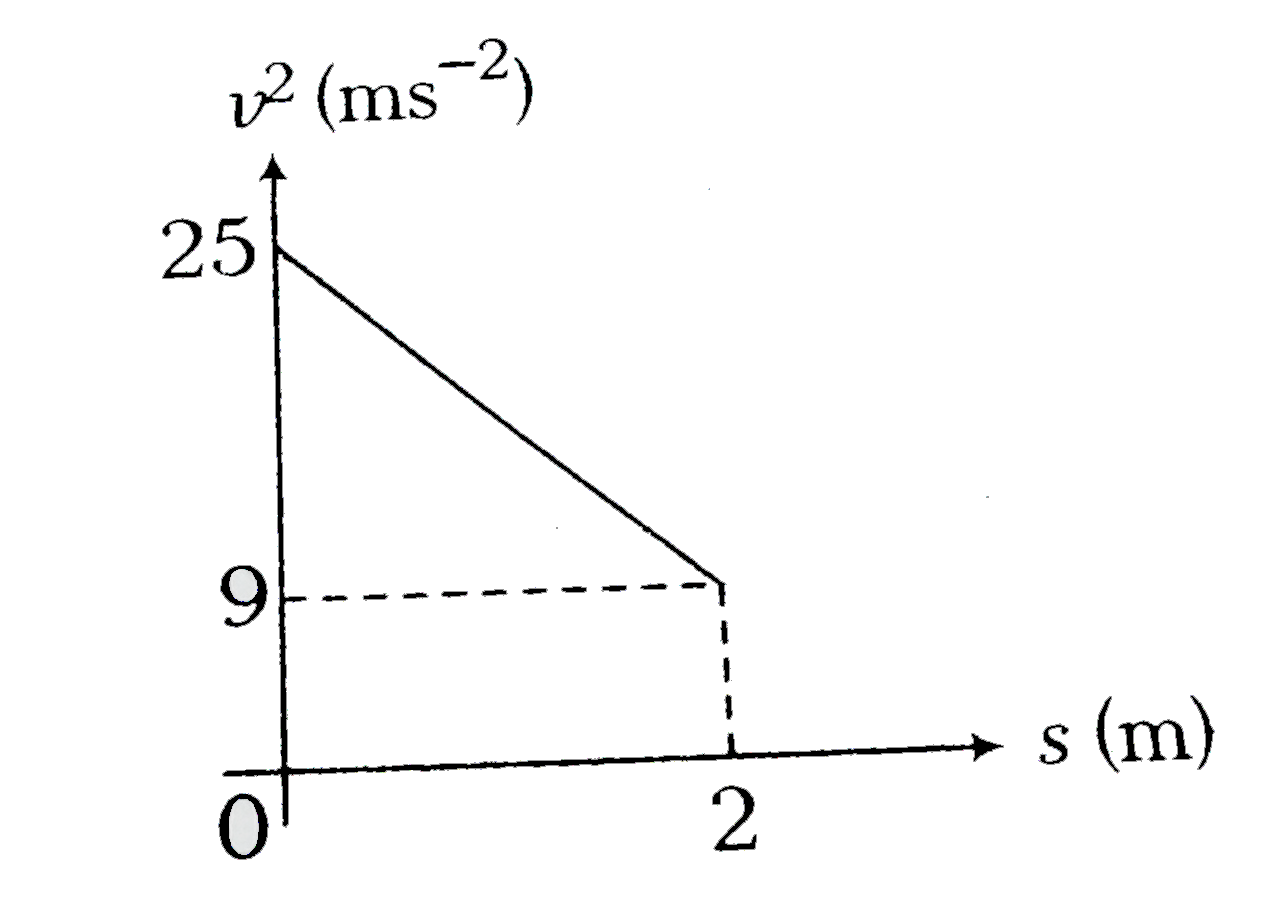
A graph between the square of the velocity of a particle and the distance s moved by the particle is shown in the figure. The acceleration of the particle is
 View Solution
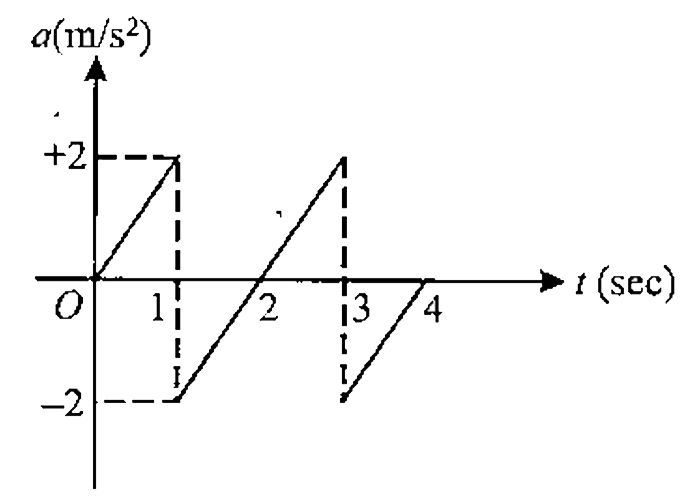
Acceleration vs time graph is shown in the figure for a particle moving along a straight line. The particle is initially at rest. Find the time instant(s) when the particle comes to rest?
 View Solution
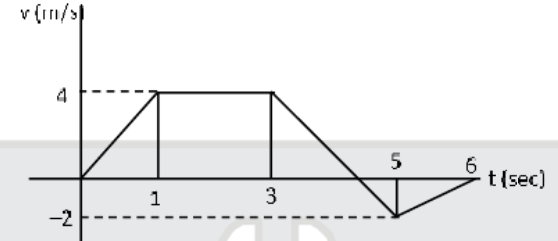
velocity time graph of a particle is shown in figure. Find displacement of the particle.
 View Solution
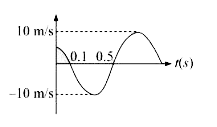
The velocity time graph of a particle executing SHM is shown. The maximum acceleration of the particle is nπm/s2, where n is______.
 View Solution
Assertion : In the s-t graph as shown in figure, velocity of particle is negative and acceleration is positive.
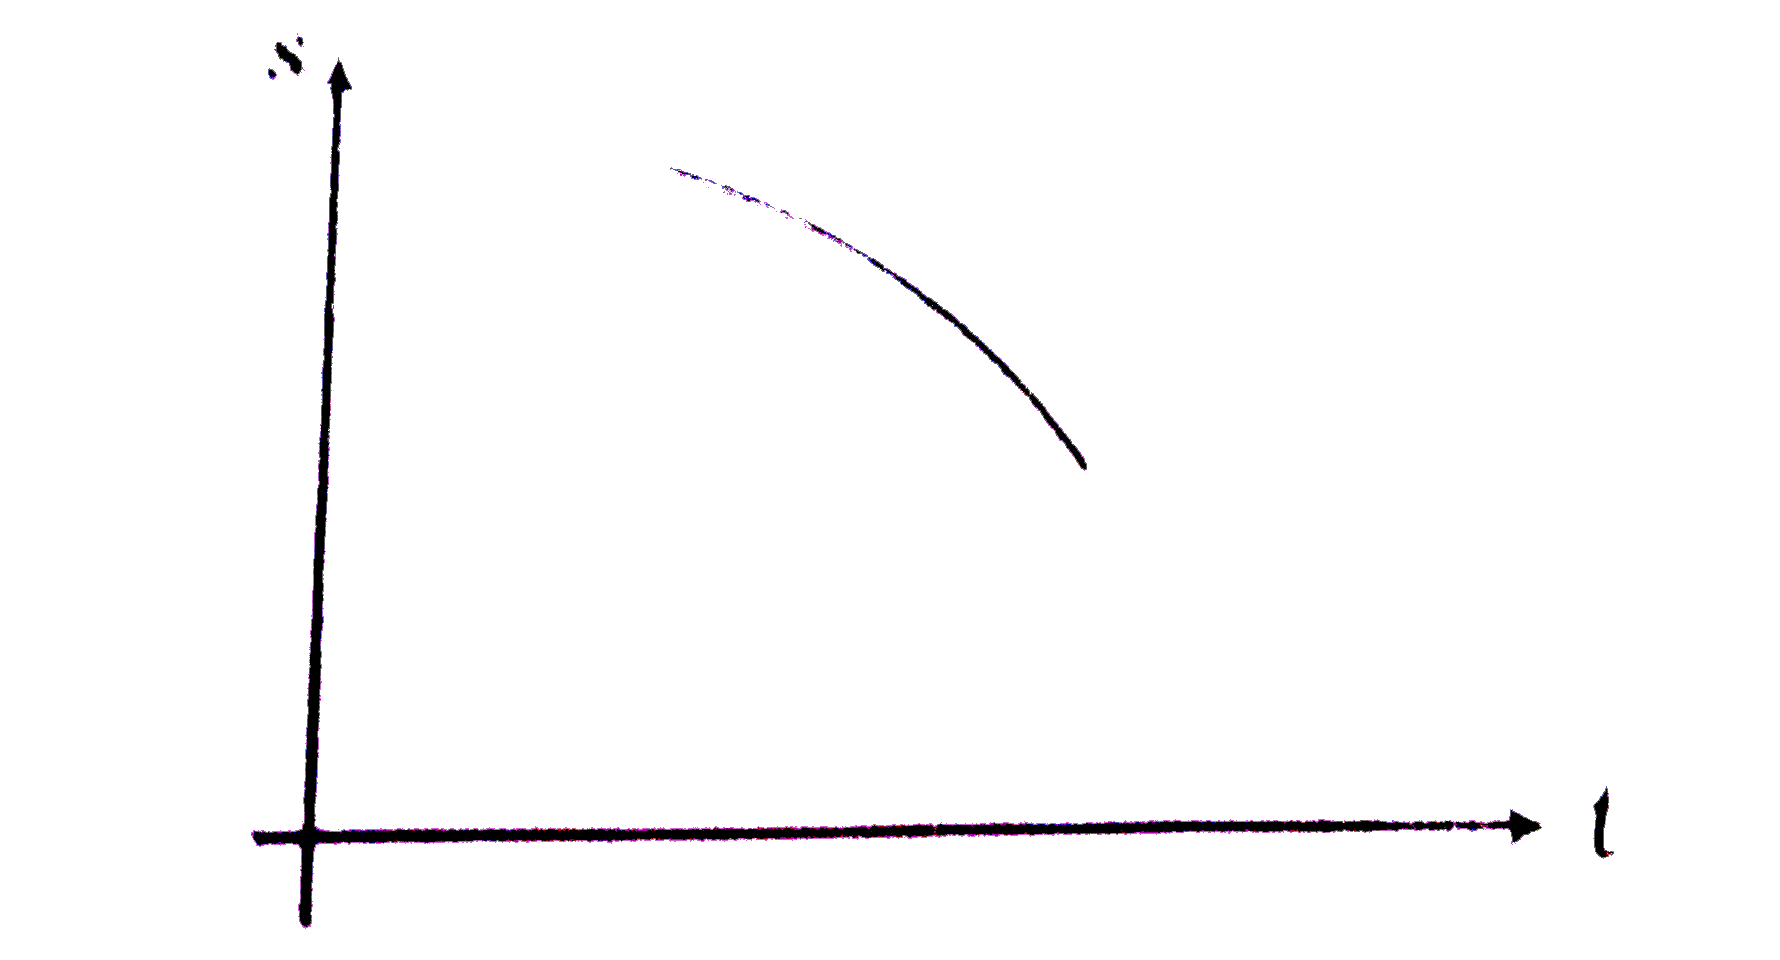
Reason : Slope of s-t graph is negative and increasing in magnitude.View SolutionA particle is moving on X−axis. Its velocity time graph is given in the figure. Find distance travelled by the particle in 5sec.
 View Solution
A particle is moving in a straight line. Particle was initially at rest. Acceleration versus time graph is shown in figure. Acceleration of particle is given by a=3sinπt in m/s2. The time (in s) when the particle comes to rest is
 View Solution
