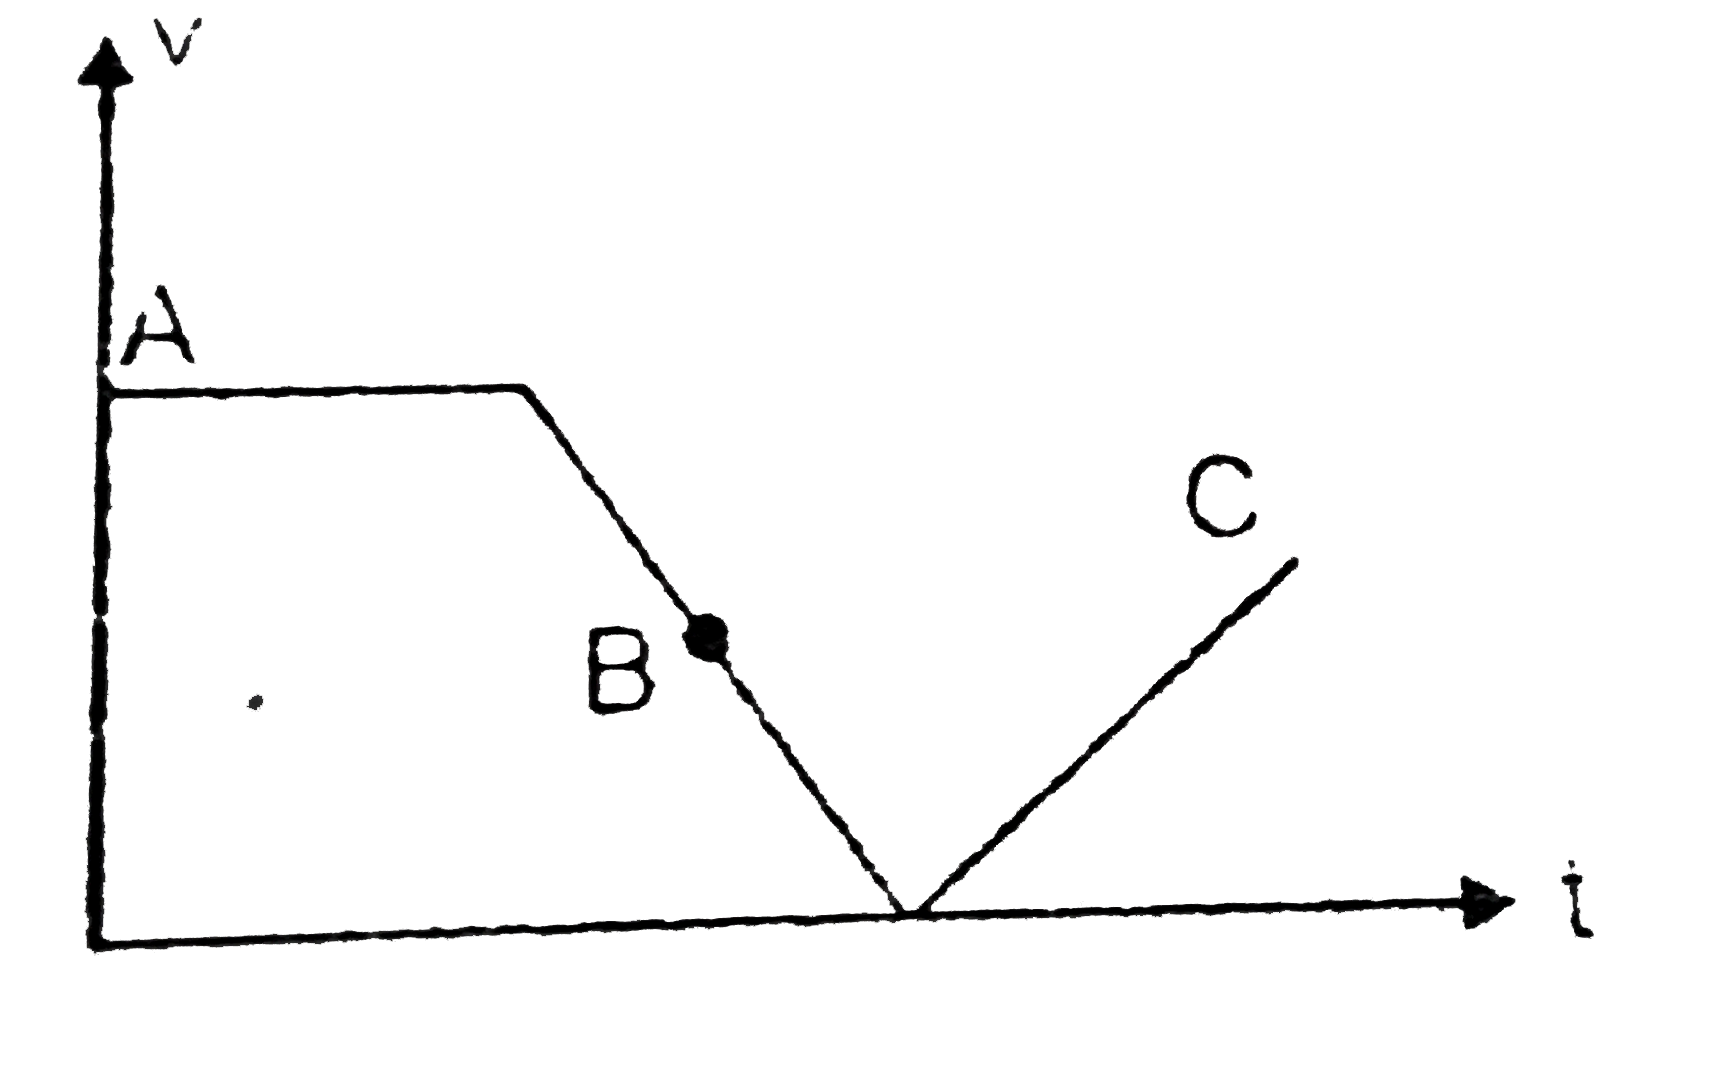
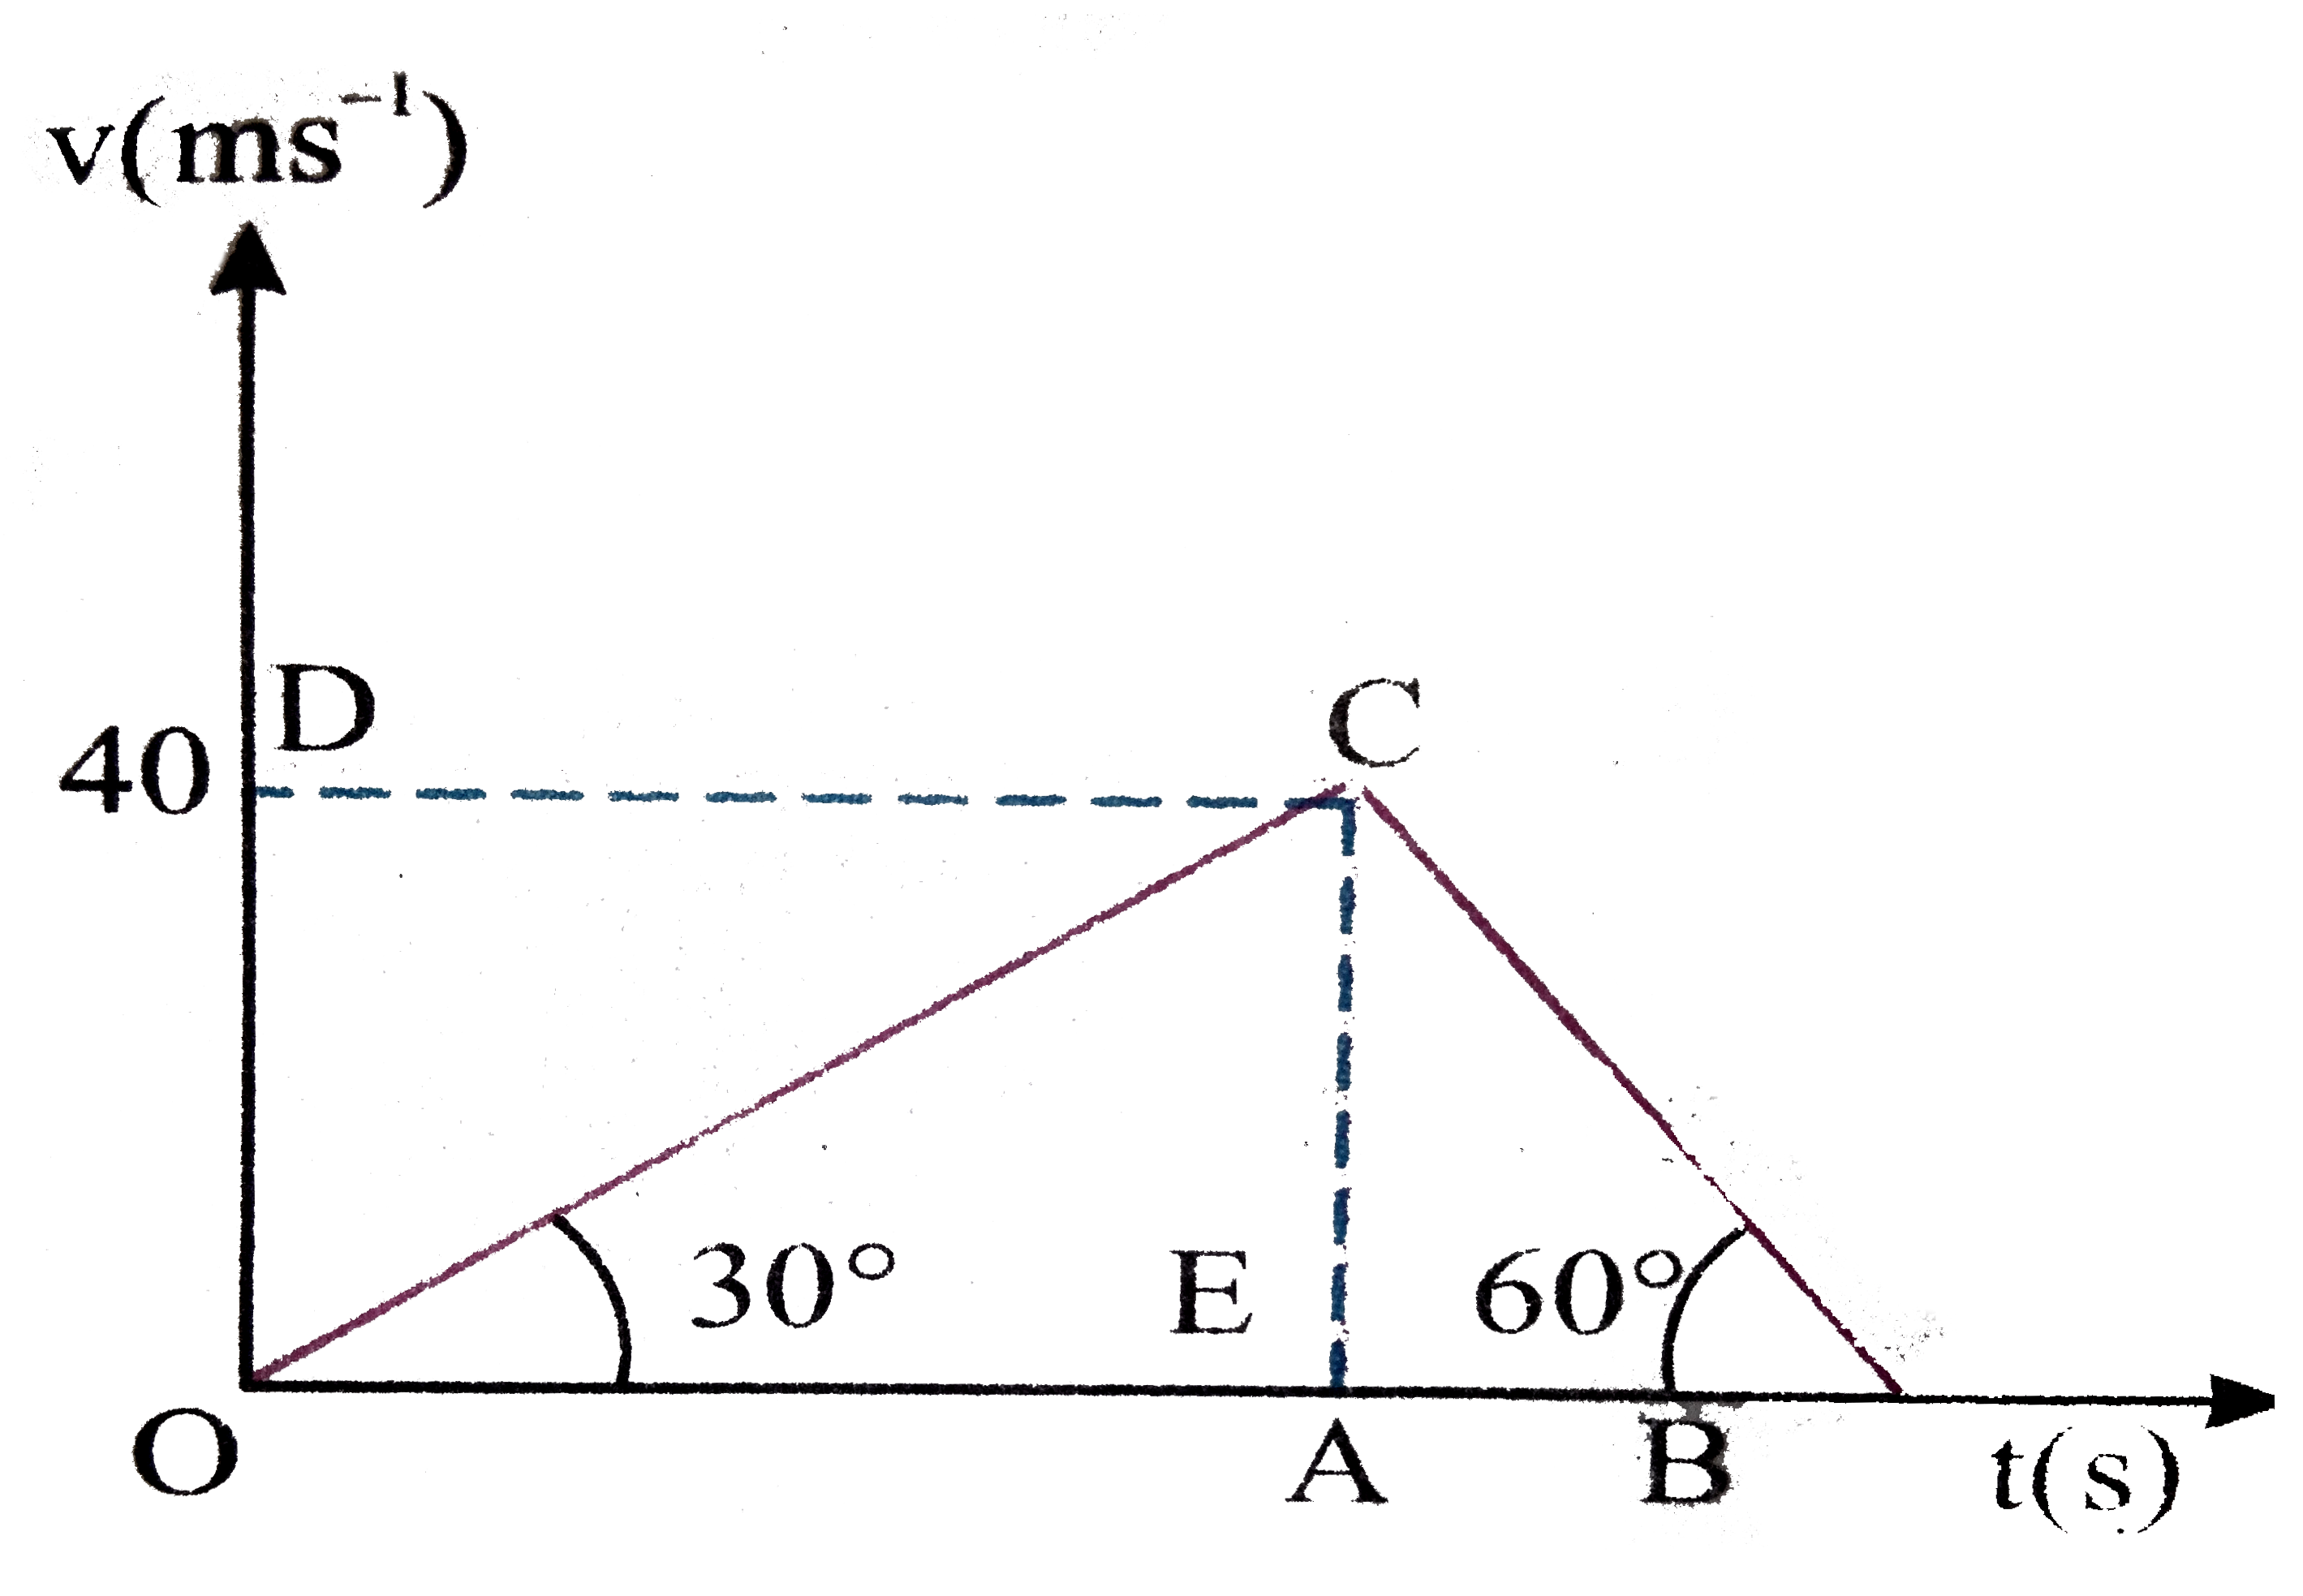
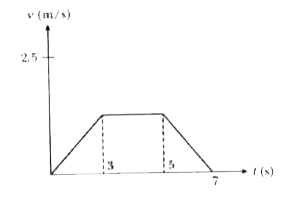
The velocity-time graph of a body is shown in figure. The ratio of magnitude of average acceleration during the intervals OA and AB is
A
3
B
2
C
1/2
D
1/3
Video Solution
Text Solution
The correct Answer is:D
1/3
|
Updated on:21/07/2023
Topper's Solved these Questions
- BOOK - MCGROW HILL PUBLICATIONCHAPTER - MISCELLANEOUS QUESTIONSEXERCISE - PART-B99videos
MISCELLANEOUS QUESTIONS
- BOOK - MCGROW HILL PUBLICATIONCHAPTER - MEASUREMENTEXERCISE - ELEMENTARY QUESTIONS (HIGHER ORDER THINKING QUESTIONS)13videos
MEASUREMENT
- BOOK - MCGROW HILL PUBLICATIONCHAPTER - MOTIONEXERCISE - HIGHER ORDER THINKING QUESTIONS48videos
MOTION
Similar Questions
Knowledge Check
- Question 1 - Select One
The velocity − time graph of a particle is as shown in figure
 AIt moves with a constant acceleration throughoutBIt moves with an acceleration of constant magnitude but changing direction at the end of every two secondCThe displacement of the particle is zeroDThe velocity becomes zero at t=4 second
 - Question 2 - Select One
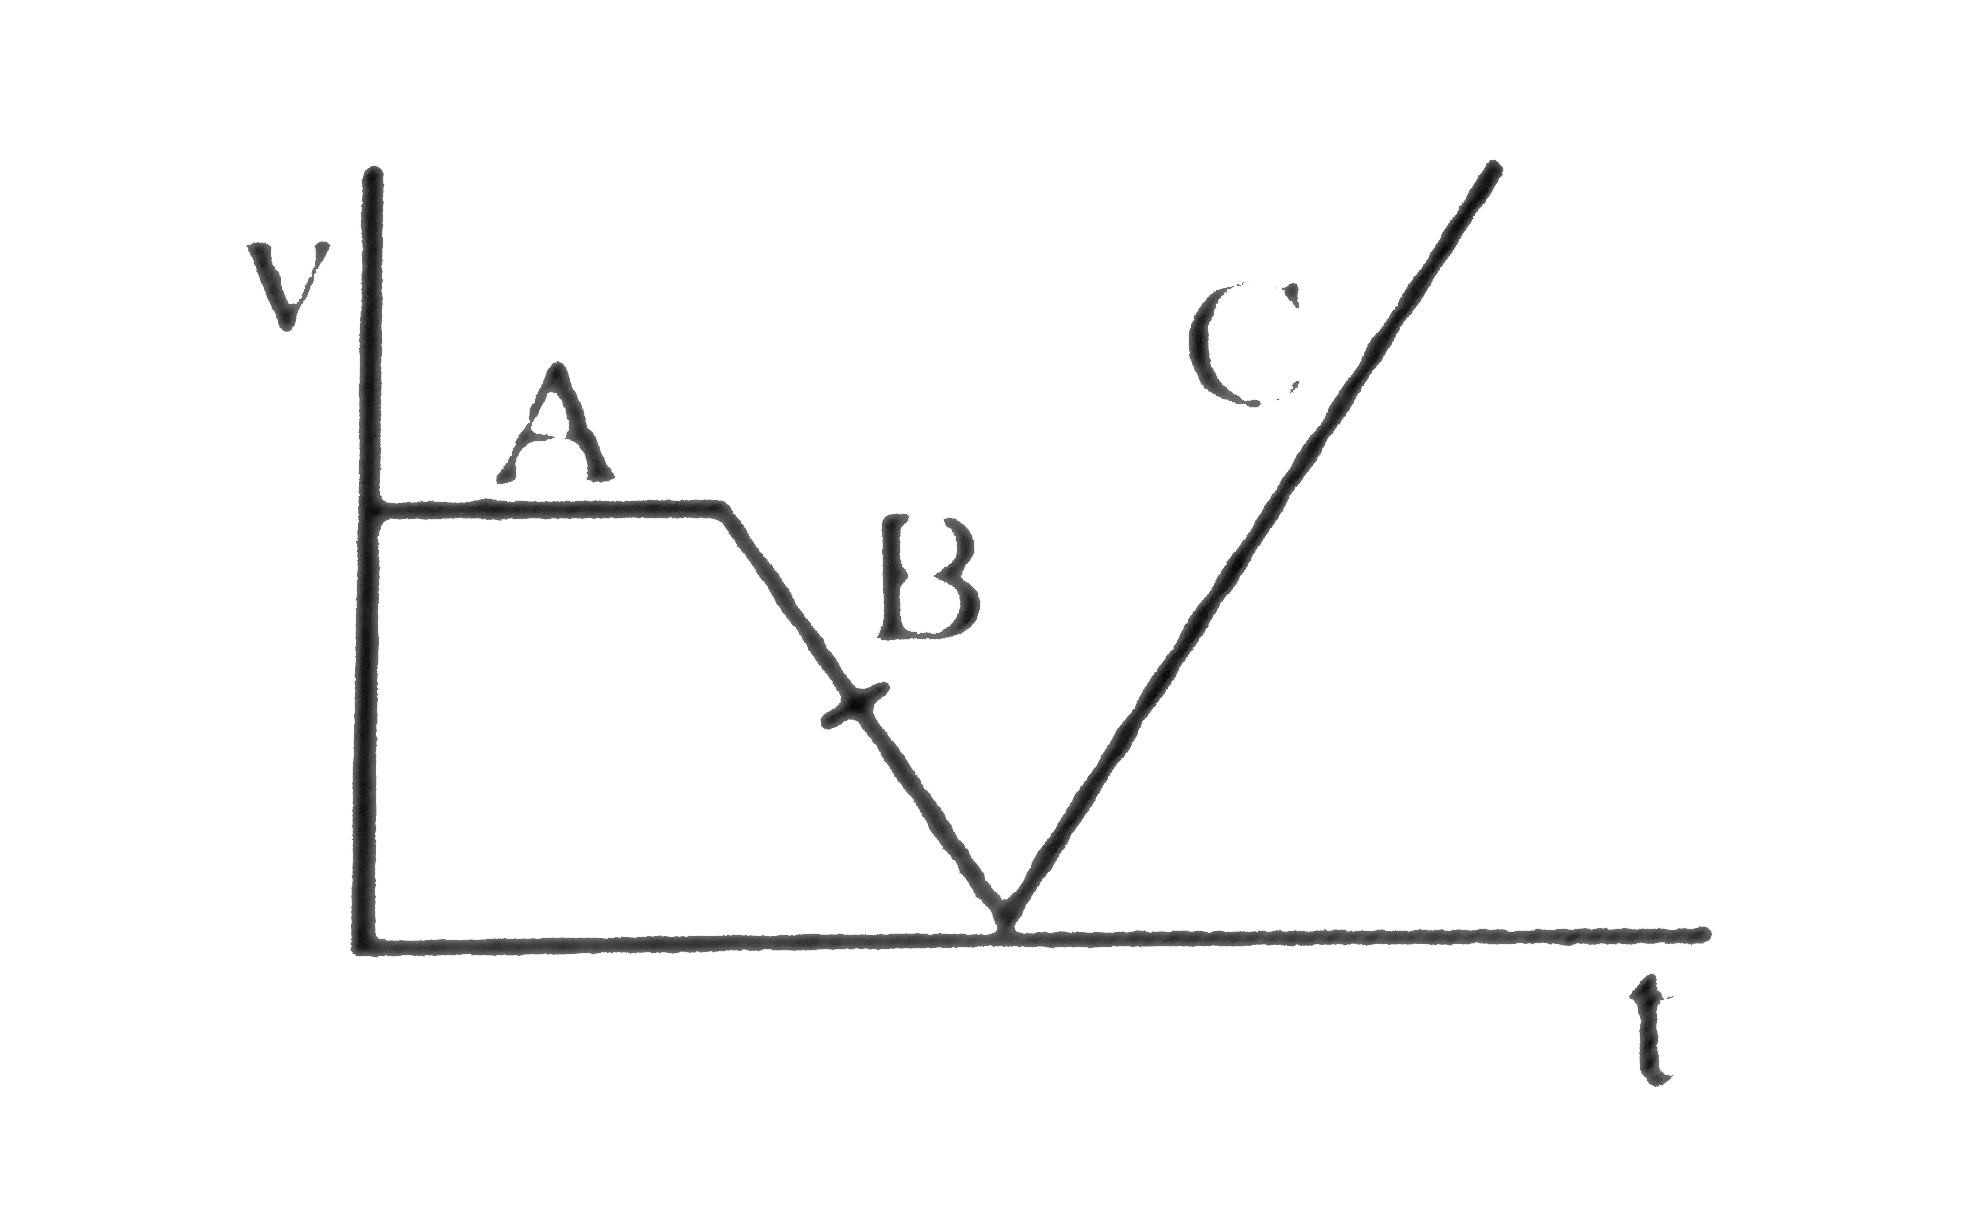
The velocity-time graph of a body is shown in the figure, it implies that at point B
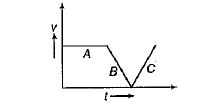 Athe force Is zeroBthere is a force toward motionCthere Is a force which opposes motionDthere is only gravitational force
 - Question 3 - Select One
The velocity-time graph of a body is shown in .
The displacement of the body in 8s is.
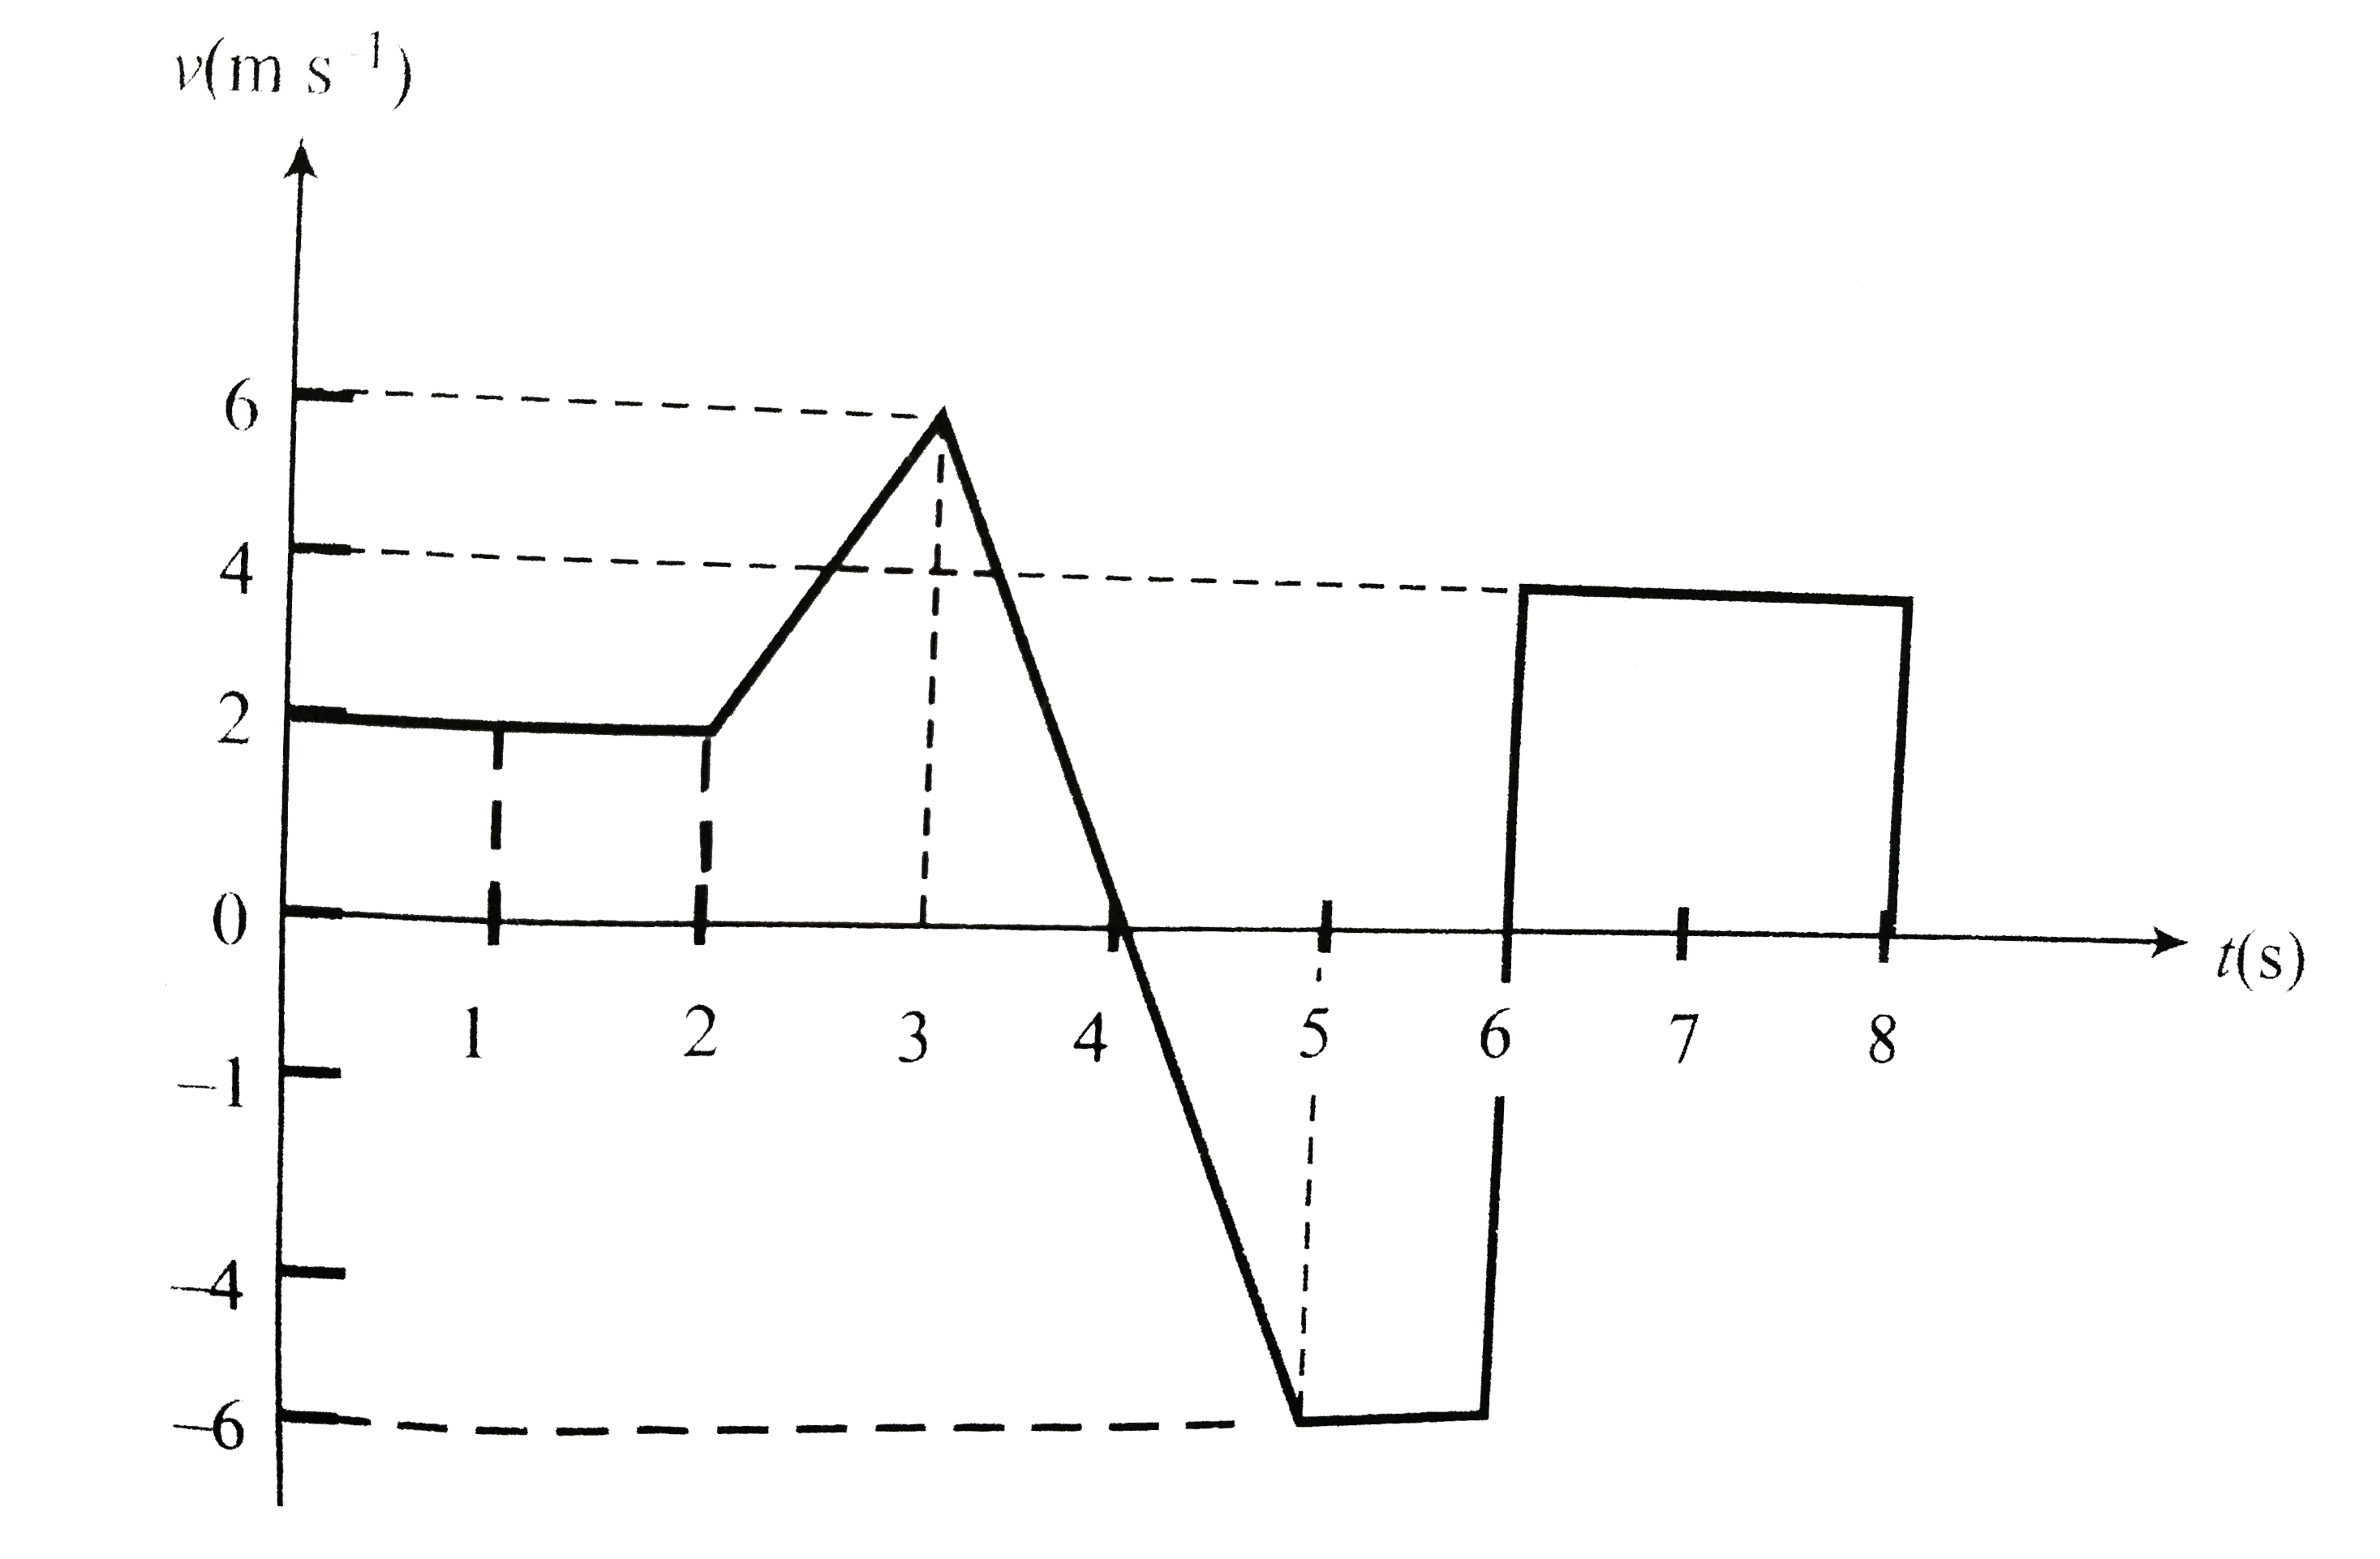 .A9mB12mC10mD28m
Velocity versus time graph of a body is shown in figure. It explains that
 View Solution
The velocity time graph of a body is as showh in
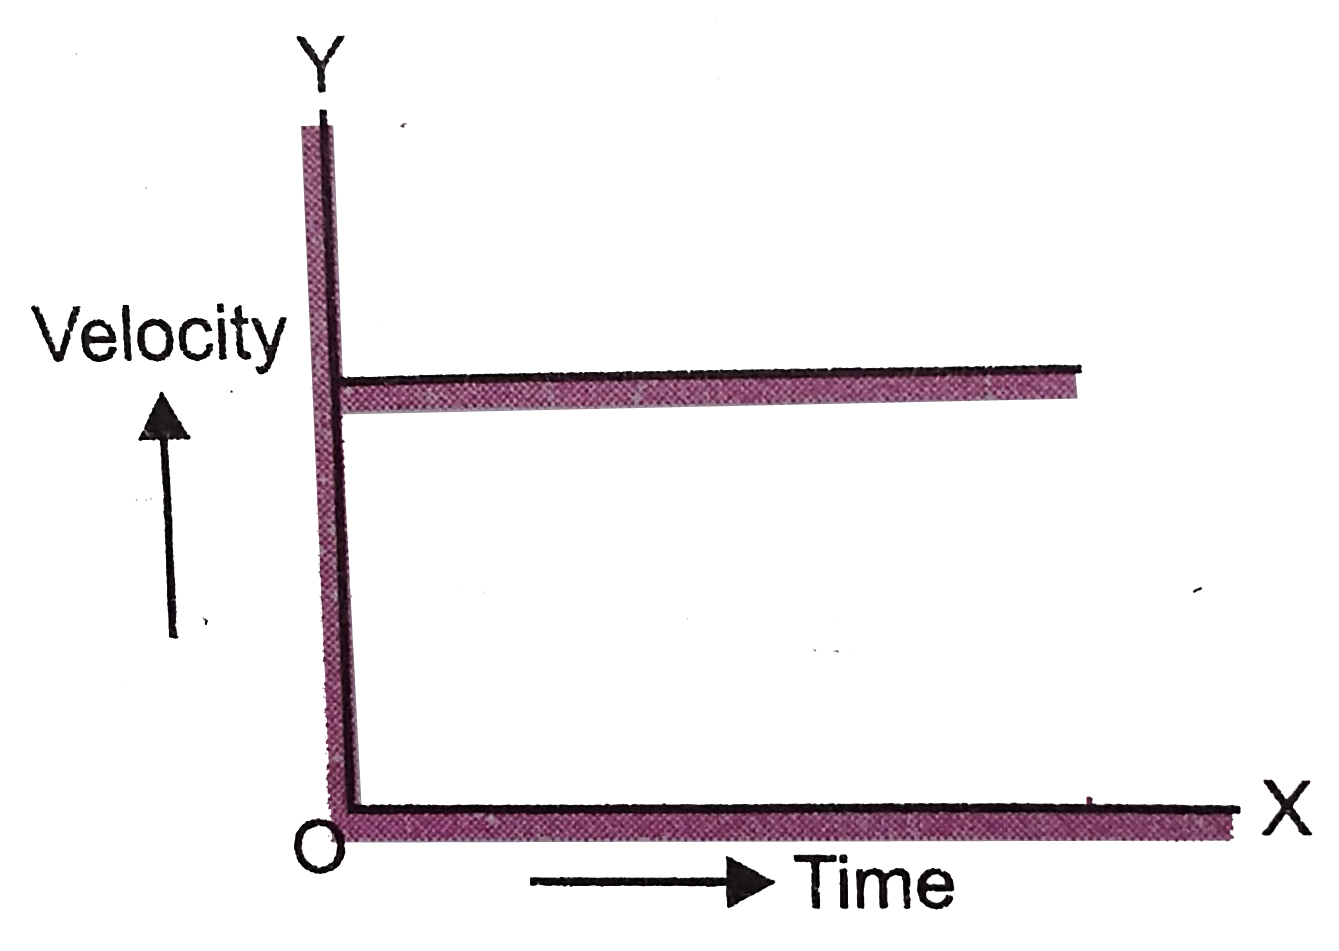
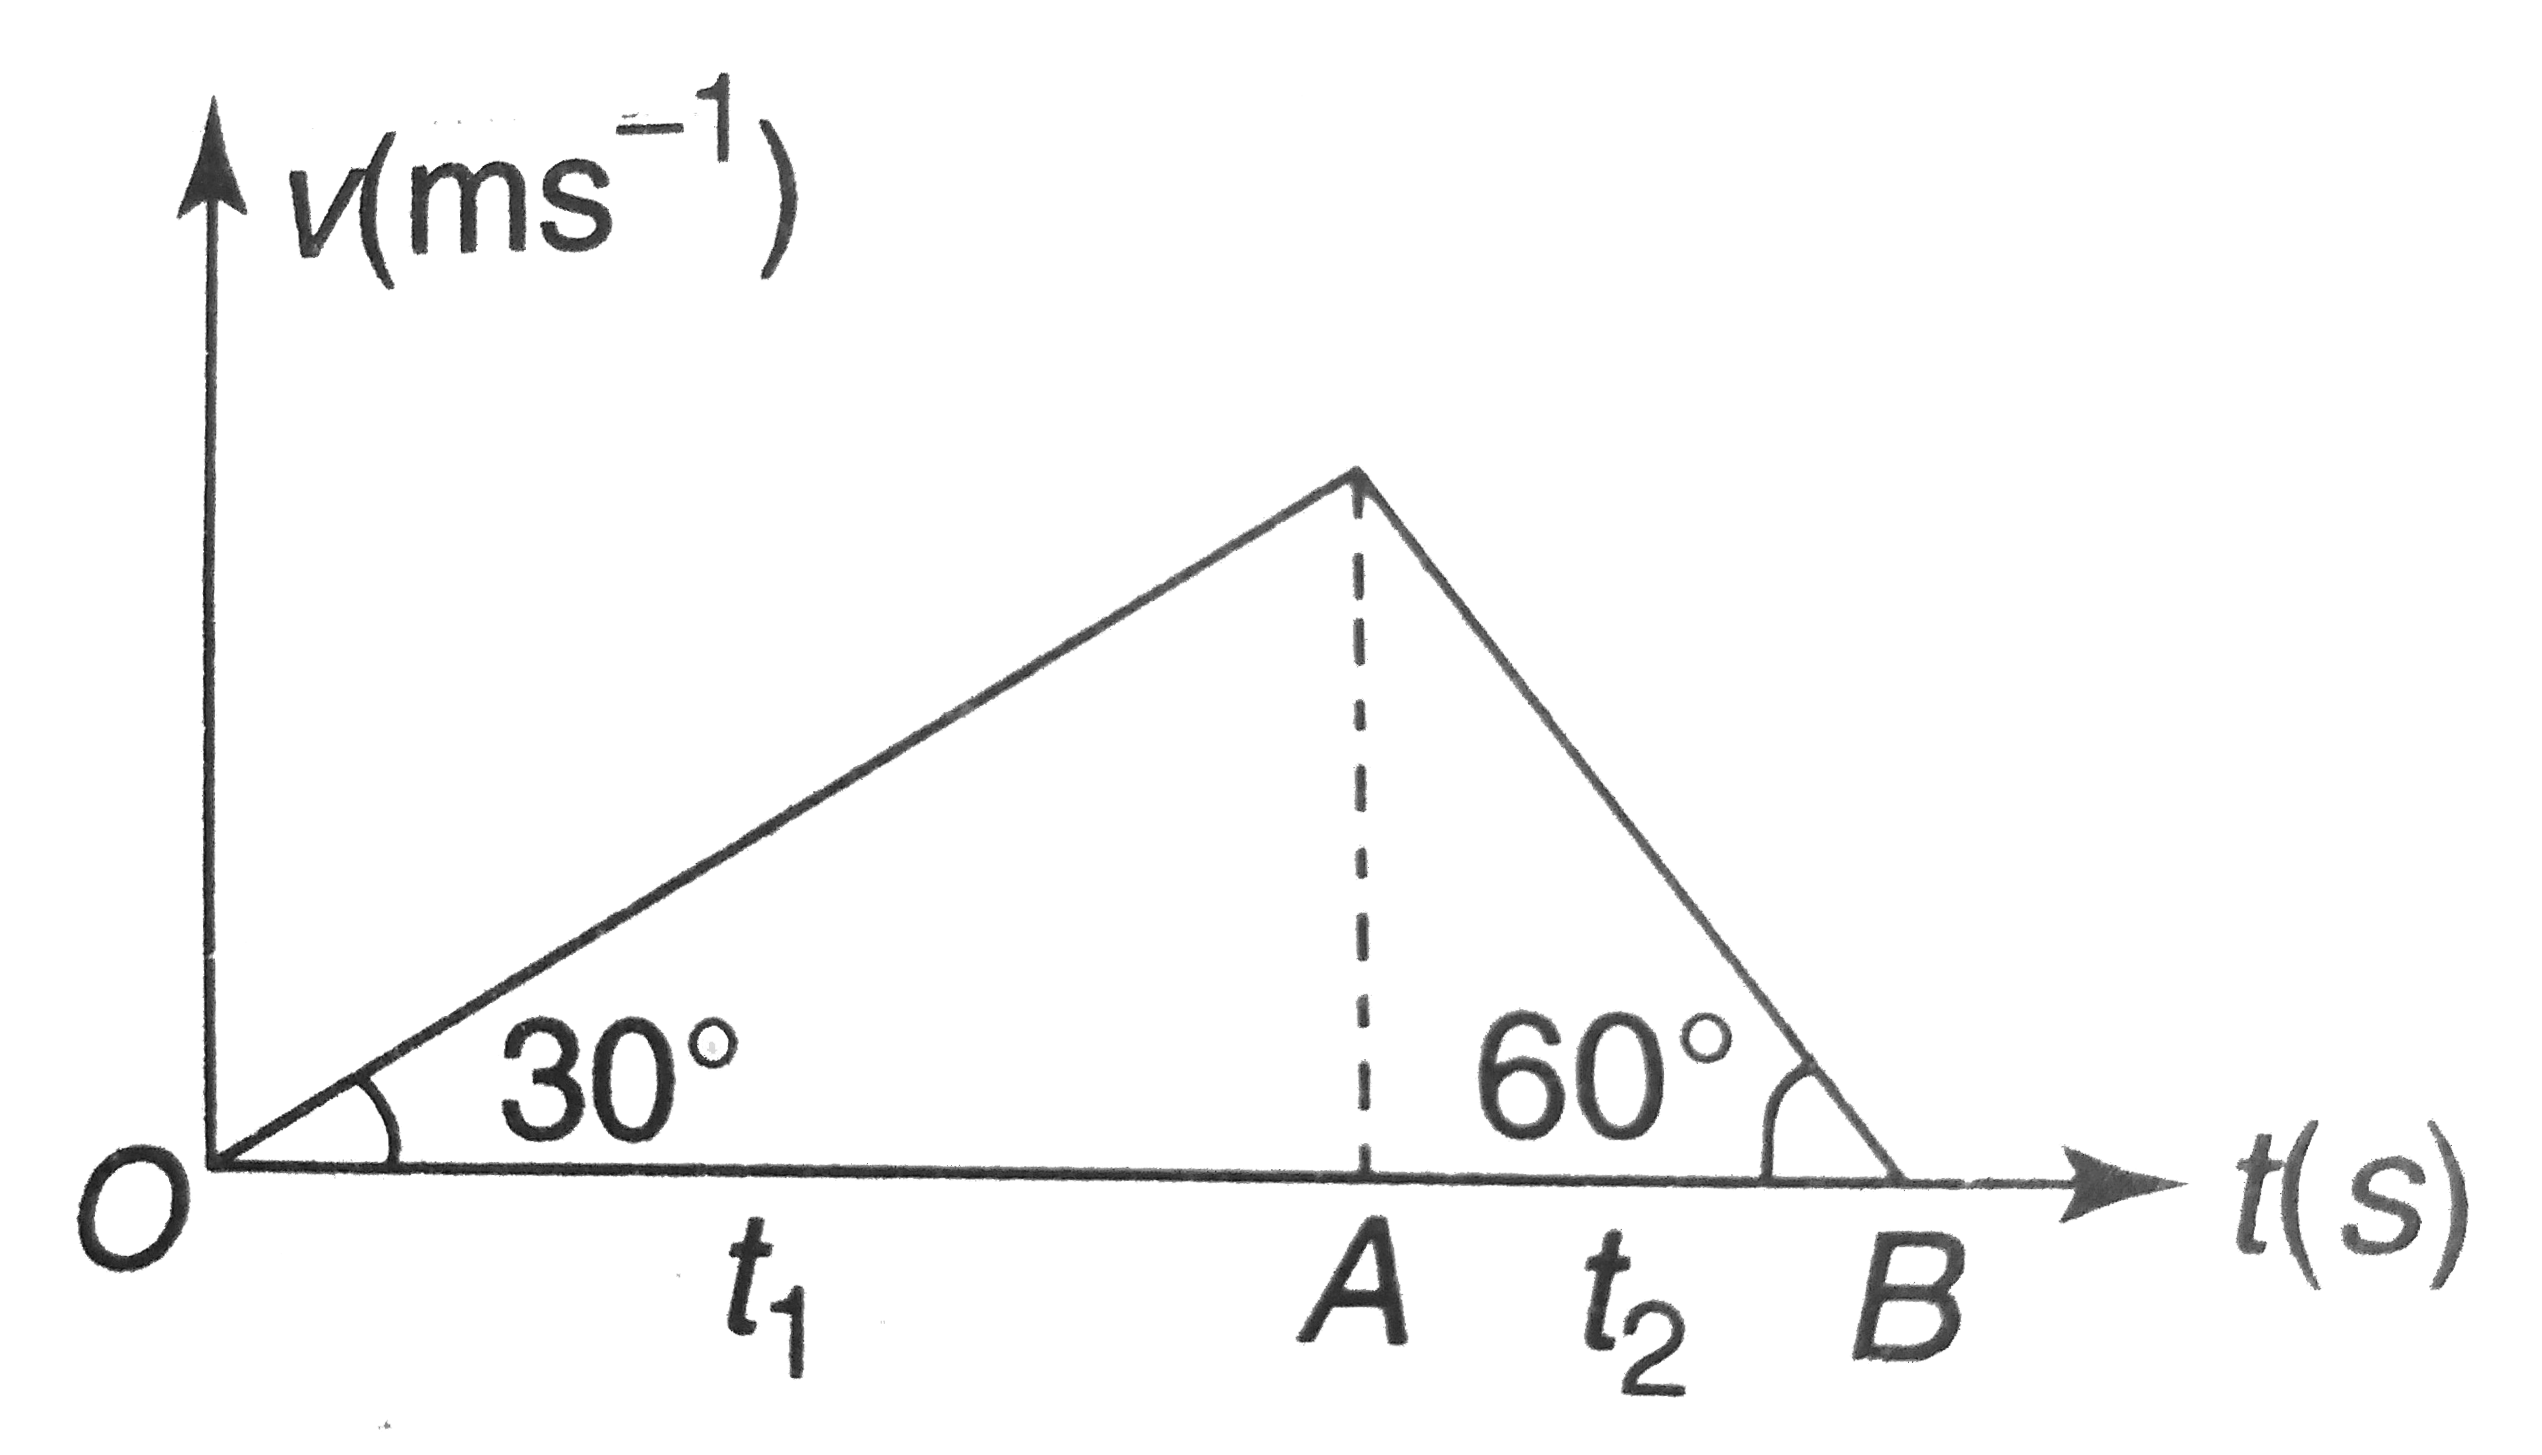
what would be the acceleration of the body ?View SolutionThe velocity time graph of a body moving along a straight line is shown in figure. The ratio of the average velocities during the time t1 and t2 is.
 View Solution
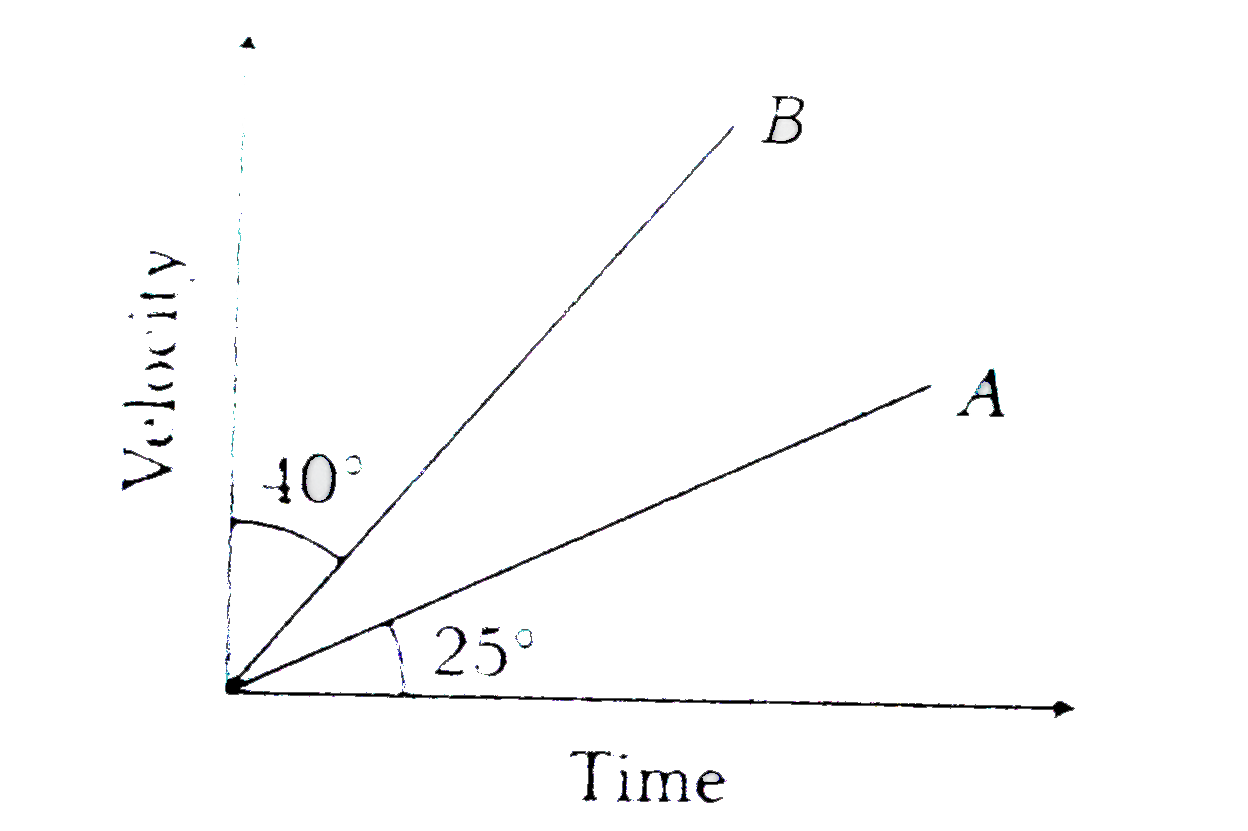
The velocity - time graph for two bodies A and B are shown in figure. Then, the acceleration of A and B are in the ratio
 View Solution
The velocity - time graph of a body is given in figure below .
The acceleration-time graph of the motion of the body isView Solution


