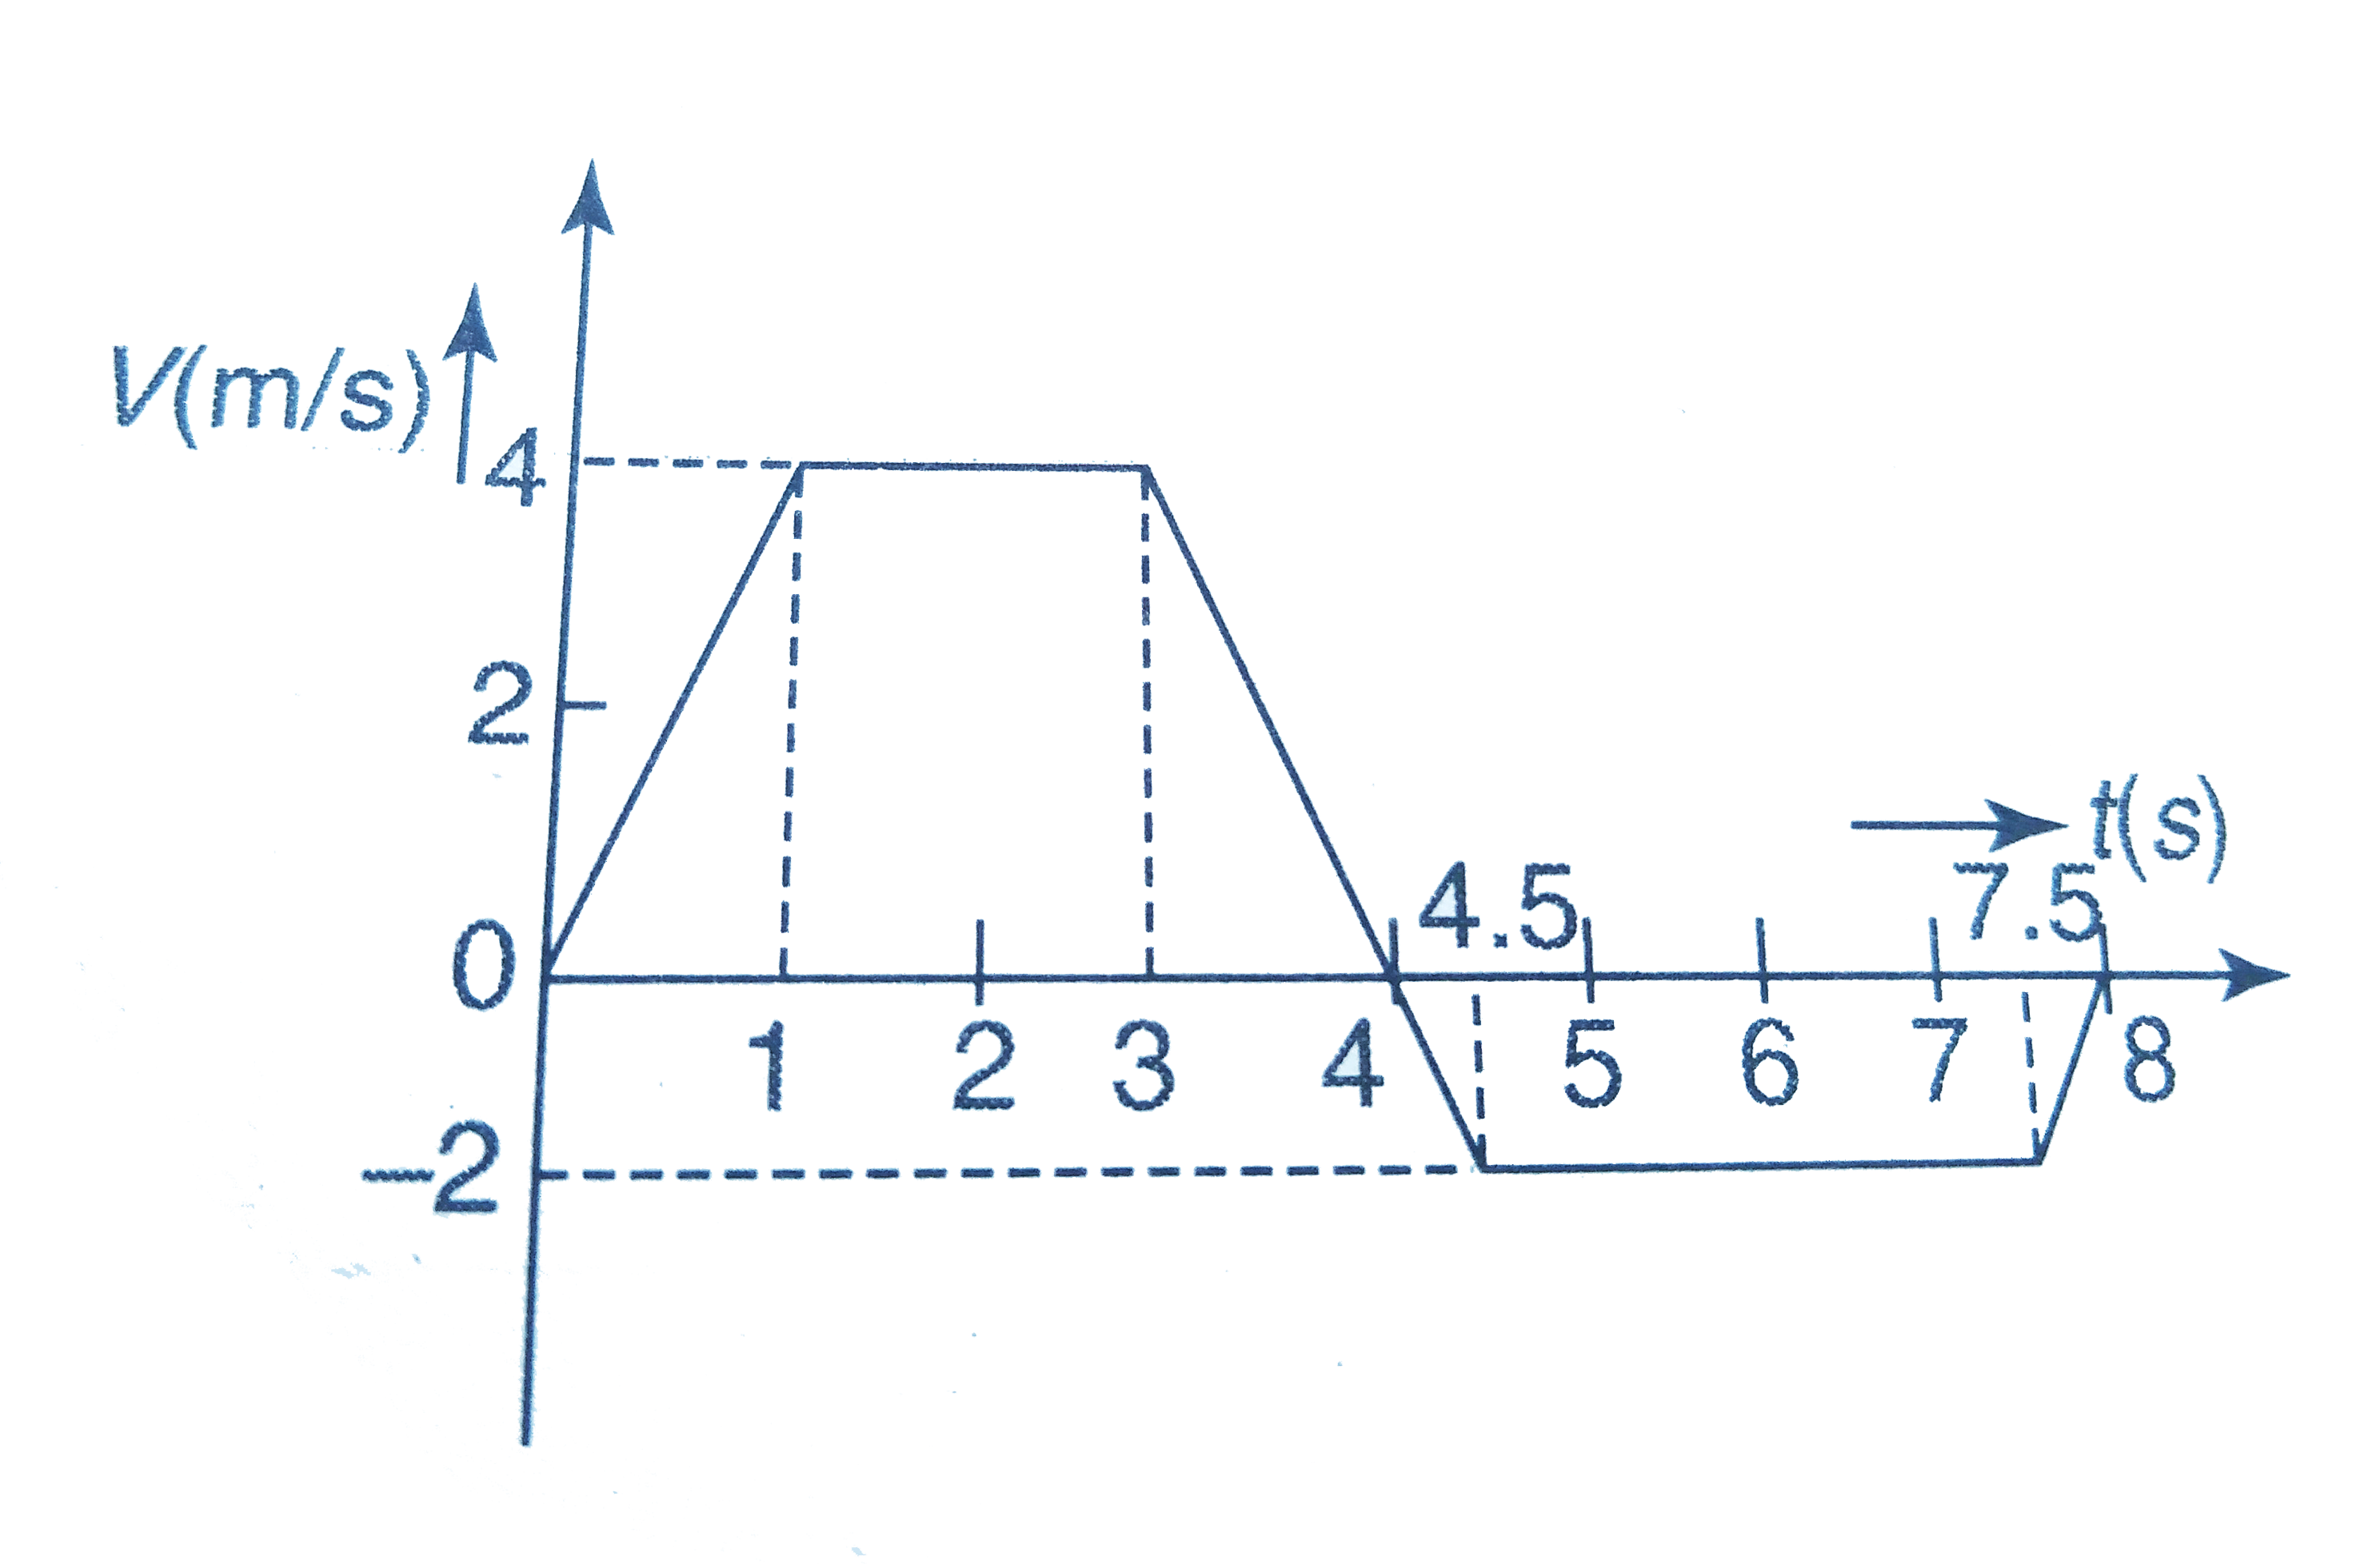
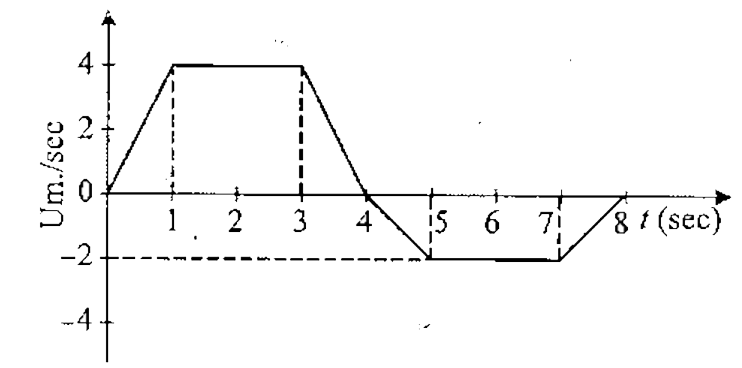
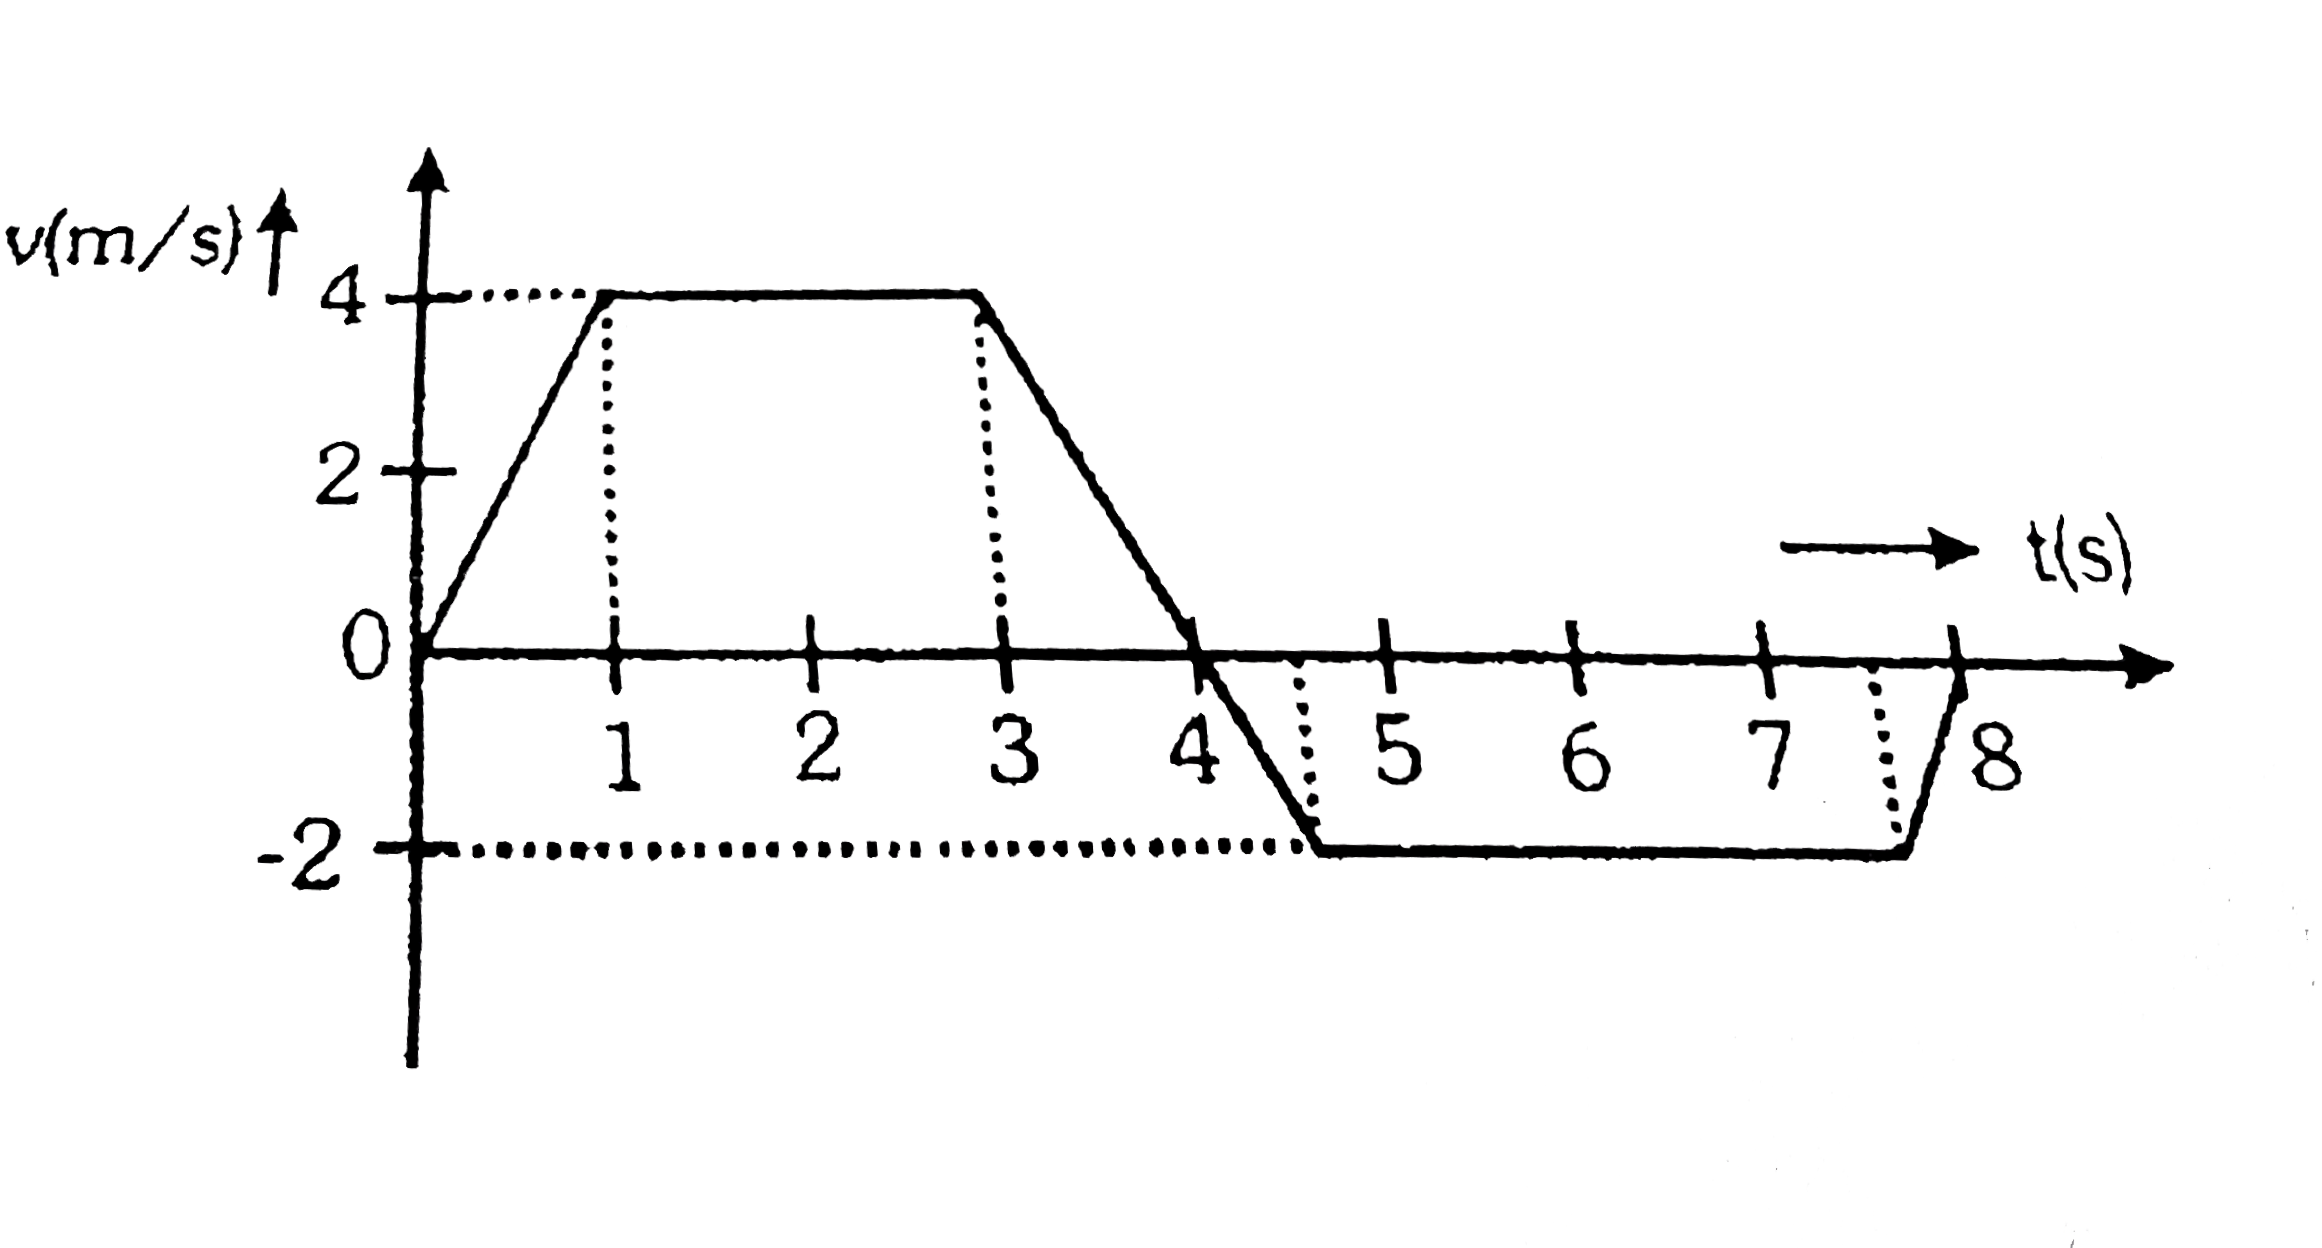
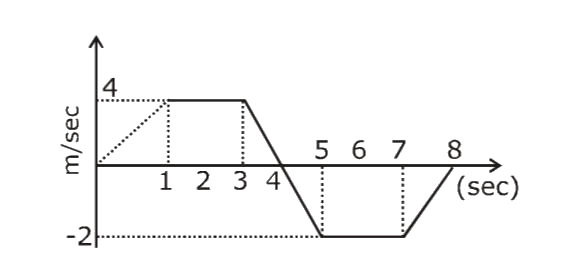
The velocity-time graph of a linear motion os shown figure. The distance from the starting point after 8sec is.
5 m
16 m
8 m
19 m
The correct Answer is:A
Distance from the starting point is equal to displacement.
Displacement = area of v−t graph
=12[4+2]4−12[4+3]×2=5m
Here distance travelled is not asked, but the distance from the the starting point.
Topper's Solved these Questions
- BOOK - A2ZCHAPTER - GENERAL KINEMATICS AND MOTION IN ONE DIMENSIONEXERCISE - Problem Based On Mixed Concepts30videos
GENERAL KINEMATICS AND MOTION IN ONE DIMENSION
- BOOK - A2ZCHAPTER - GENERAL KINEMATICS AND MOTION IN ONE DIMENSIONEXERCISE - Assertion Reasoning20videos
GENERAL KINEMATICS AND MOTION IN ONE DIMENSION
- BOOK - A2ZCHAPTER - GENERAL KINEMATICS AND MOTION IN ONE DIMENSIONEXERCISE - Relative Motion In One Dimension20videos
GENERAL KINEMATICS AND MOTION IN ONE DIMENSION
- BOOK - A2ZCHAPTER - FLUID MECHANICSEXERCISE - Chapter Test29videos
FLUID MECHANICS
- BOOK - A2ZCHAPTER - GRAVITATIONEXERCISE - Chapter Test29videos
GRAVITATION
Similar Questions
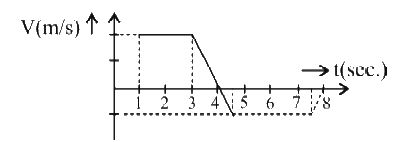
The velocity-time graph of a linear motion is shown in figure. The displacement from the origin after 8 sec is :
 View Solution
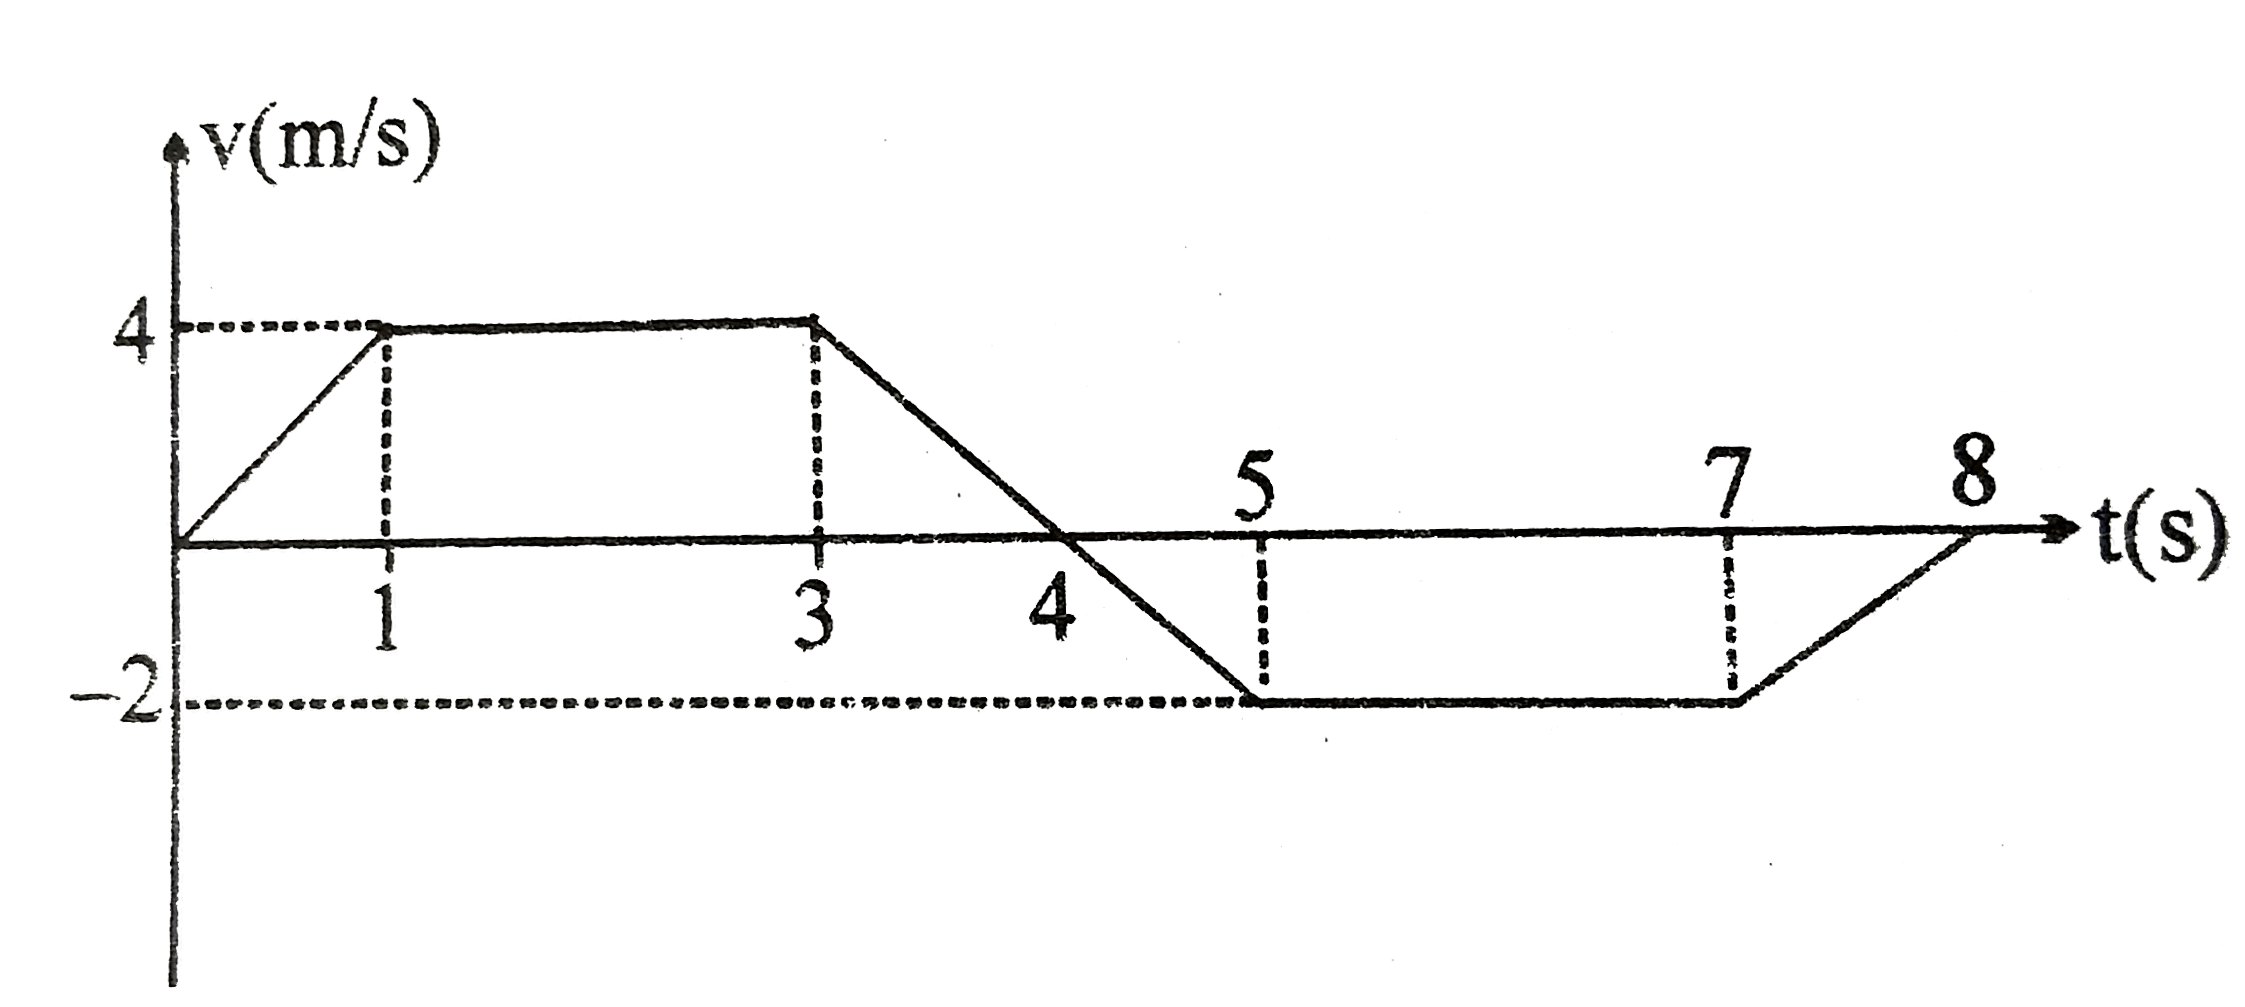
The velocity-time graph of a linear motion is shown below. Find the (a) displacement and distance from the origin after 8s. (b) acceleration in the first second. (c) deceleration during the 5th second. (d) maximum speed during the motion.
 View Solution
Knowledge Check
- Question 1 - Select One
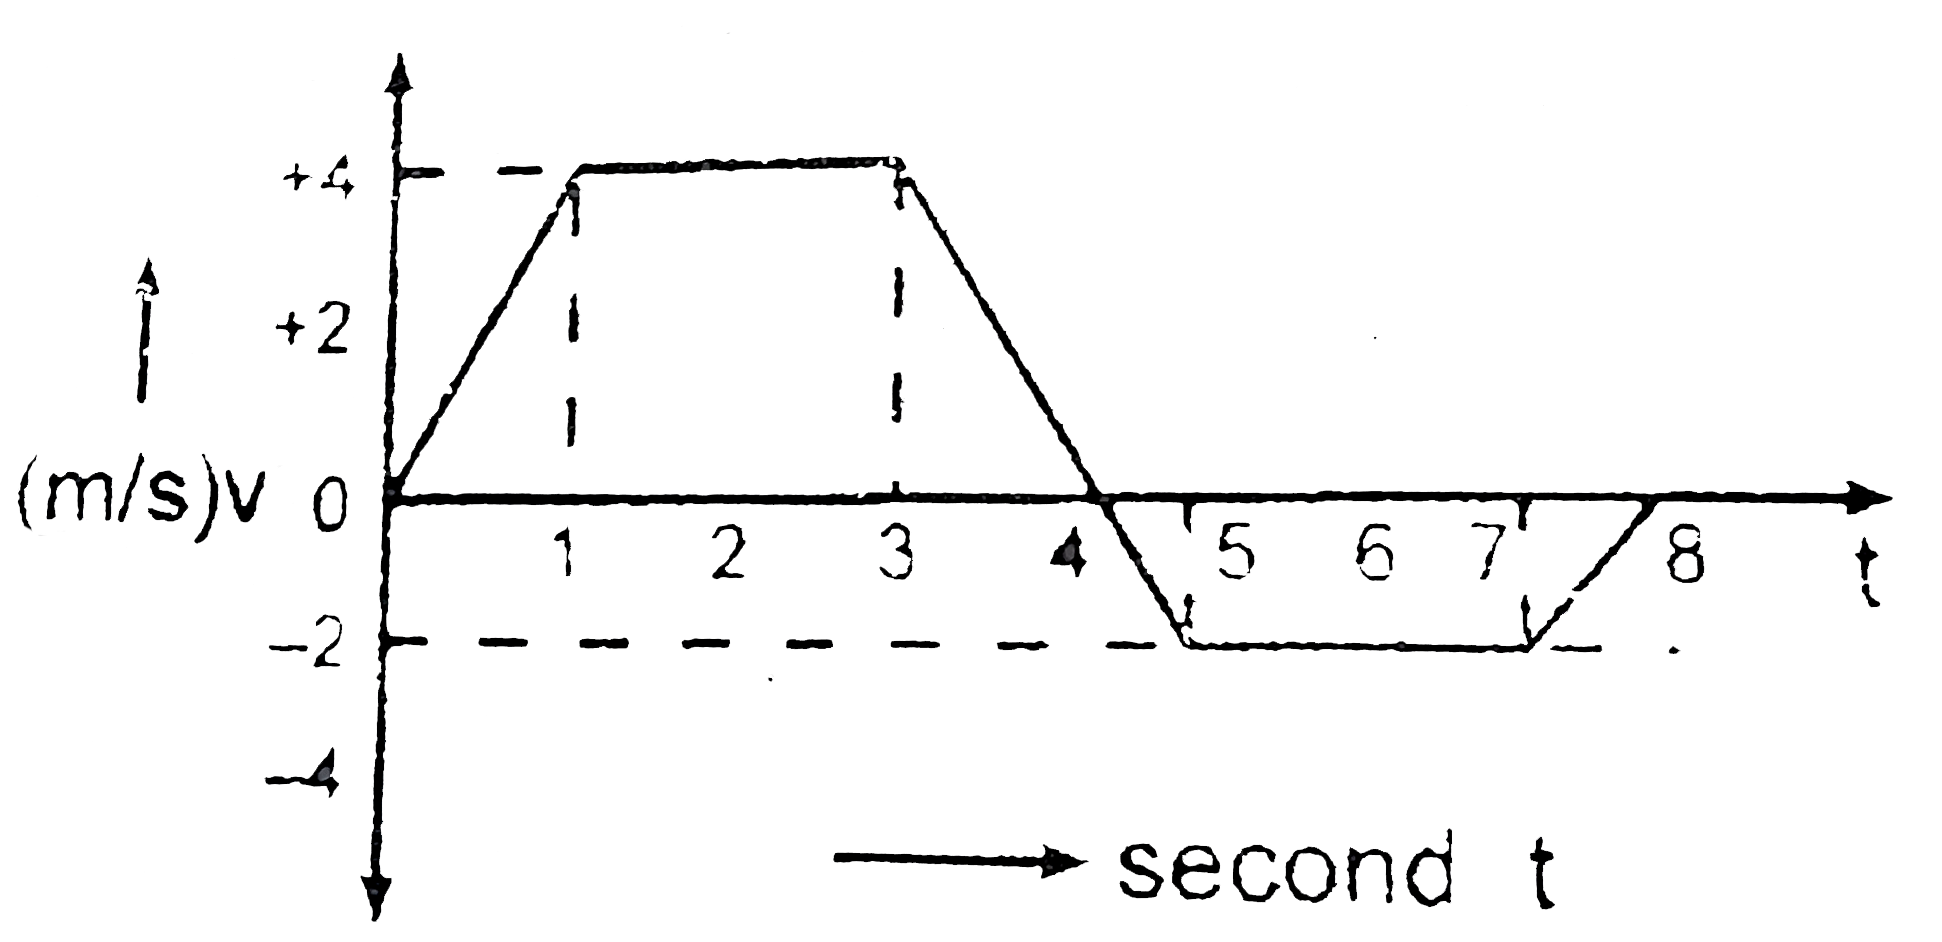
The velocity time graph of a linear motion is shown in the figure. The distance from the starting point after 8 seconds will be
 .A18 mB6 mC8 mDnone of these
 - Question 2 - Select One
The velocity-time graph of a linear motion is shown below. The distance from the origin after 8 seconds is :
 A18 mB16 mC8 mD6 m
 - Question 3 - Select One
The velocity-time graph of a linear motion is shown in figure. The displacement & distance from the origin after 8 sec is :-
 A5m,19mB16m,22mC8m,19mD6m,5m
If velocity-time graph of a body is as shown in figure, what is the nature of motion ?
View SolutionThe velocity − time graph of a particle is as shown in figure
 View Solution
The v-t graph of a linear motion is shown in adjoining figure. The distance from origin after 8 seconds is -
 View Solution
velocity time graph of a particle is shown in figure. Find displacement of the particle.
 View Solution
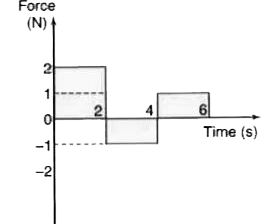
A force-time graph for a linear motion is shown in figure. The linear momentum gained between 0 and 6 second is
 View Solution

