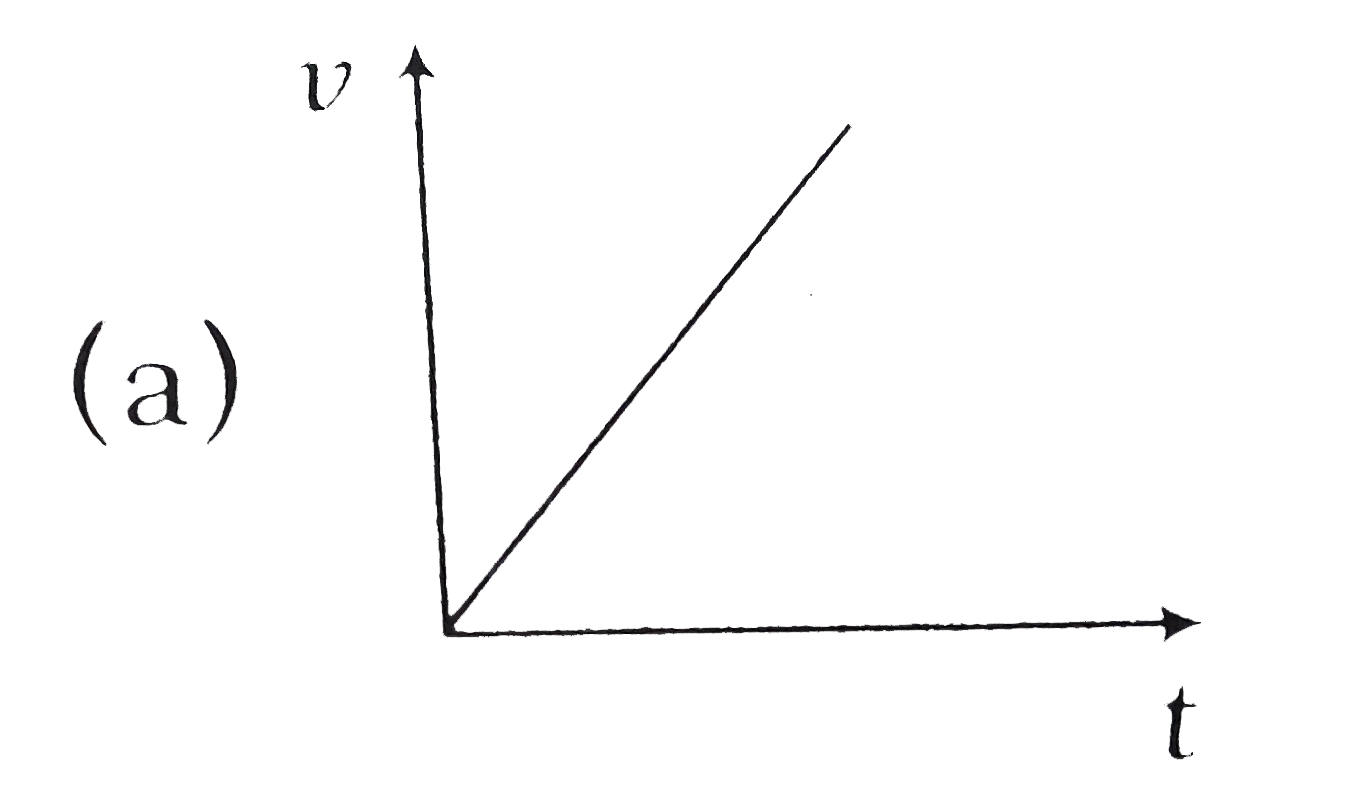
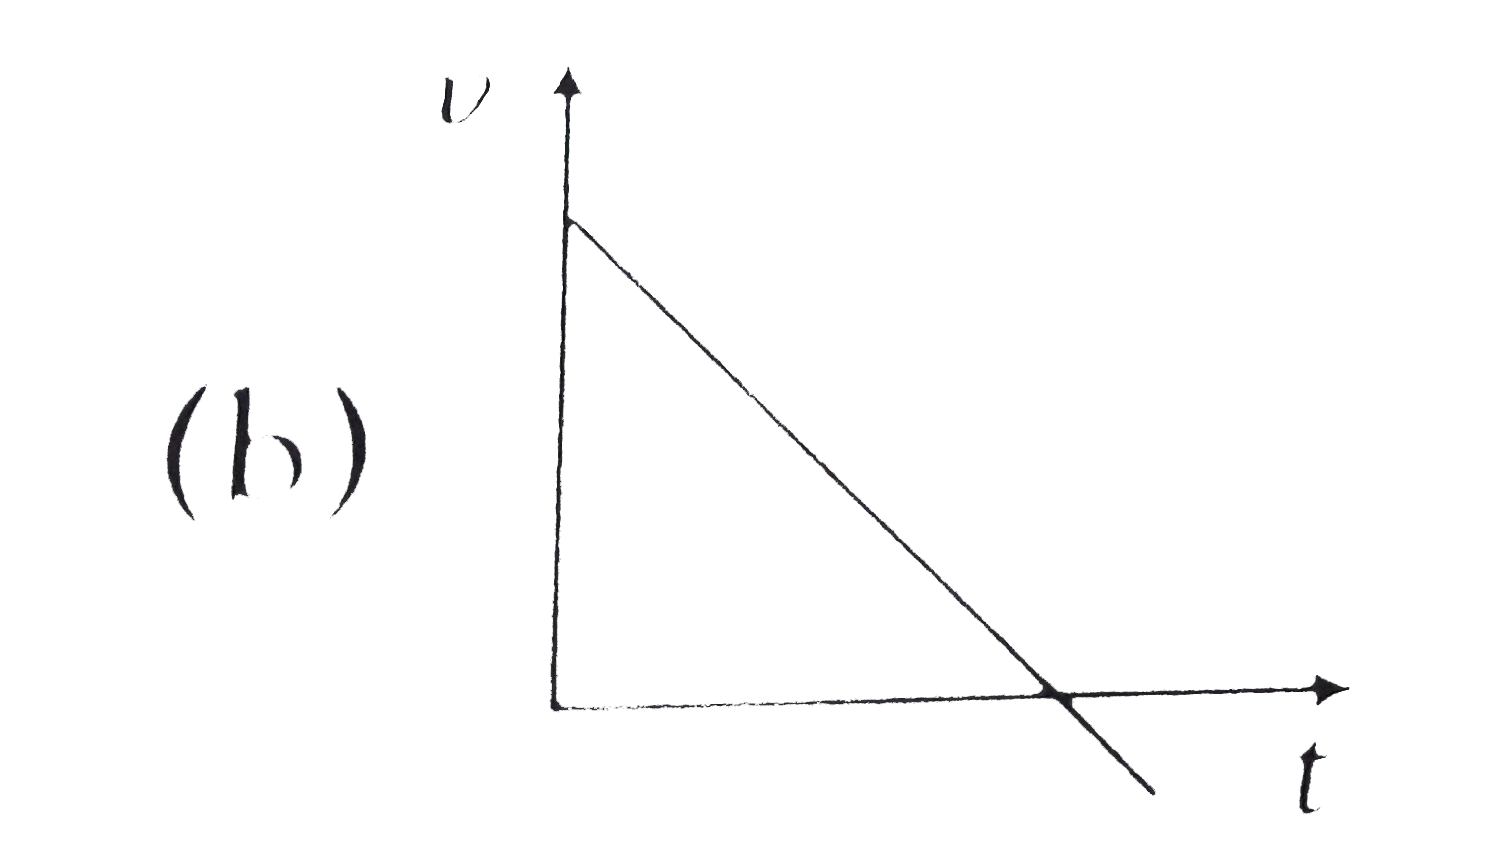
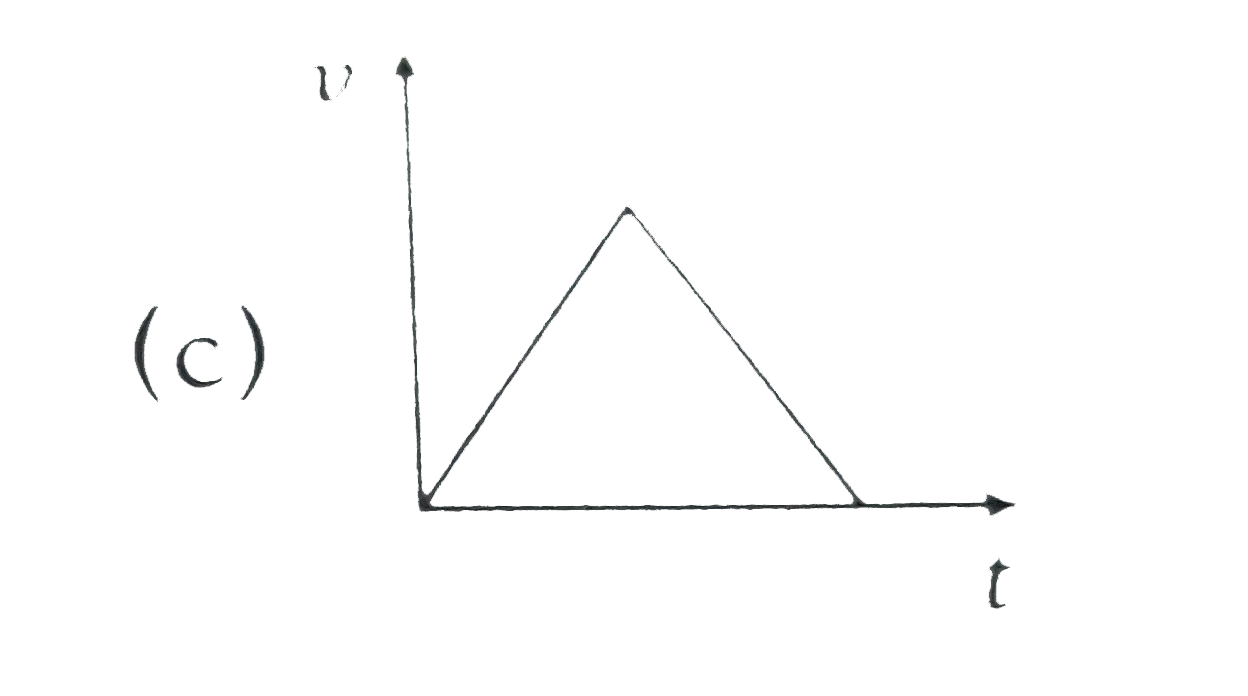
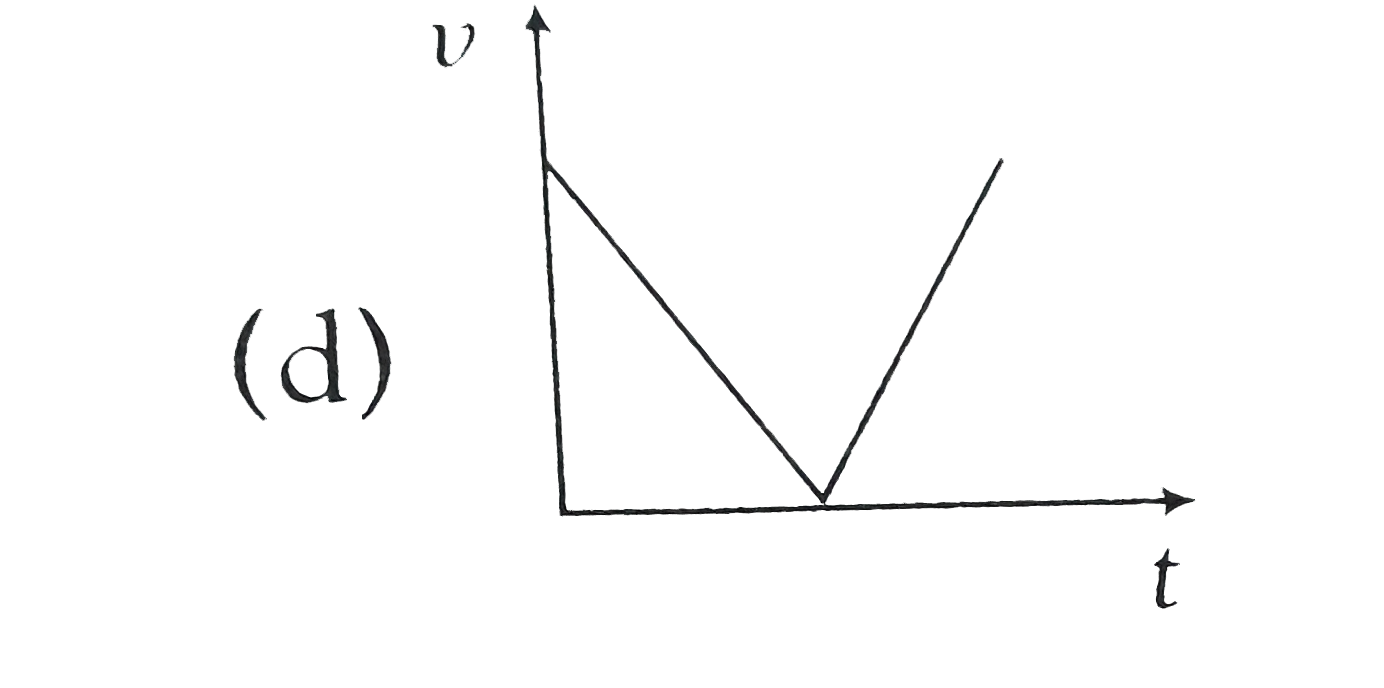
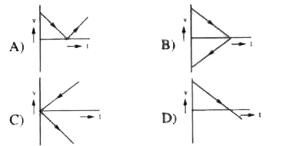
Which of the following graph correctly represents velocity-time relationship for a particle released from rest to fall freely under gravity ?
The correct Answer is:A
To determine the correct velocity-time relationship for a particle released from rest and falling freely under gravity, we can follow these steps:
Step 1: Understand the initial conditions
- A particle is released from rest, which means its initial velocity (u) is 0 m/s.
Step 2: Identify the acceleration
- The particle falls freely under the influence of gravity, which means it experiences a constant acceleration (a) equal to the acceleration due to gravity (g). The value of g is approximately 9.81 m/s² (or can be approximated as 10 m/s² for simplicity in calculations).
Step 3: Use the equation of motion
- The relevant equation of motion that relates velocity (V), initial velocity (u), acceleration (a), and time (t) is given by:
V=u+at
- Substituting the known values:
- u=0 (initial velocity)
- a=g (acceleration due to gravity)
This simplifies to:
V=0+gt
or
V=gt
Step 4: Analyze the relationship
- The equation V=gt indicates that velocity (V) is directly proportional to time (t). This means that as time increases, the velocity also increases linearly.
Step 5: Graphical representation
- A linear relationship between V and t, starting from the origin (0,0), indicates that the graph will be a straight line with a positive slope. The slope of this line represents the acceleration due to gravity (g).
Conclusion
- Therefore, the correct graph that represents the velocity-time relationship for a particle released from rest to fall freely under gravity is a straight line passing through the origin, indicating that velocity increases linearly with time.
Final Answer
- The correct option is A, which shows a straight line graph starting from the origin.
---
- A particle is released from rest, which means its initial velocity (u) is 0 m/s.
- The particle falls freely under the influence of gravity, which means it experiences a constant acceleration (a) equal to the acceleration due to gravity (g). The value of g is approximately 9.81 m/s² (or can be approximated as 10 m/s² for simplicity in calculations).
- The relevant equation of motion that relates velocity (V), initial velocity (u), acceleration (a), and time (t) is given by:
V=u+at
- Substituting the known values:
- u=0 (initial velocity)
- a=g (acceleration due to gravity)
V=0+gt
or
V=gt
- The equation V=gt indicates that velocity (V) is directly proportional to time (t). This means that as time increases, the velocity also increases linearly.
- A linear relationship between V and t, starting from the origin (0,0), indicates that the graph will be a straight line with a positive slope. The slope of this line represents the acceleration due to gravity (g).
- Therefore, the correct graph that represents the velocity-time relationship for a particle released from rest to fall freely under gravity is a straight line passing through the origin, indicating that velocity increases linearly with time.
- The correct option is A, which shows a straight line graph starting from the origin.
Topper's Solved these Questions
- BOOK - DC PANDEY ENGLISHCHAPTER - MOTION IN A PLANEEXERCISE - Check point 3.715videos
MOTION IN A PLANE
- BOOK - DC PANDEY ENGLISHCHAPTER - MOTION IN A PLANEEXERCISE - (A) Taking it together75videos
MOTION IN A PLANE
- BOOK - DC PANDEY ENGLISHCHAPTER - MOTION IN A PLANEEXERCISE - Check point 3.525videos
MOTION IN A PLANE
- BOOK - DC PANDEY ENGLISHCHAPTER - MOTIONEXERCISE - Medical entrances gallery19videos
MOTION
- BOOK - DC PANDEY ENGLISHCHAPTER - PROJECTILE MOTIONEXERCISE - Level - 2 Subjective10videos
PROJECTILE MOTION
Similar Questions
Knowledge Check
- Question 1 - Select One
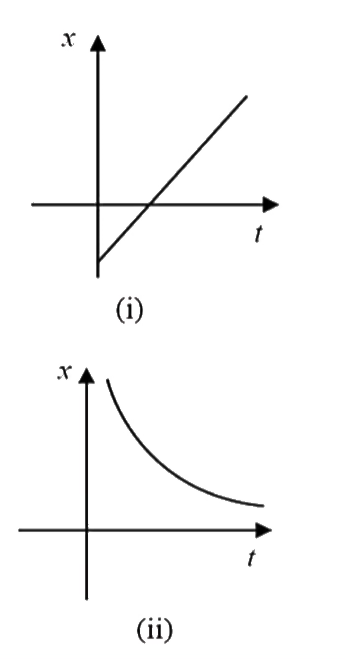
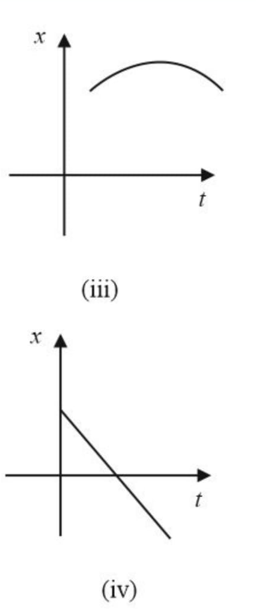
Which of the following graphs represents the position time-graph of a particle moving with negative velocity?
A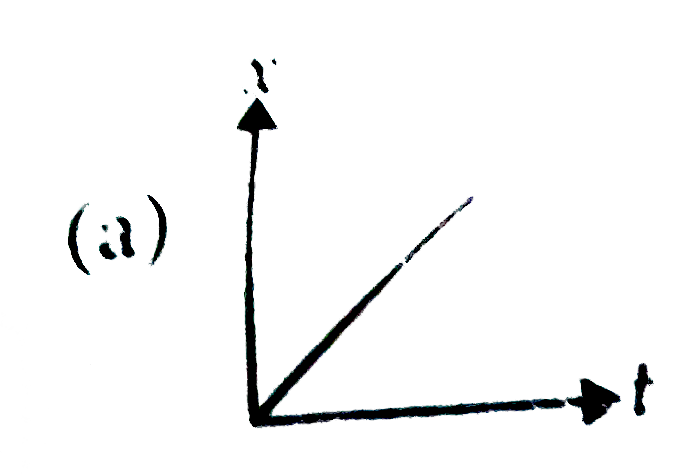 B
B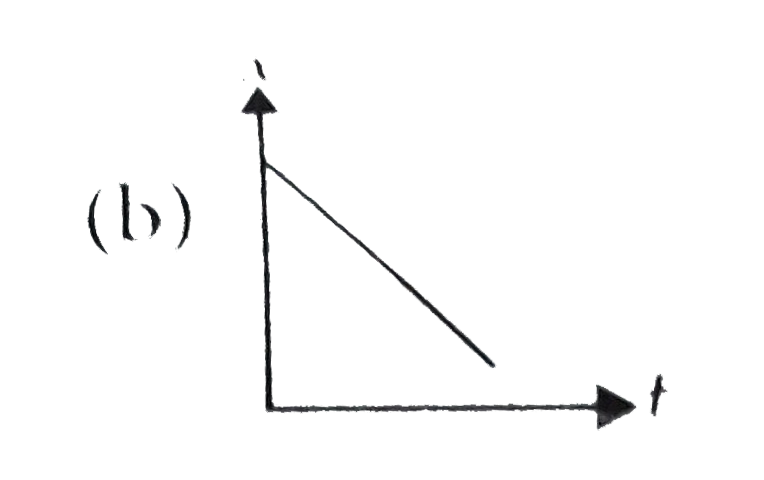 C
C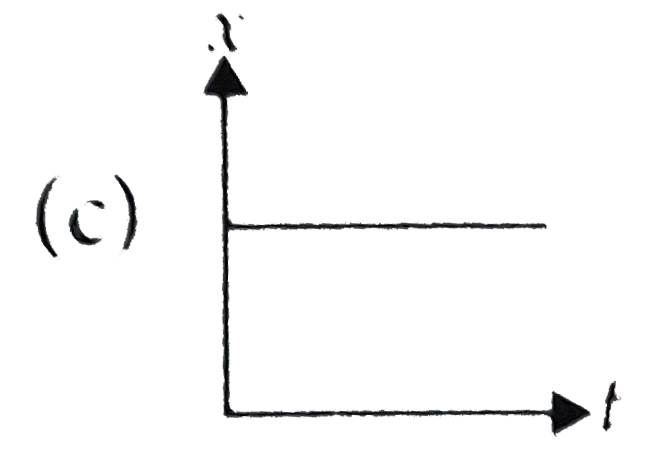 D
D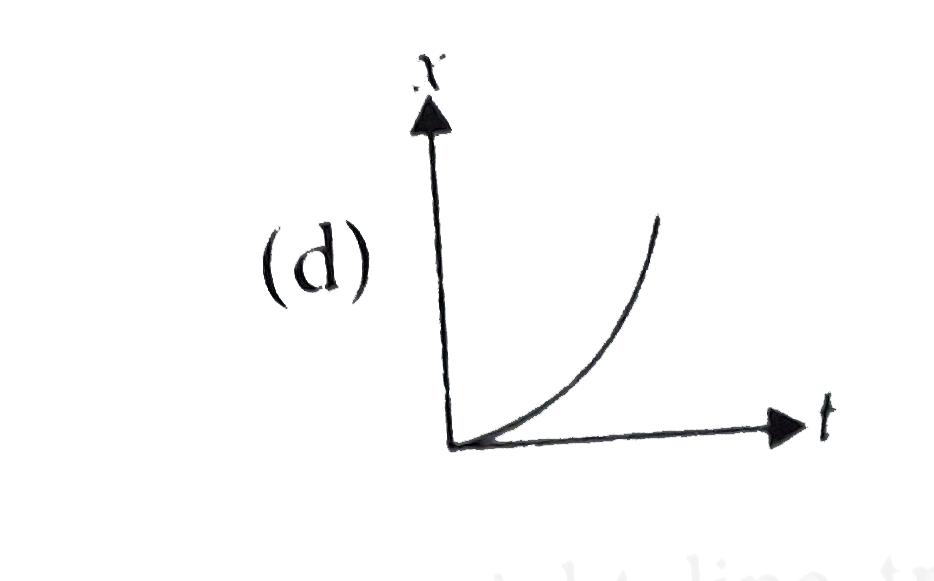
Which of the following x-t graphs represents the distance-time variation of a body released from the top of a buiding?
View SolutionWhich of following graphs correctly represents the variation of particle momentum with de-Broglie wavelength?
View SolutionWhich of the following graphs represents the motion of a particle moving with constant velocity?
 View Solution
The velocity − time graph of a particle is as shown in figure
 View Solution
Which of the following velocity-time graphs represent uniform motion
View SolutionA ball is thrown vertically upwards. Which of the following graph/graphs represent velocity-time graph of the ball during its flight (air resistance is neglected)
 View Solution
Which of the following position-time graphs correctly represents two moving objects A and B with zero relative velocity ?
View Solution
