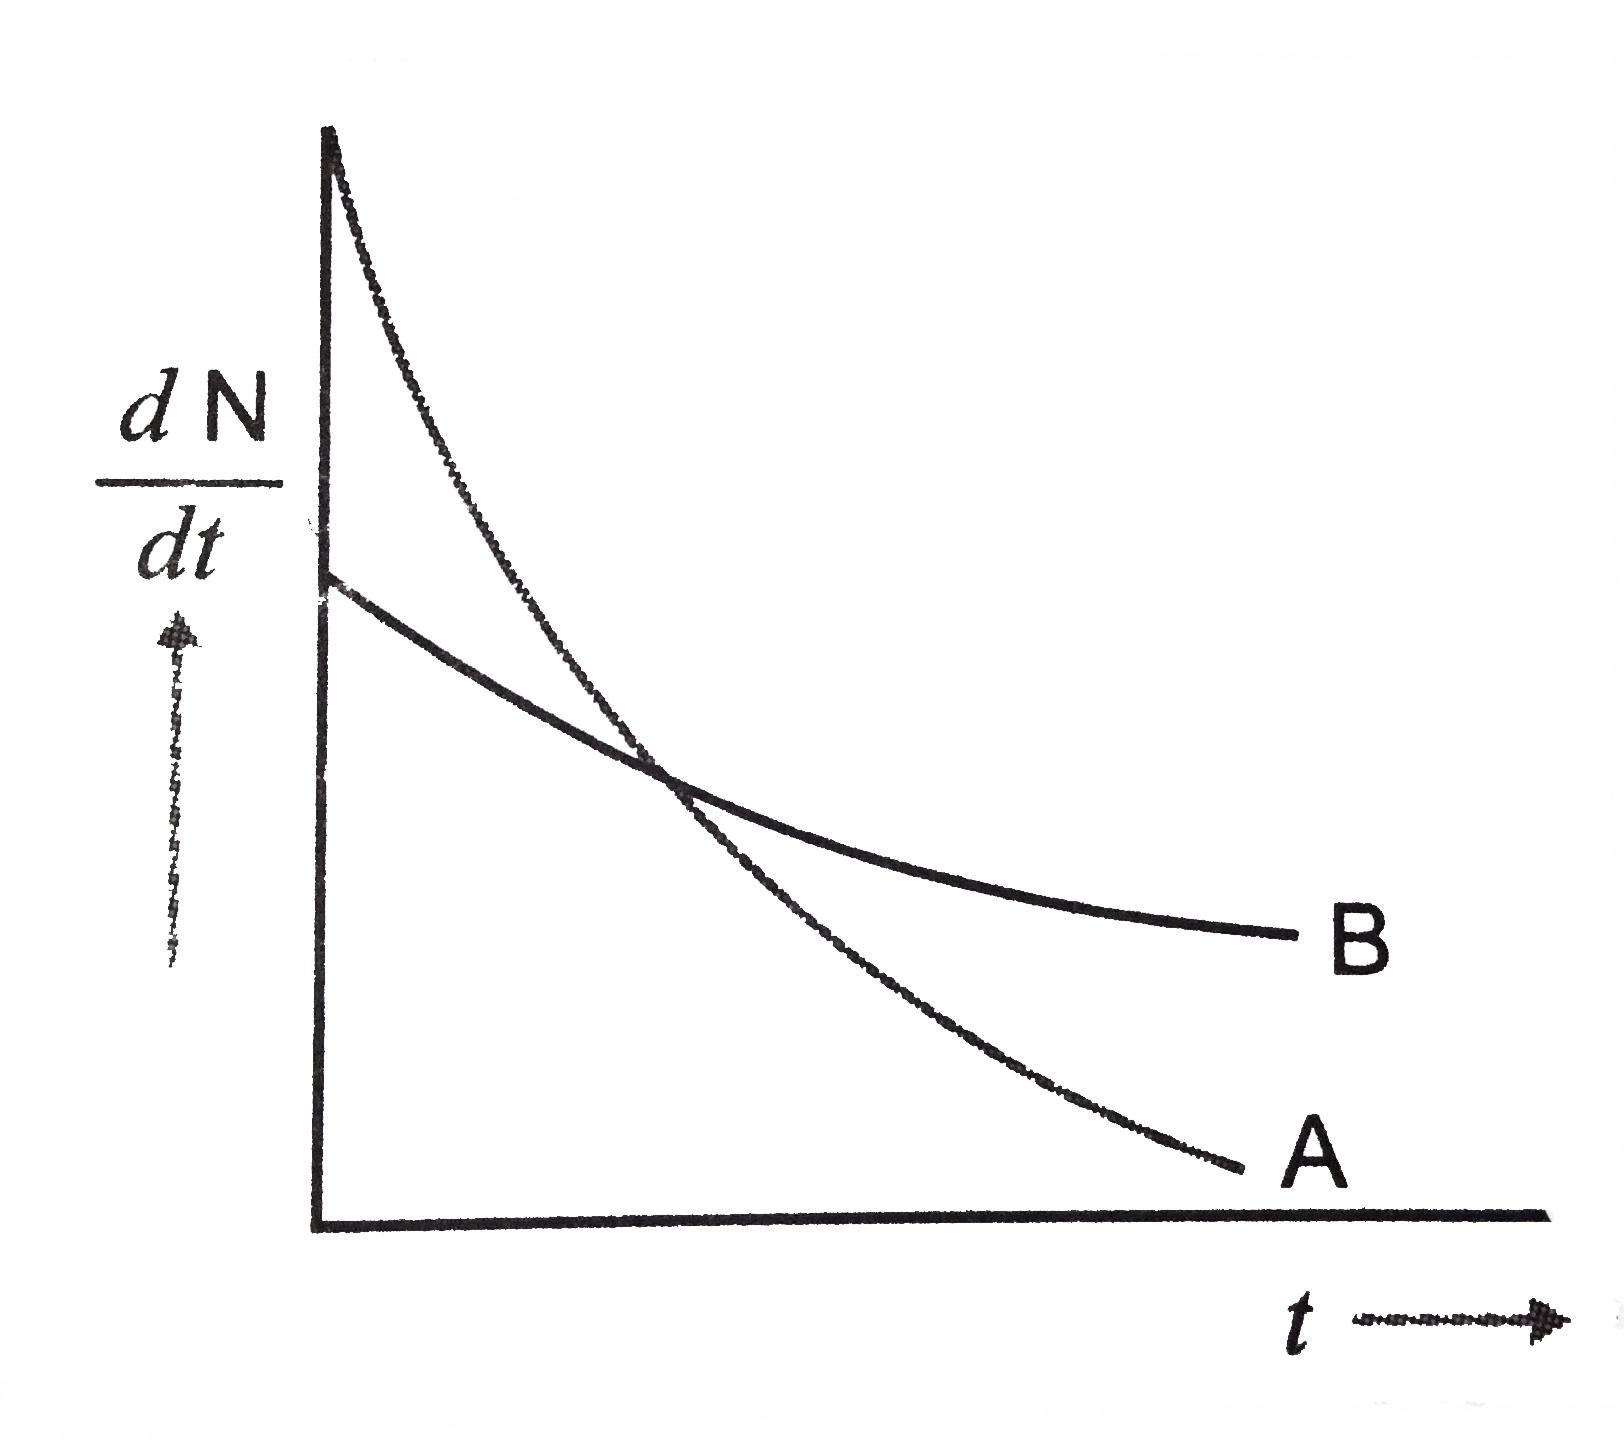
Which sample A or B shown in figure has shorter mean-life ?
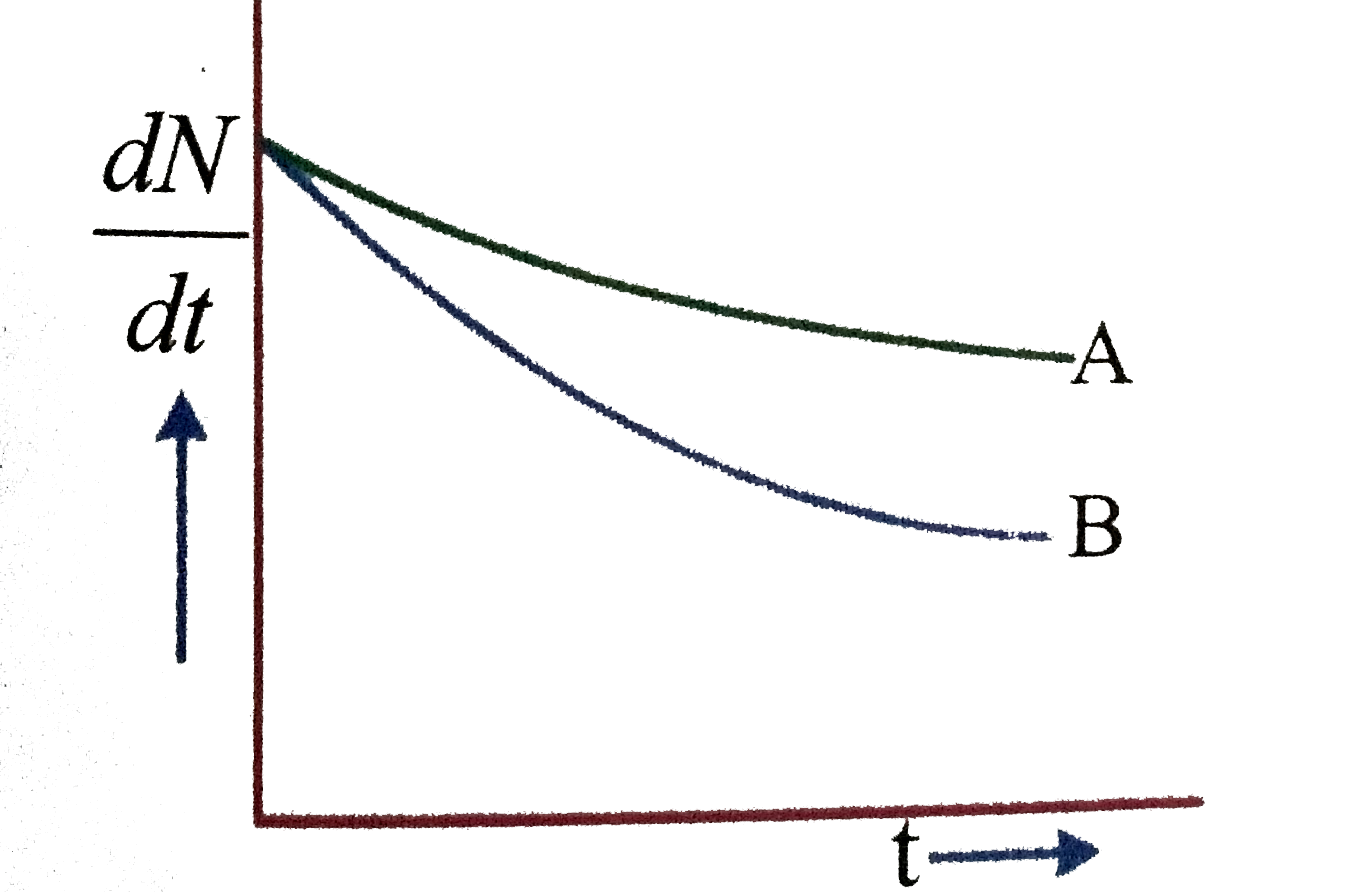
from the given figure we can say that
at t=0.(dNdt)A−(dNdt)B
⇒ (N0)A=(N0)B
Considering any instant t by drawing a line perpendicular to time axis we find that
(dNdt)A>(dNdt)B ,ltBrgt ⇒ λANA>λBNB
∴ NA>NB (rate of decay of B is slower)
∴ λB>λA ,
∴ λB>λA
⇒ τA>τB [∴Average lifeτ=1λ]
Topper's Solved these Questions
Similar Questions
Which phenomenon is shown in figure ?
 View Solution
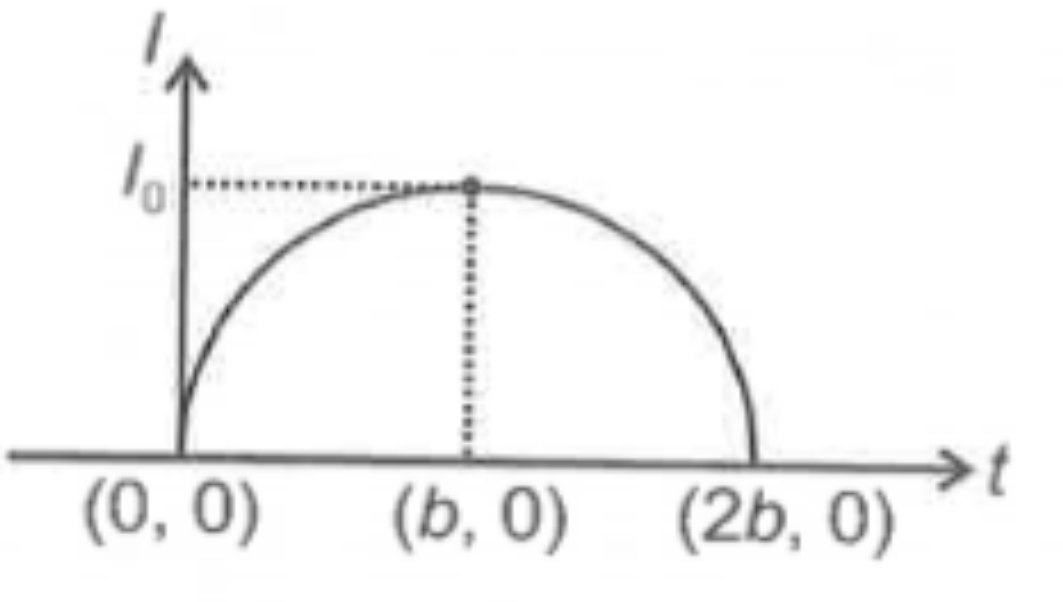
The mean value of semi-circular current wave form as shown in figure for time interval t = 0 to t = 2b is
 View Solution
The initial and final velocities of an object are as shown in figure(a). Which arrows shown in figure(b) can be represent average acceleration vector?
 View Solution
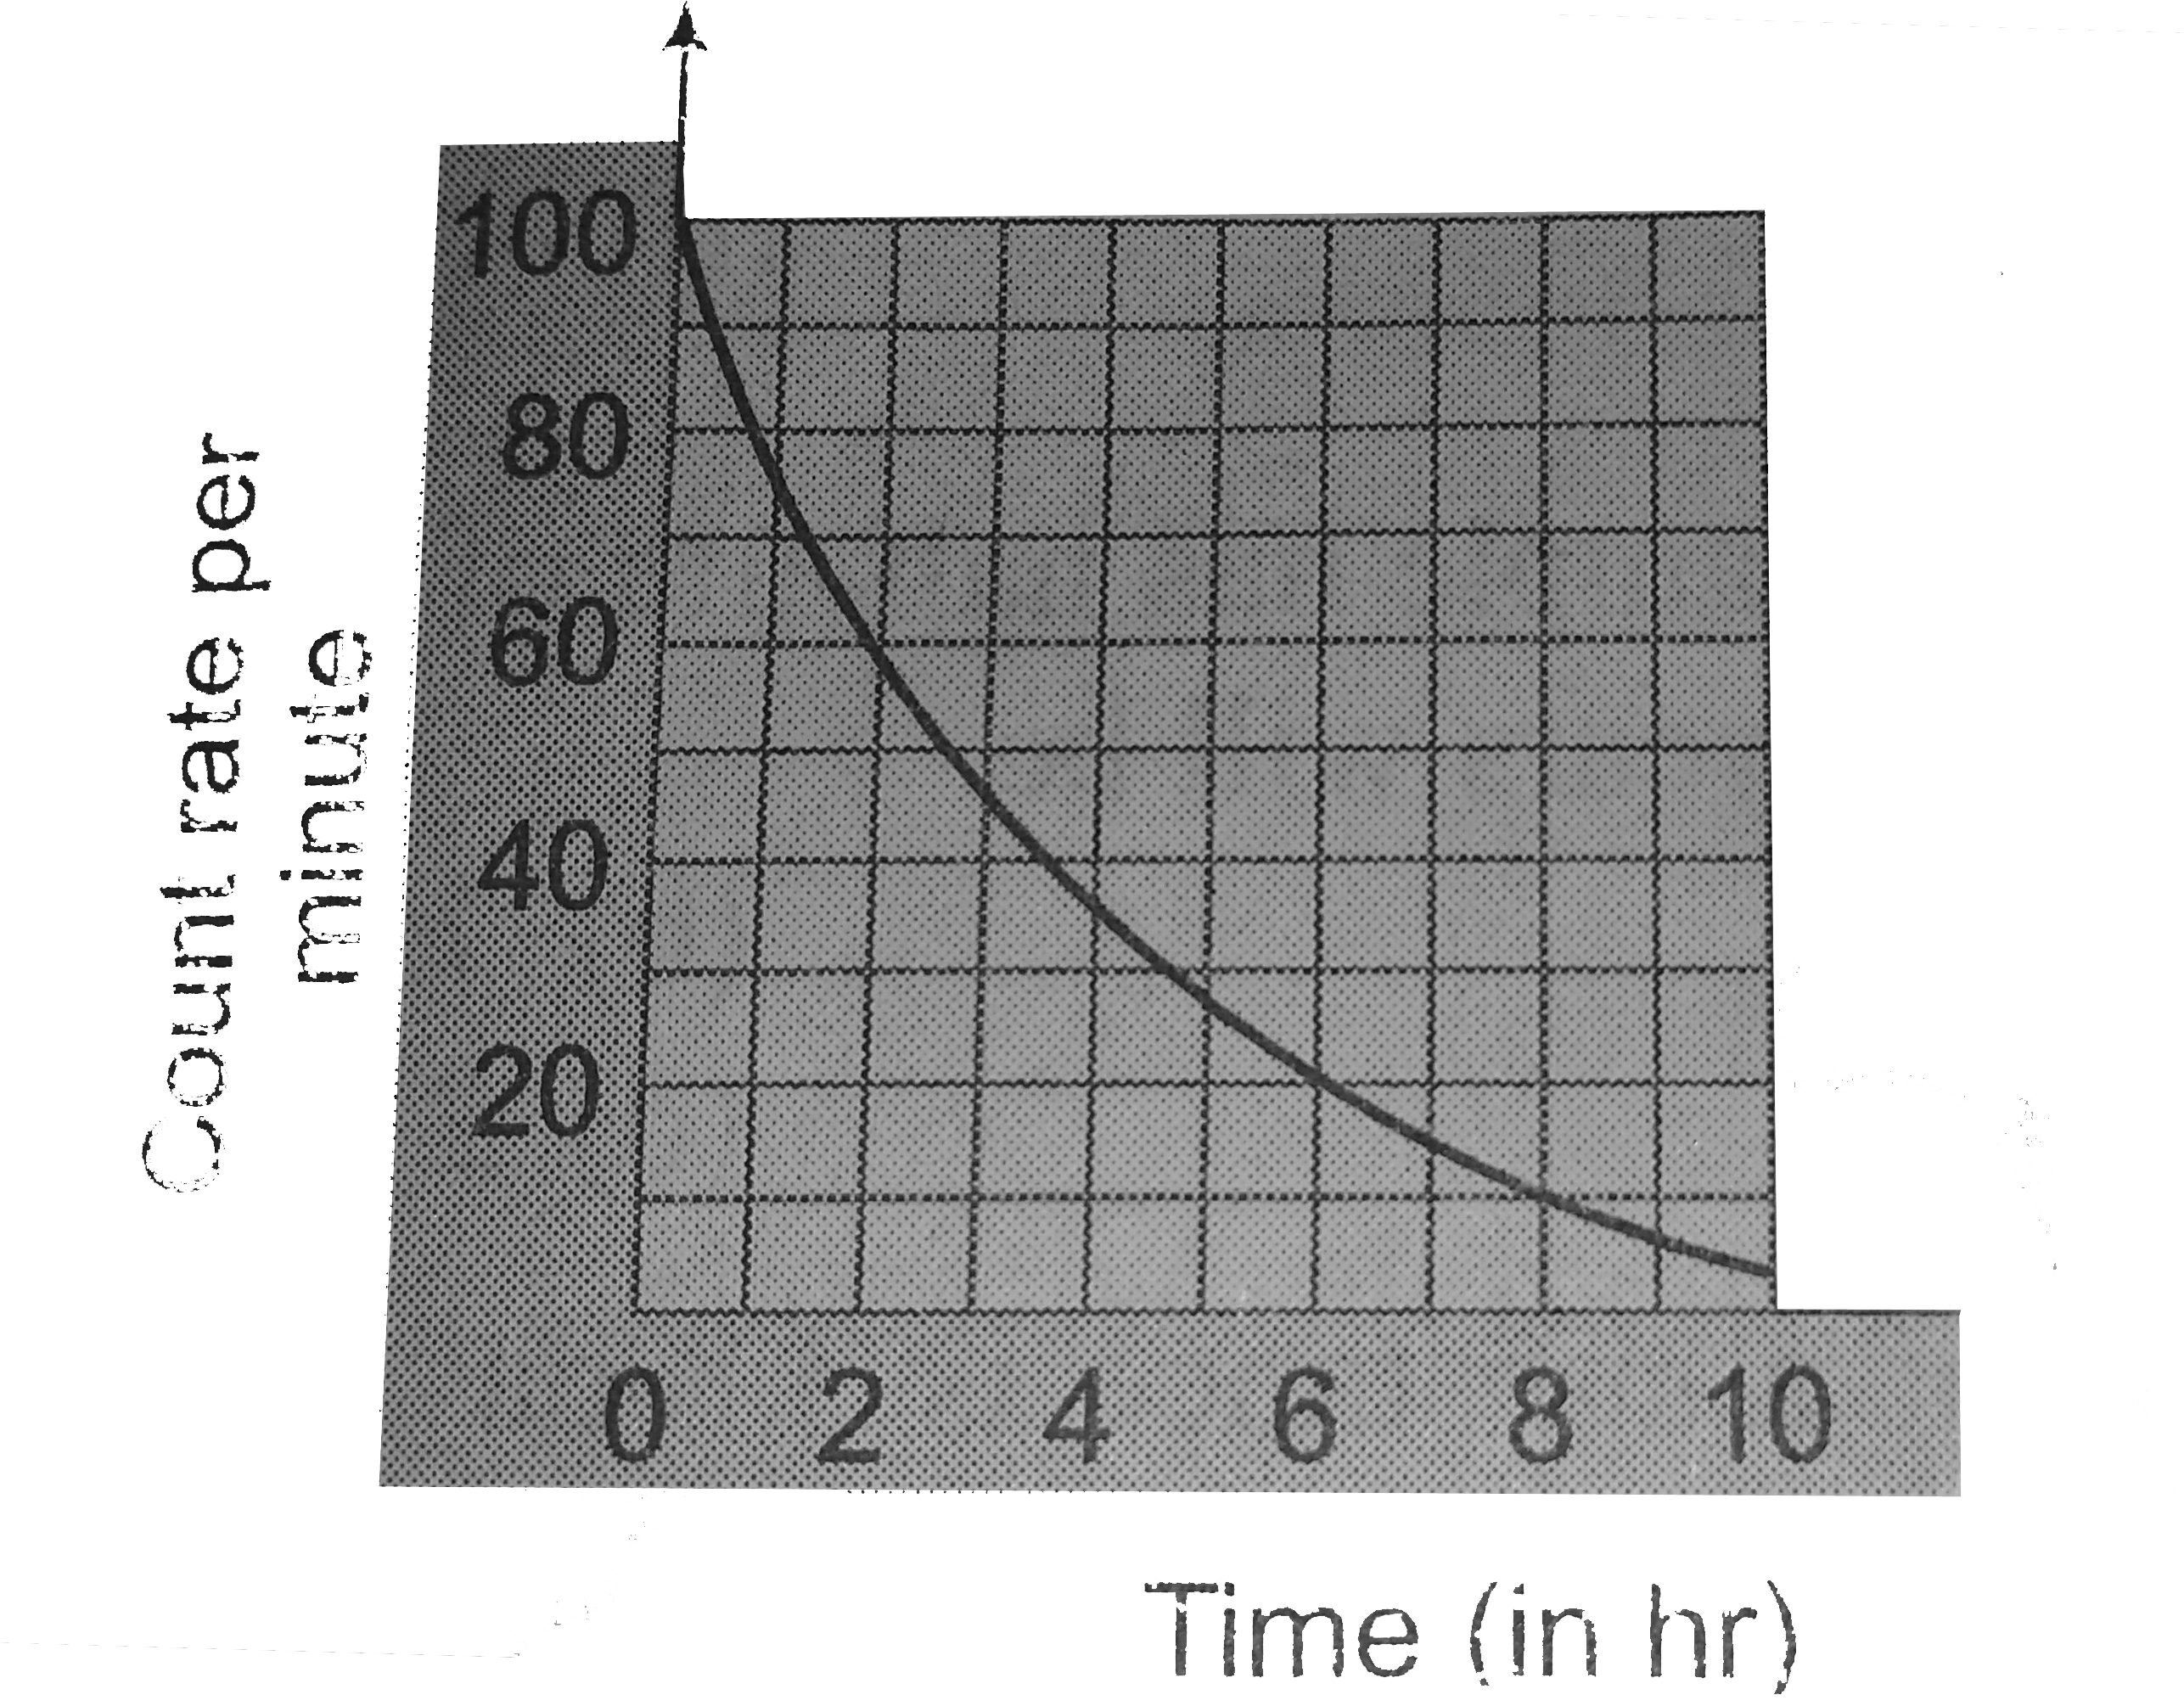
The count rate of 10g of radioactive material was measured at different times and times has been shown in the figure. The half-life of material and the total counts (approximately) in the first half life period, respectively are.
 .View Solution
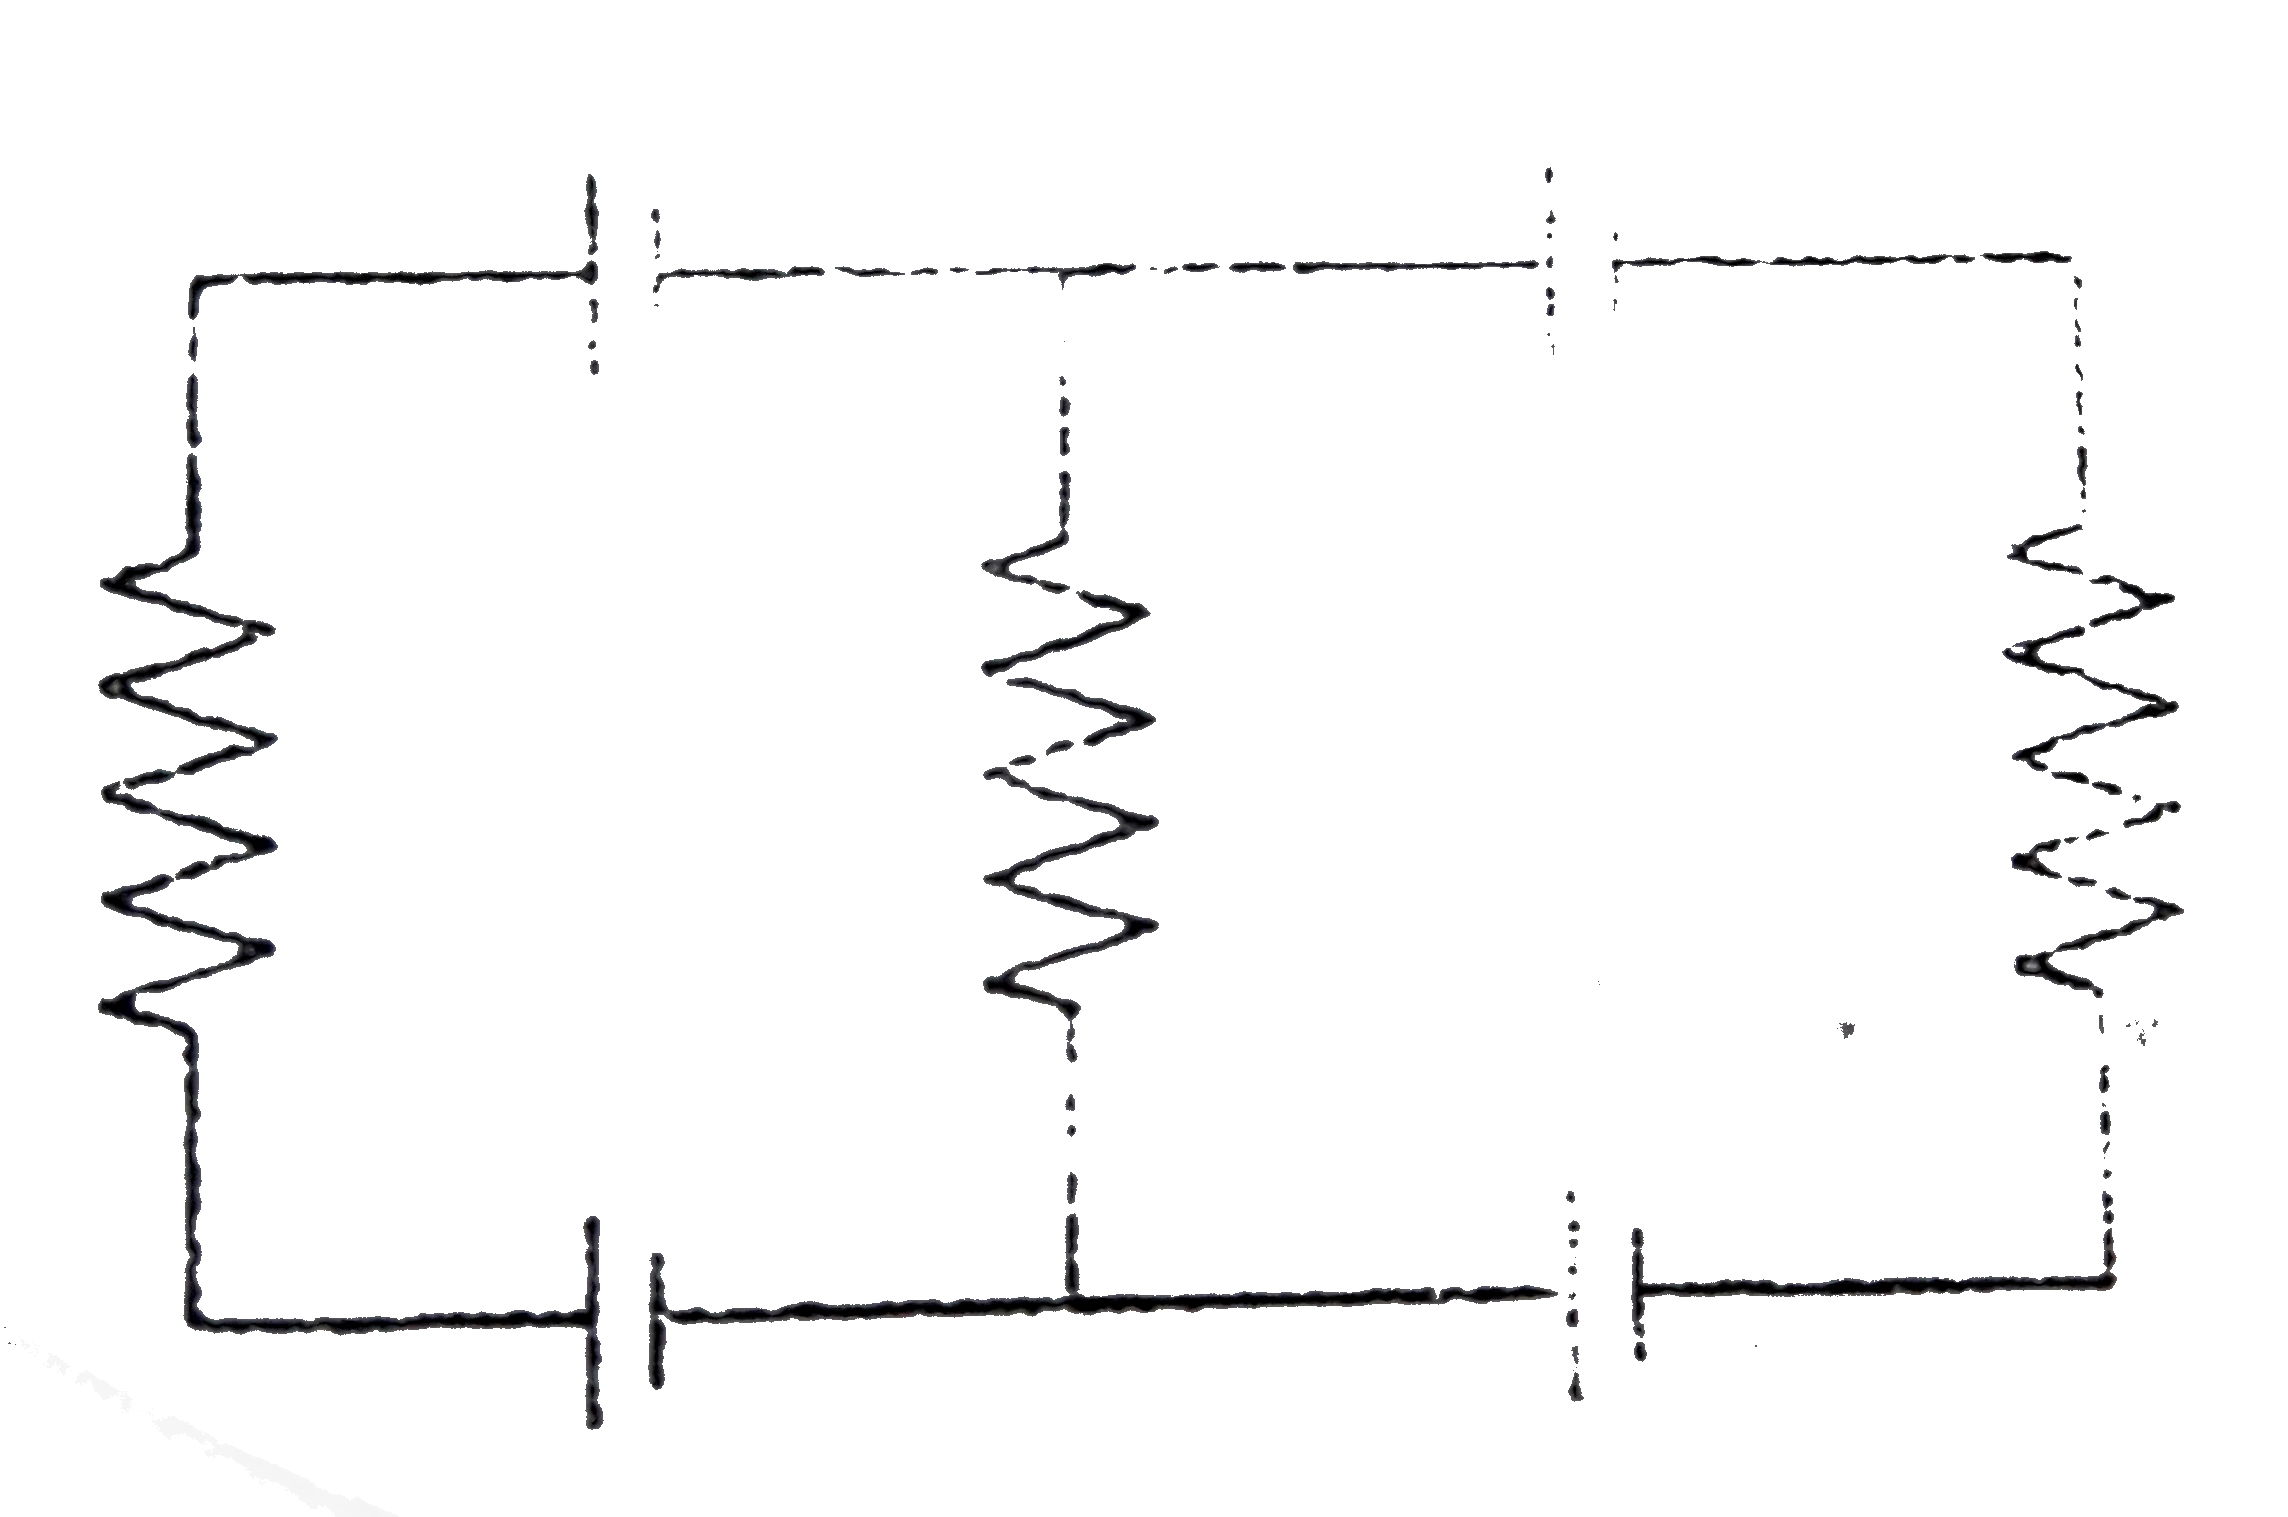
Each of the batteries shown in figure has an emt equal to 10V.Find the magnetic field B at the point p.
 View Solution
What is common to the species shown in figures A and B ?
 View Solution
What is comman to the species shown in figures A and B ?
 View Solution
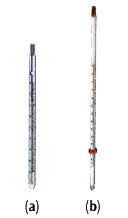
Which of the following statements is true?
a. A clinical thermometer is shown in Figure (a).
b. There is a kink present in the thermometer shown in Figure (b).
 View Solution
The variation of decay rate of two radioactive samples A and B with time is shown in fig.
Which of the following statements are true?View SolutionThe variation of decay rate of two radioactive samples A and B with time is shown in fig.

Which of the following statements are true?View Solution
