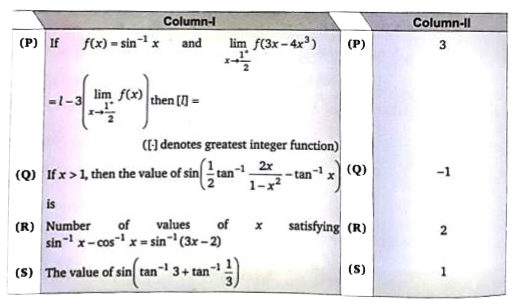
The correct Answer is:
Step by step video & image solution for by Maths experts to help you in doubts & scoring excellent marks in Class 12 exams.
Topper's Solved these Questions
- BOOK - VK JAISWAL ENGLISHCHAPTER - INVERSE TRIGONOMETRIC FUNTIONS EXERCISE - Exercise-5 : Subjective Type Problems6videos
INVERSE TRIGONOMETRIC FUNTIONS
- BOOK - VK JAISWAL ENGLISHCHAPTER - INVERSE TRIGONOMETRIC FUNTIONS EXERCISE - Exercise-3 : Comprehension Type Problems2videos
INVERSE TRIGONOMETRIC FUNTIONS
- BOOK - VK JAISWAL ENGLISHCHAPTER - INDEFINITE AND DEFINITE INTEGRATIONEXERCISE - EXERCISE (SUBJECTIVE TYPE PROBLEMS)29videos
INDEFINITE AND DEFINITE INTEGRATION
- BOOK - VK JAISWAL ENGLISHCHAPTER - LIMITEXERCISE - EXERCISE (SUBJECTIVE TYPE PROBLEMS)7videos
LIMIT
Similar Questions
The complete set of values of x satisfying the inequality sin−1(sin5)>x2−4x is (2−√λ−2π,2+√λ−2π), then λ=
03:47View SolutionLet cos−1(4x3−3x)=a+bcos−1x
Q. If x∈[−12,12], then sin−1(sinab) is :01:37View Solution∫x+(cos−13x)2√1−9x2dx=1k1(√1−9x2+(cos−13x)k2)+c, then k21+k22= (where C is an arbitrary constnat. )
06:07View SolutionIf limx→0lncot(π4−βx)tanax=1, then αβ=.....
02:11View SolutionIdentify the cell organelle 'A' :-
ltimg src="https://d10lpgp6xz60nq.cloudfront.net/physics_images/ALN_BIO_C10_E08_018_Q01.png" width="80%"gt01:31View SolutionHow many lines of symmetry does the above figure have ?
02:45View SolutionWhich of the following are correct chain isomers of butane ? (i)
02:17View SolutionDetermine the point of symmetry of a regular hexagon.
05:41View SolutionDtermine the images of the following figure about the given line :
02:21View SolutionMatch the following Column A to Column B
 02:03View Solution
Match the following Column A to Column B
 02:10View Solution
Match the following Column A to Column B
 02:17View Solution
Find the area of the figure given below.
 02:10View Solution
The area of the shaded part in the figure given below is ______.
 04:23View Solution
The inequation represented by the graph given below is :
01:42View SolutionThe inequation that best describes the graph given below is _________
03:12View Solution


