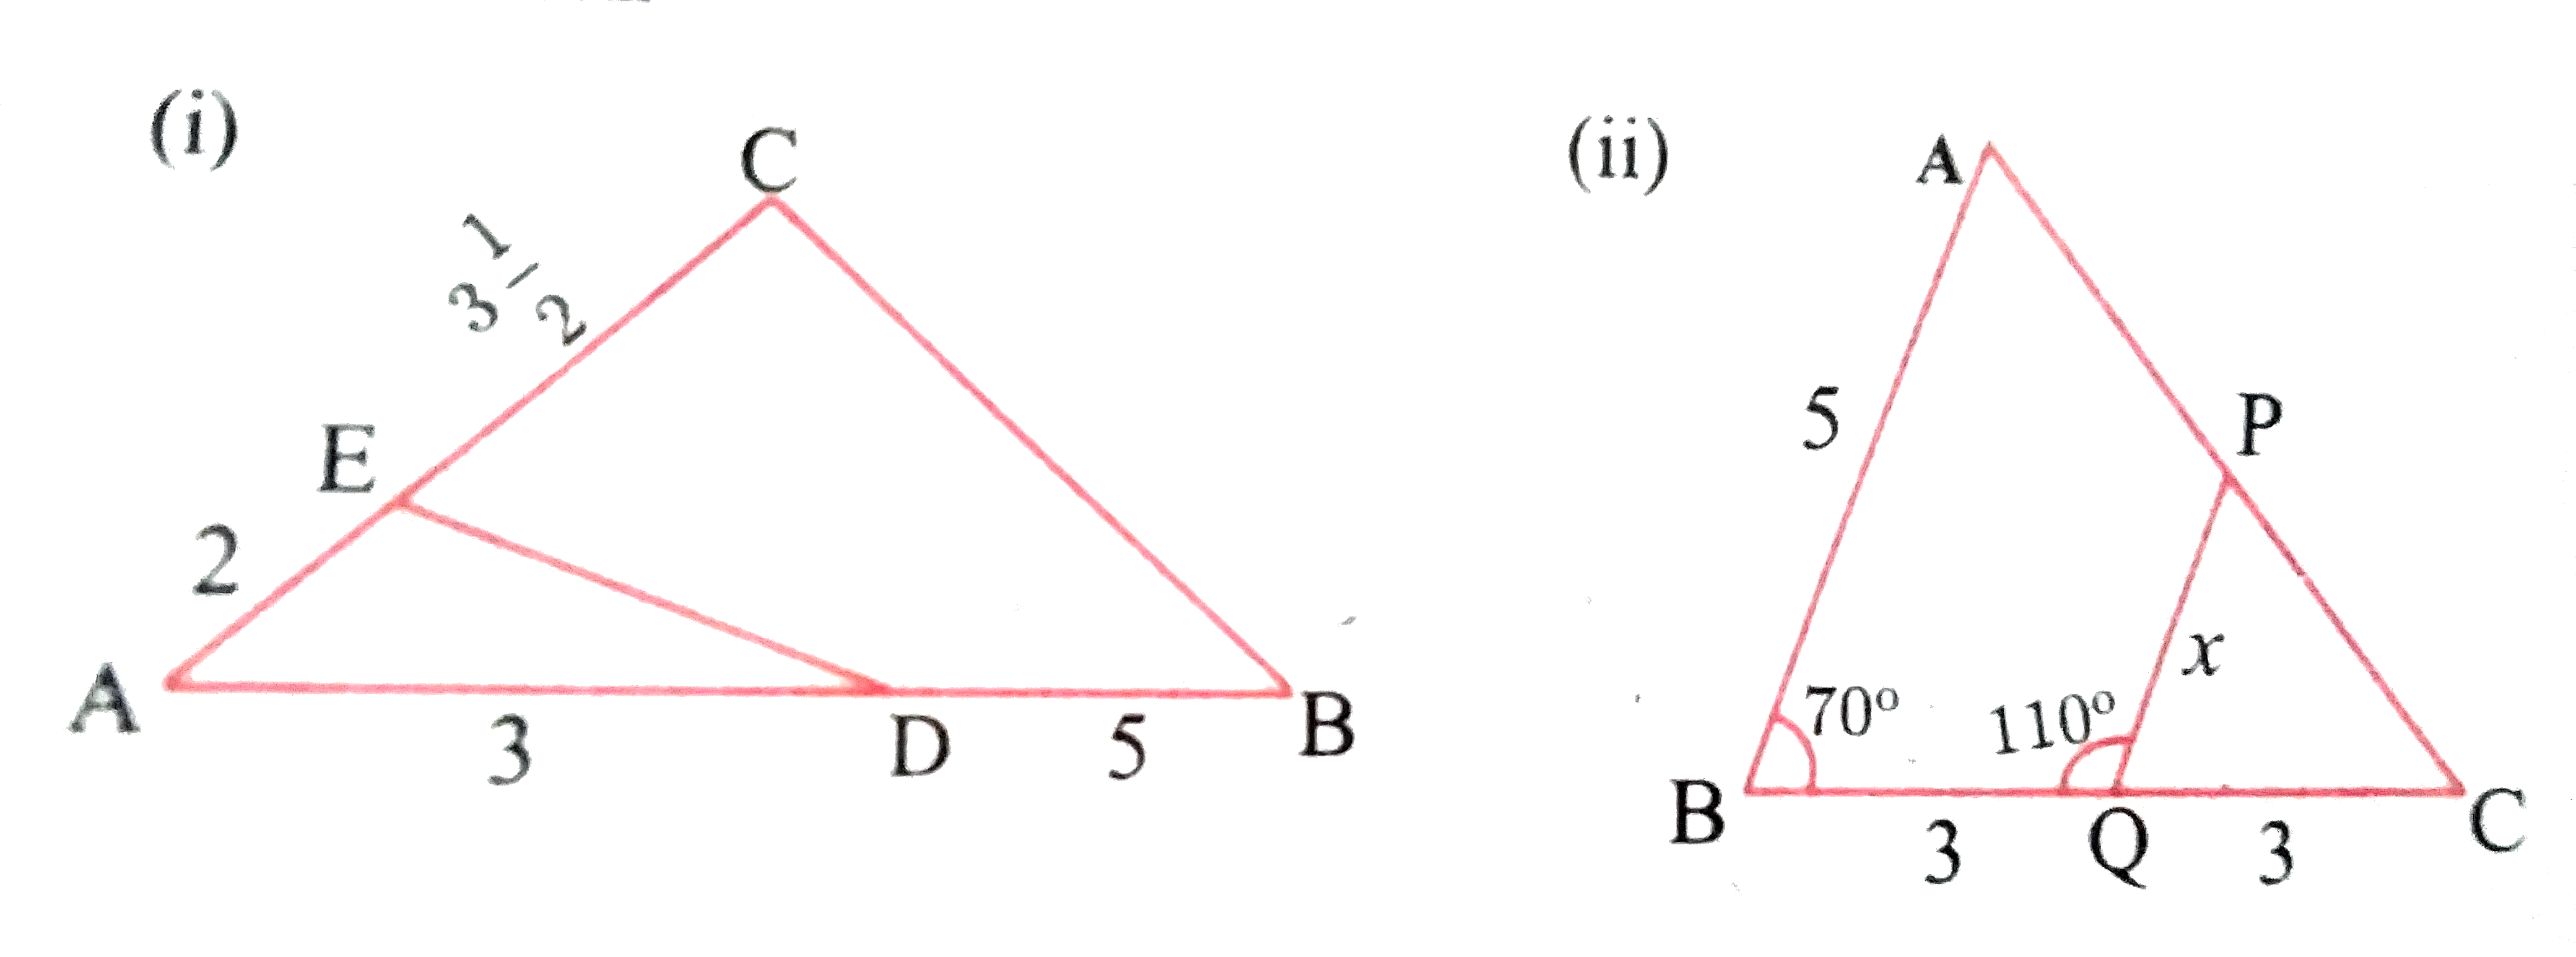
Check whether the which triangles are similar and find the value of x.
 Solution in Tamil
The correct Answer is:x = 2.5
Step by step video, text & image solution for Check whether the which triangles are similar and find the value of x. by Maths experts to help you in doubts & scoring excellent marks in Class 10 exams.
Updated on:21/07/2023Topper's Solved these Questions
- GEOMETRYBOOK - FULL MARKSCHAPTER - GEOMETRYEXERCISE - EXERCISE 4.2
17 Videos
- GEOMETRYBOOK - FULL MARKSCHAPTER - GEOMETRYEXERCISE - EXERCISE 4.3
8 Videos
- GEOMETRYBOOK - FULL MARKSCHAPTER - GEOMETRYEXERCISE - THINKING CORNER
2 Videos
- DEPARTMENTAL MODEL PAPER BOOK - FULL MARKSCHAPTER - DEPARTMENTAL MODEL PAPER EXERCISE - PART-IV
3 Videos
- MENSURATION BOOK - FULL MARKSCHAPTER - MENSURATION EXERCISE - ADDITIONAL QUESTIONS SOLVED (iii)
8 Videos
Similar Questions
In ΔABC, D and E are points on the sides AB and AC respectively such that DE∣∣BC
(i) If ADDB=34 and AC=15 cm find AE.
(ii) If AD=8x-7, DB=5x-3, AE= 4x-3 and EC=3x - 1, find the value of x.
View SolutionA man goes 18 m due east and then 24 m due north. Find the distance of his current position from the starting point ?
View SolutionCan we draw two tangents parallel to each other on a circle ?
View SolutionPQ is a chord of length 8 cm of a circle of radius 5 cm. The tangents at P and Q intersect at a point T . Find the length TP .
View SolutionA vessel is in the form of a hemispherical bowl mounted by a hollow cylinder. The diameter is 14 cm and the height of the vessel is 13 cm. Find the capacity of the vessel.
View SolutionWhich of the following are correct chain isomers of butane ? (i)
View SolutionDetermine the point of symmetry of a regular hexagon.
View SolutionMatch the following Column A to Column B

View SolutionMatch the following Column A to Column B

View SolutionMatch the following Column A to Column B

View SolutionFind the area of figure given below.

View SolutionFind the area of the figure given below.

View SolutionThe inequation represented by the graph given below is :
View SolutionThe inequation that best describes the graph given below is _________
View SolutionThe inequation that best describes the following graph is _________
View SolutionWhich inequations represent the shaded region in the given figure
View Solution
