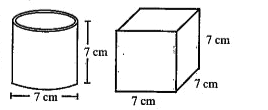
Describe how the two figures at the right are alike and how they are different. Which box has larger surface area?
 Solution in Punjabi
Step by step video & image solution for Describe how the two figures at the right are alike and how they are different. Which box has larger surface area? by Maths experts to help you in doubts & scoring excellent marks in Class 8 exams.
Updated on:21/07/2023Topper's Solved these Questions
- MENSURATIONBOOK - SWAN PUBLICATIONCHAPTER - MENSURATIONEXERCISE - Exercise 11.4
10 Videos
- MENSURATIONBOOK - SWAN PUBLICATIONCHAPTER - MENSURATIONEXERCISE - Exercise 11.2
10 Videos
- LINEAR EQUATIONS IN ONE VARIABLE BOOK - SWAN PUBLICATIONCHAPTER - LINEAR EQUATIONS IN ONE VARIABLE EXERCISE - EXERCISE 2.6
14 Videos
- PLAYING WITH NUMBERSBOOK - SWAN PUBLICATIONCHAPTER - PLAYING WITH NUMBERSEXERCISE - Exercise 2
4 Videos
Similar Questions
Given a cylindrical tank, in which situation will you find surface area and in which situation volume: To find the number of smaller tanks that can be filled with water from it.
View SolutionThe shape of top sufrace of a table is a trapezium.Find its area if its parallel sides are 1 m and 1.2 m and perpendicular distance between them is 0.8 m.
View SolutionSolve the following equations. 8x−33x=2
View SolutionIf 21y5 is a multiple of 3 ,where,y is a digit,what is the value of y.
View SolutionHow many lines of symmetry does the above figure have ?
View SolutionWhich of the following are correct chain isomers of butane ? (i)
View SolutionDetermine the point of symmetry of a regular hexagon.
View SolutionDtermine the images of the following figure about the given line :
View SolutionMatch the following Column A to Column B

View SolutionMatch the following Column A to Column B

View SolutionMatch the following Column A to Column B

View SolutionFind the area of figure given below.

View SolutionFind the area of the figure given below.

View SolutionThe area of the shaded part in the figure given below is ______.

View SolutionThe inequation represented by the graph given below is :
View SolutionThe inequation that best describes the graph given below is _________
View Solution
