Draw a rectangle diagram on a graph sheet. Count the squares and use them to estimate the area of the region. Solution in Telugu
Step by step video & image solution for Draw a rectangle diagram on a graph sheet. Count the squares and use them to estimate the area of the region.<image src=https://concept-stories.s3.ap-south-1.amazonaws.com/test/Stories%20-%20Images_story_86647/image_2019-09-18%2011%3A35%3A50.965308%2B00%3A00> by Maths experts to help you in doubts & scoring excellent marks in Class 6 exams.
Similar Questions
By counting squares, estimate the area of the figure 10.9 b.
04:16View SolutionDraw any circle on the graph paper. Count the squares and use them to estimate the area of the circular region.
03:33View Solution'Draw a rectangle of length 4 centimetres and breadth 2 centimetres. Draw a square having, the same area of the rectangle.
06:16View SolutionUsing a square dot sheet or a graph sheet draw a rectangle and construct a similar figure. Find the perimeter and areas of both and compare their ratios with the ratio of their corresponding sides.
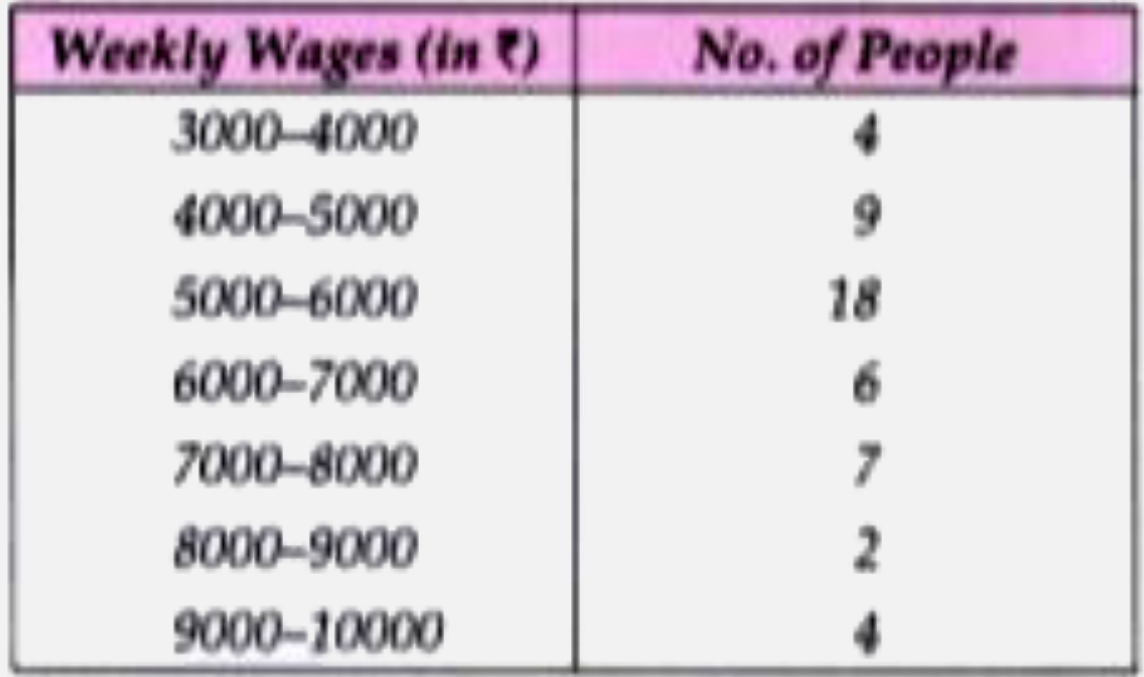
07:47View SolutionDraw a Histogram for the data, using a graph paper:

Estimate the mode from the graph.05:02View SolutionThe marks obtained by 100 students in a Mathematics test are given below :

Draw an ogive for the given distribution on a graph sheet.
(Use a scale of 2 cm = 10 units on both axis).
Use the ogive to estimate the :
(i) median.09:52View SolutionThe marks obtained by 100 students in a Mathematics test are given below :

Draw an ogive for the given distribution on a graph sheet.
(Use a scale of 2 cm = 10 units on both axis).
Use the ogive to estimate the :
(ii) lower quartile.03:34View Solutionग्राफ पेपर पर अलग-अलग त्रिज्याओं के वृत्तों को बनाइए। वर्गों की संख्या को गिनकर क्षेत्रफल ज्ञात कीजिए। सूत्र का प्रयोग करके भी क्षेत्रफल ज्ञात कीजिए। दोनों उत्तरों की तुलना कीजिए।
09:10View Solution

