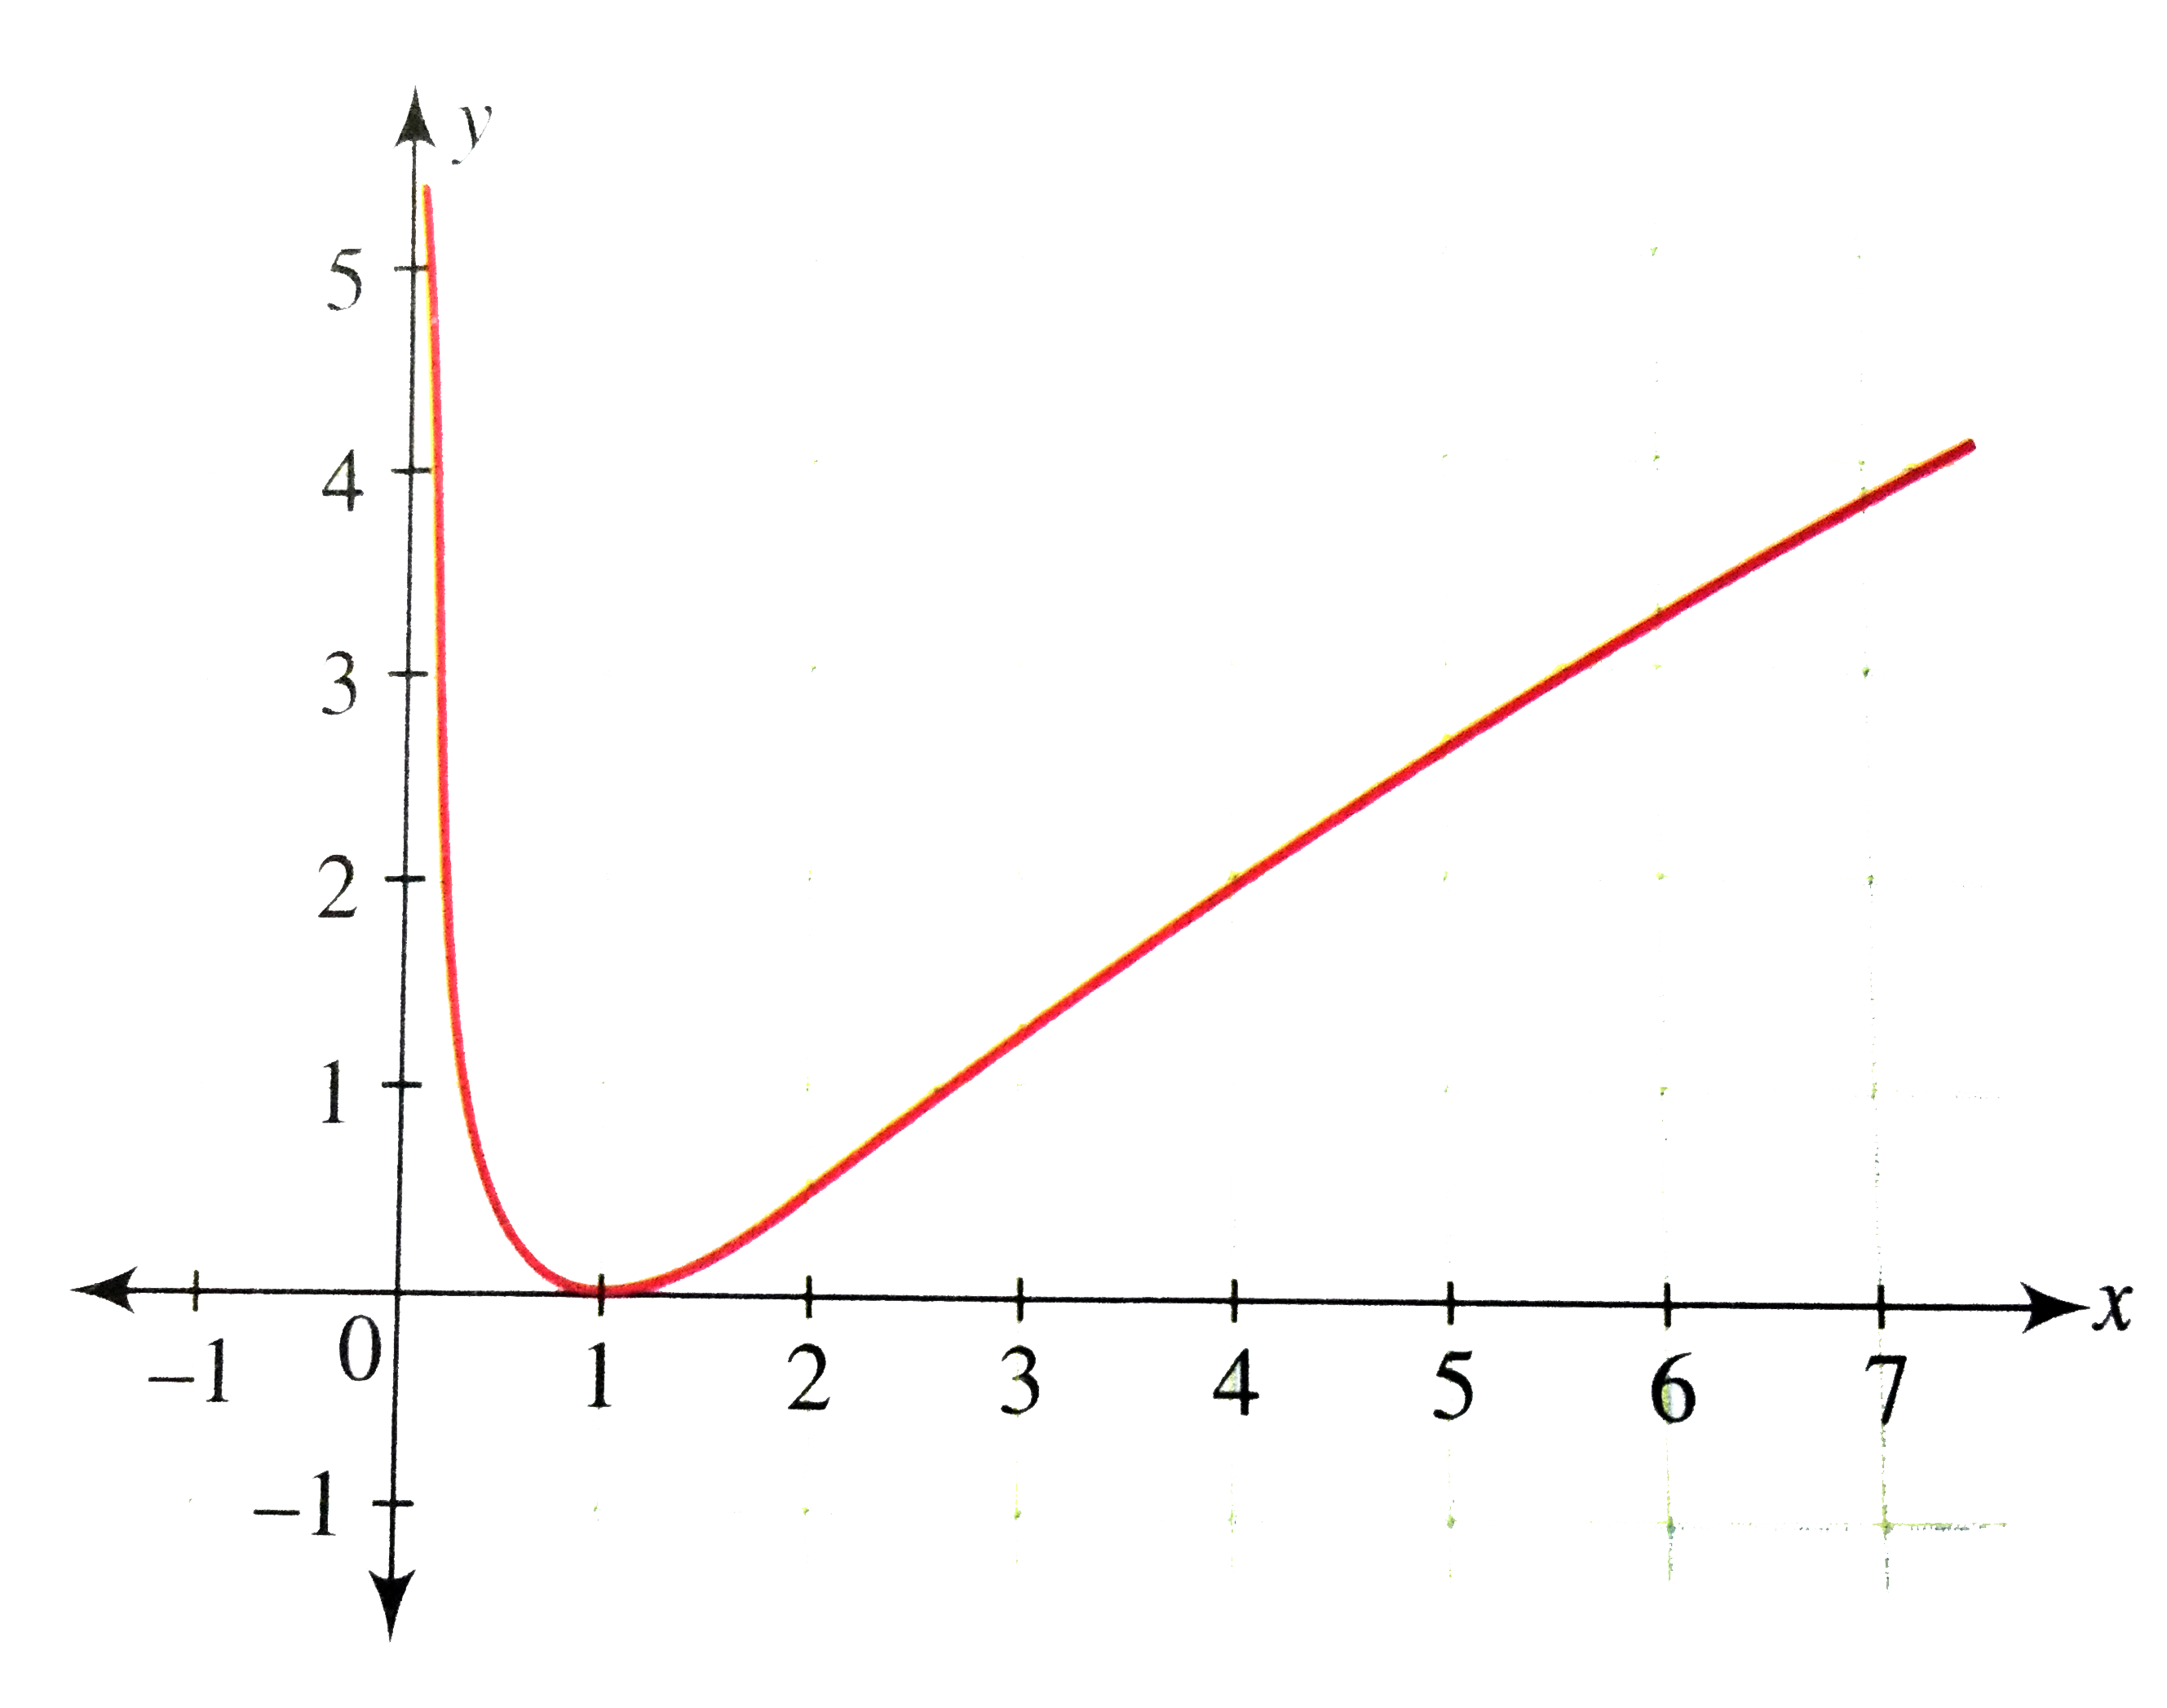
Draw the graph of y=(logex)2
Video Solution
Text Solution
y=(logex)2>0 for all x>0
and when x→0,logex→−∞,∴(loge(x)2→∞)
When x→∞,(logex)2→∞
Also for dydx=0,2logexx=0⇒x=1, which is clearly the point of minima y(1)=1
From these information, we can plot the graph of the function as shown in the following figure.

y''=21−logexx2=0
y''<0 for x>e
y''>0 for 0<x<e
|
Updated on:21/07/2023
Topper's Solved these Questions
Similar Questions
Draw the graph of y=1logex
View SolutionDraw the graph of y=2x.
View SolutionDraw the graph of y=|x|
View SolutionDraw the graph of y=loge(x3−x)
View SolutionDraw the graph of y≤x+2.
View SolutionDraw the graph of y=−x
View SolutionDraw the graph of y=|loge|x||.
View SolutionDraw the graph of y=logx√x
View SolutionDraw the graph of y=loge(x+√x2+1)
View SolutionDraw the graph of y=loge(−x),−logex,y=|logex|,y=loge|x| and y=|loge|x|| transforming the graph of y=logex.
View Solution

