For questions 13-14: The accompanying figure shows the graph of a function f(Cr) with domain [O, 2] and range [0, 1] 2 Figure I Figure II Q13) Figure II represents the graph of A. 2f(x) B. f(r-2) C. f(x + 2) D. f (x -2)+ 1 Q14) The domain and range respectively of A. f(-x) are [- 2, 0] and -1,0] B. f(x)-1 are [0, 2] and [0, 1] C. f(x) + 2 are [0, 2] and [1, 2] D. -ft+1)+ 1 are [-1, 1] and [0, 1] x +1+ 1 are
Step by step video & image solution for For questions 13-14: The accompanying figure shows the graph of a function f(Cr) with domain [O, 2] and range [0, 1] 2 Figure I Figure II Q13) Figure II represents the graph of A. 2f(x) B. f(r-2) C. f(x + 2) D. f (x -2)+ 1 Q14) The domain and range respectively of A. f(-x) are [- 2, 0] and -1,0] B. f(x)-1 are [0, 2] and [0, 1] C. f(x) + 2 are [0, 2] and [1, 2] D. -ft+1)+ 1 are [-1, 1] and [0, 1] x +1+ 1 are by Maths experts to help you in doubts & scoring excellent marks in Class 12 exams.
Similar Questions
The graph of a function fx) which is defined in [-1, 4] is shown in the adjacent figure. Identify the correct statement(s). (1) domain of f(|x|)−1)is[−5,5] (2) range of f(|x|+1) is [0,2] (3) range of f(−|x|) is [-1,0] (4) domain of f(|x|)is[−3,3]
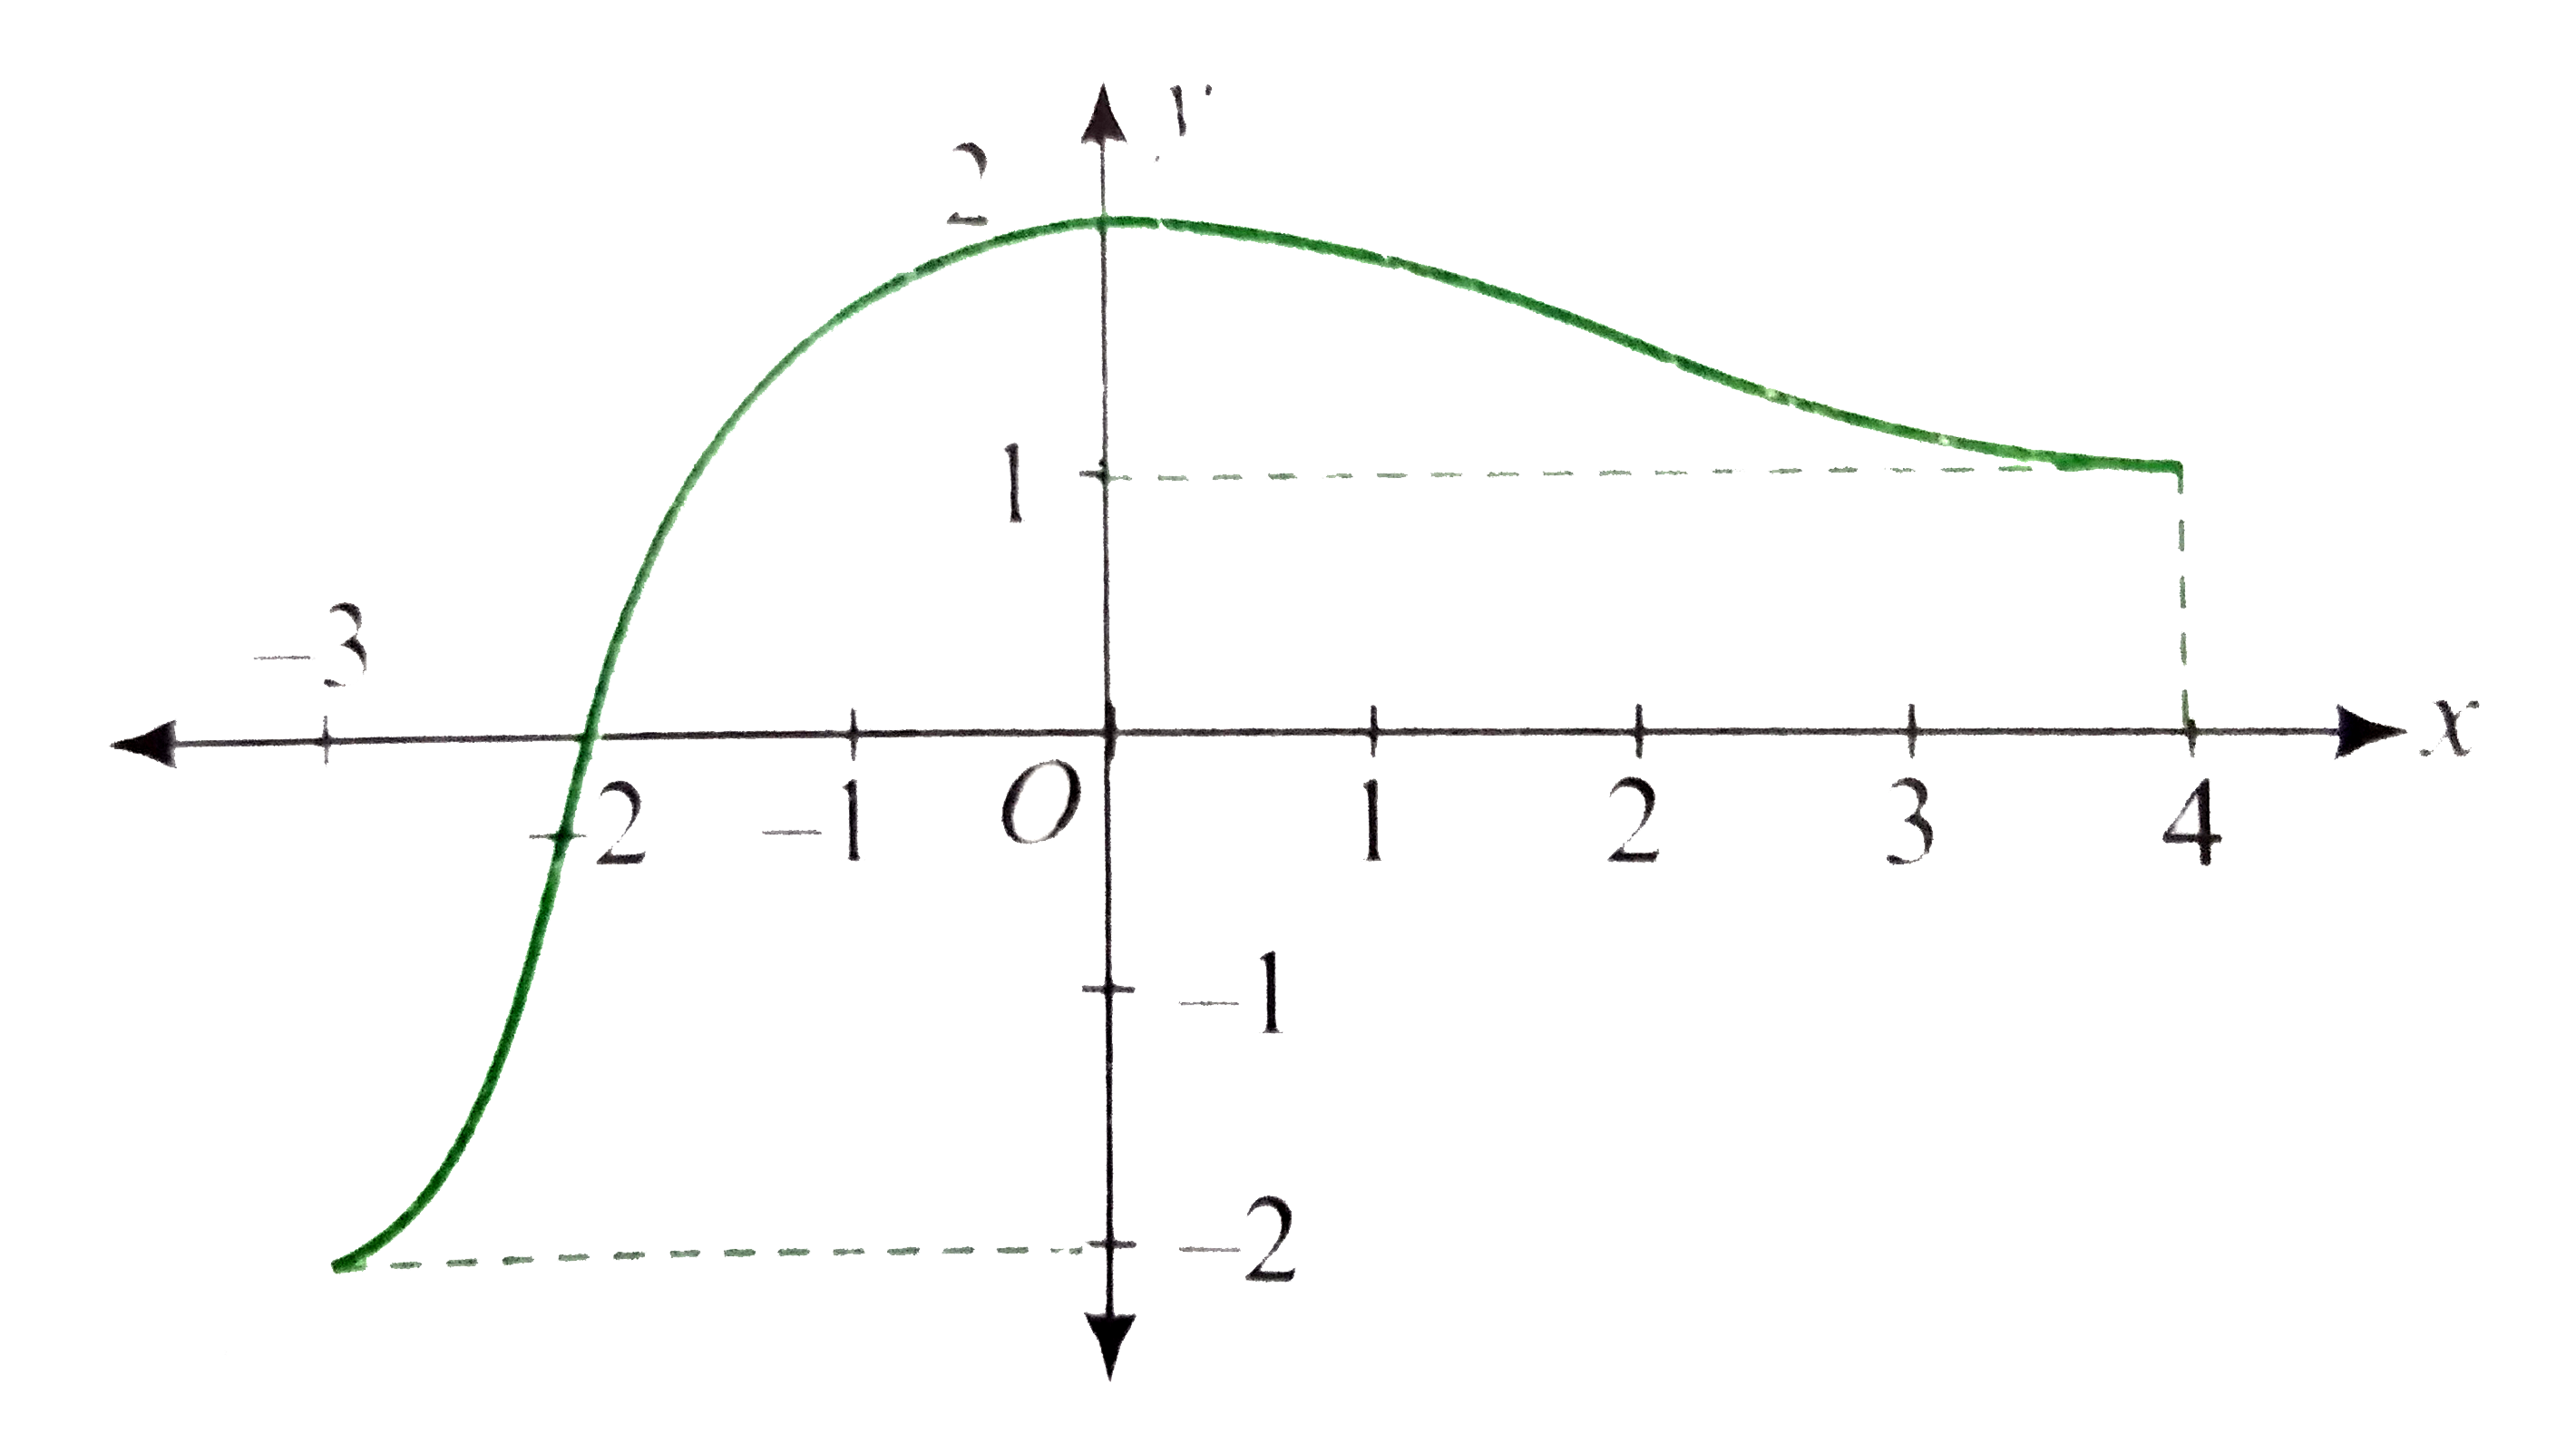
05:11View SolutionConsider a function f whose domain is [-3, 4] and range is [-2, 2] with following graph.

Domain and range of g(x)=f(|x|) is [a, b] and [c, d] respectively, then (b−a+c+d) is03:50View SolutionStatement I : The range of the function f(x)=sin([x]π)x2+x+1 is {0}
Statement II : The range of the function f(x)=x−[x]1+x−[x] is [0, 1/2).04:05View SolutionIf the range of the function F(x)=tan−1(3x2+bx+c) is [0,π2) ; (domain in R) then :
04:12View SolutionIf f(1x)+x2f(x)=0,x>0 and a=∫x1xf(t)dt,12≤x≤2, then a=
(A) 1 (B) 0 (C) f(2)−f(12) (D) none of these03:27View SolutionSuppose |[f'(x),f(x)],[f''(x),f'(x)]|=0 is continuously differentiable function with f^(prime)(x)!=0 and satisfies f(0)=1 and f'(0)=2 then (lim)_(x->0)(f(x)-1)/x is 1//2 b. 1 c. 2 d. 0
03:20View SolutionThe graph of a function fx) which is defined in [-1, 4] is shown in the adjacent figure. Identify the correct statement(s). (1) domain of f(|x|)-1) is [-5,5] (2) range of f(|x|+1) is [0,2] (3) range of f(-|x|) is [-1,0] (4) domain of f(|x|) is [-3,3]
02:04View SolutionConsider a function f whose domain is [-3, 4] and range is [-2, 2] with following graph. Domain and range of g(x)=f(|x|) is [a, b] and [c, d] respectively, then (b-a+c+d) is
04:30View Solution
