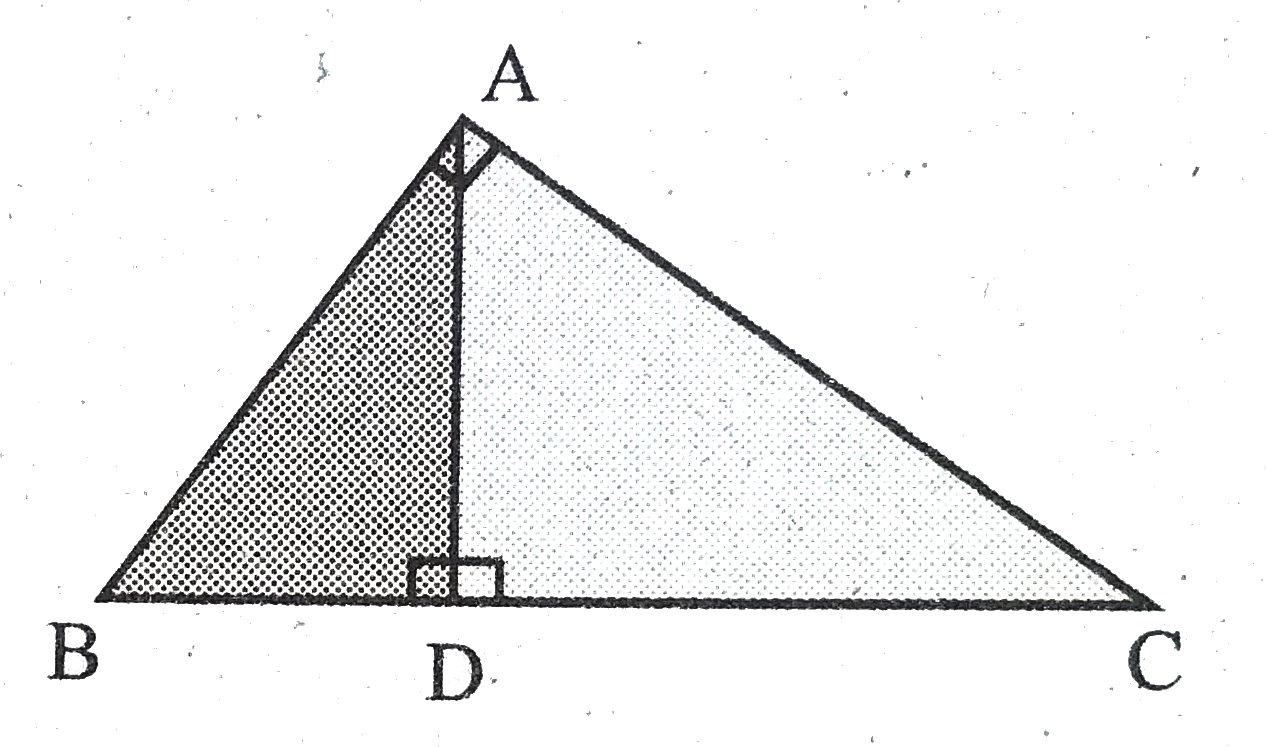
In the adjacent figure ∠BAC=90∘andAD⊥BC then
 Solution in Tamil
BD⋅CD=BC2
AB⋅AC=BC2
BD⋅CD=AD2
AB⋅AC=AD2.
The correct Answer is:C
Step by step video, text & image solution for In the adjacent figure angle BAC=90^(@) and AD bot BC then by Maths experts to help you in doubts & scoring excellent marks in Class 10 exams.
Topper's Solved these Questions
- BOOK - SURA PUBLICATIONCHAPTER - SURAS MODEL QUESTION PAPER-2019EXERCISE - Part-II14videos
SURAS MODEL QUESTION PAPER-2019
- BOOK - SURA PUBLICATIONCHAPTER - SURAS MODEL QUESTION PAPER-2019EXERCISE - Part-III17videos
SURAS MODEL QUESTION PAPER-2019
- BOOK - SURA PUBLICATIONCHAPTER - STATISTICS AND PROBABILITY EXERCISE - Unit Test (Section -C)1videos
STATISTICS AND PROBABILITY
- BOOK - SURA PUBLICATIONCHAPTER - TRIGONOMETRYEXERCISE - Unit Test14videos
TRIGONOMETRY
Similar Questions
A Relation R is given by the set {(x,y)∣y=x+3,ξn{0,1,2,4,5}}. Determine its domain and range.
01:37View SolutionIn each of the following cases state whether the functions is bijective or not. Justify your answer:
f:R→Rdef∈edbyf(x)=2x+102:11View SolutionThe frequency distribution is given below.
xk2k3k4k5k6kf211111
In the table, k is a positive integer, has a varience of 160. Determine the value of k.01:31View Solutiontanθcosec2θ−tanθ is equal to
02:45View SolutionHow many lines of symmetry does the above figure have ?
02:17View SolutionDetermine the point of symmetry of a regular hexagon.
05:41View SolutionDtermine the images of the following figure about the given line :
02:21View SolutionMatch the following Column A to Column B
 02:03View Solution
Match the following Column A to Column B
 02:10View Solution
Match the following Column A to Column B
 02:17View Solution
Find the area of the figure given below.
 02:10View Solution
The area of the shaded part in the figure given below is ______.
 04:23View Solution
The inequation represented by the graph given below is :
01:59View SolutionThe inequation that best describes the graph given below is _________
01:19View SolutionThe inequation that best describes the following graph is _________
01:52View SolutionWhich inequations represent the shaded region in the given figure
03:10View Solution

