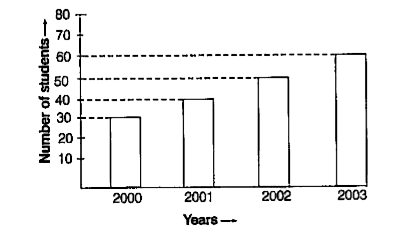
Read the adjoining bar graph showing the number of students in a particular class of a school:
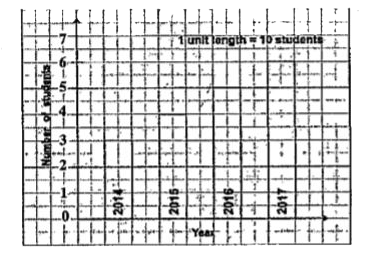
Answer tbe following questions :
(i) What is the scale of.this graph ?
(ii) How many students are there in 2016 ?
(iii) Is the number of students in the year 2017 twice the year 2014 ?
The correct Answer is:(i) 10, (ii) 50, (iii) 2 × Number of students in 2014
Topper's Solved these Questions
- DATA HANDLING BOOK - SWAN PUBLICATIONCHAPTER - DATA HANDLING EXERCISE - MULTIPLE CHOICE QUESTIONS
9 Videos
- DATA HANDLING BOOK - SWAN PUBLICATIONCHAPTER - DATA HANDLING EXERCISE - EXERCISE 14.2
15 Videos
- BASIC GEOMETRICAL CONCEPTSBOOK - SWAN PUBLICATIONCHAPTER - BASIC GEOMETRICAL CONCEPTSEXERCISE - MULTIPLE CHOICE QUESTIONS
12 Videos
- DECIMALSBOOK - SWAN PUBLICATIONCHAPTER - DECIMALSEXERCISE - MULTIPLE CHOICE QUESTIONS
20 Videos
Similar Questions
Read the adjoining bar graph showing the number ofstudents in a particular class of a school. Answer thefollowing questions :(a) What is the scale of this graph?(b) How many new students are added every year?(c) Is the number of students in the year 2003 twice that in the year 2000?
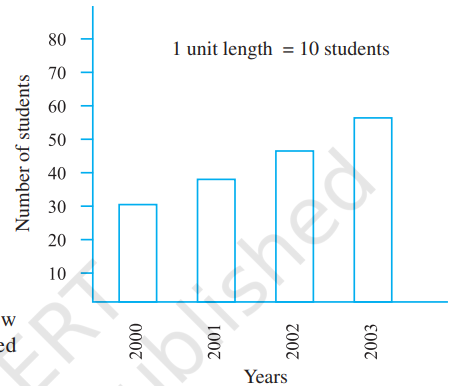
View SolutionRead the adjoining bar graph showing the number ofstudents in a particular class of a school. Answer thefollowing questions :(a) What is the scale of this graph?(b) How many new students are added every year?(c) Is the number of students in the year 2003 twice that in the year 2000?
View Solution
Knowledge Check
The following bar graph shows the number of students in a particular class of school. Then, answer the following questions.
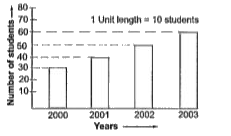
(i) What is the nuber of students in the year 2003 ?A70B60C50D40The following bar graph shows the number of students in a particular class of school. Then, answer the following questions.
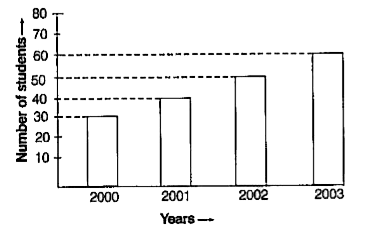
What is the number of students in the year 2003?A10B25C45D60The following bar graph shows the number of students in a particular class of school. Then, answer the following questions.
Is the number of students in the year 2002 is twice that in the year 2000?AYesBNoCCannot sayDNone of these
The following bar graph shows the number of students in a particular class of school. Then, answer the following questions.
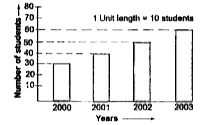
What is the number of students in the year 2003?
View SolutionThe following bar graph shows the number of students in different classes of a school.
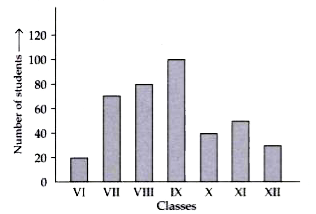
How many more students are there in Class IX than in Class VIII ?
View SolutionThe given bar graph, shows the number of students in different classes.
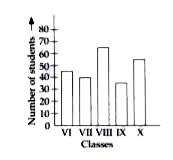
How many more students are there in class VIII than in class IX?
View SolutionThe given bar graph, shows the number of students in different classes.
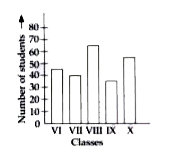
Find the total number of students in the classes VIII to X.
View SolutionThe following bar graph represents the data for different sizes of shoes worn by the students in a school. Read the graph and answer the following questions.
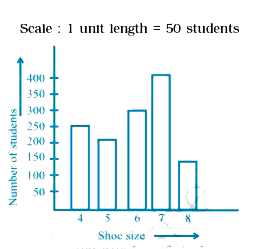
What is the number of students wearing shoe size 6?
View Solution
