Read the given bar graph and answer the following questions:

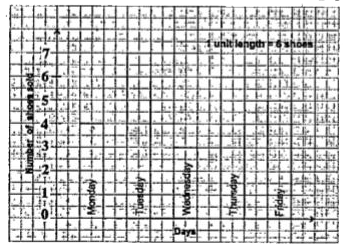
(i) What information does the bar graph represent ?
(ii) What is the scale chosen for this graph ?
(iii) On which day were the maximum number of shoes sold and how many ?
(iv) On which day were the minimum number of shoes sold and how many ?
(v) How many shoes were sold on Thursday ?Solution in Punjabi
Step by step video & image solution for Read the given bar graph and answer the following questions: (i) What information does the bar graph represent ? (ii) What is the scale chosen for this graph ? (iii) On which day were the maximum number of shoes sold and how many ? (iv) On which day were the minimum number of shoes sold and how many ? (v) How many shoes were sold on Thursday ? by Maths experts to help you in doubts & scoring excellent marks in Class 6 exams.
Updated on:21/07/2023Topper's Solved these Questions
- DATA HANDLING BOOK - SWAN PUBLICATIONCHAPTER - DATA HANDLING EXERCISE - MULTIPLE CHOICE QUESTIONS
9 Videos
- DATA HANDLING BOOK - SWAN PUBLICATIONCHAPTER - DATA HANDLING EXERCISE - EXERCISE 14.2
15 Videos
- BASIC GEOMETRICAL CONCEPTSBOOK - SWAN PUBLICATIONCHAPTER - BASIC GEOMETRICAL CONCEPTSEXERCISE - MULTIPLE CHOICE QUESTIONS
12 Videos
- DECIMALSBOOK - SWAN PUBLICATIONCHAPTER - DECIMALSEXERCISE - MULTIPLE CHOICE QUESTIONS
20 Videos
Similar Questions
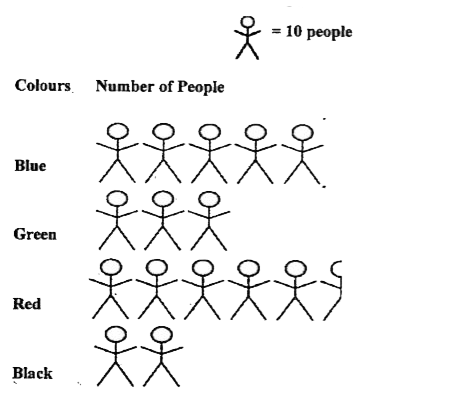
If * represents 10 flowers then how many flowers does * * * * * represent?
View SolutionThe colour of refrigerators preferred by number of people living in a locality are shown by the following pictograph :

(i) Find the number of people preferring blue colour ?
(ii) How many people liked red colour ?
View SolutionHow many lines can pass through a point ?
View Solution3+210=.............
View SolutionWhich of the following symbols are not acceptable ? (i) ._(35)^(79)Br (ii) .^(79)Br (iii) ._(79)^(35)Br (iv) ._(35)Br
View SolutionHow many lines of symmetry does the above figure have ?
View SolutionThe inequation represented by the graph given below is :
View SolutionThe inequation that best describes the graph given below is _________
View SolutionThe inequation that best describes the following graph is _________
View SolutionIn the given figure, PQRS is a parallelogram. A and B are the mid-point of ¯¯¯¯¯¯PQ and ¯¯¯¯¯SR respectively. If PS=BR, then the quadrilateral ADBC is a…………………… ,
ltimg src="https://d10lpgp6xz60nq.cloudfront.net/physics_images/PS_MATH_IX_C12_E05_020_Q01.png" width="80%"gt
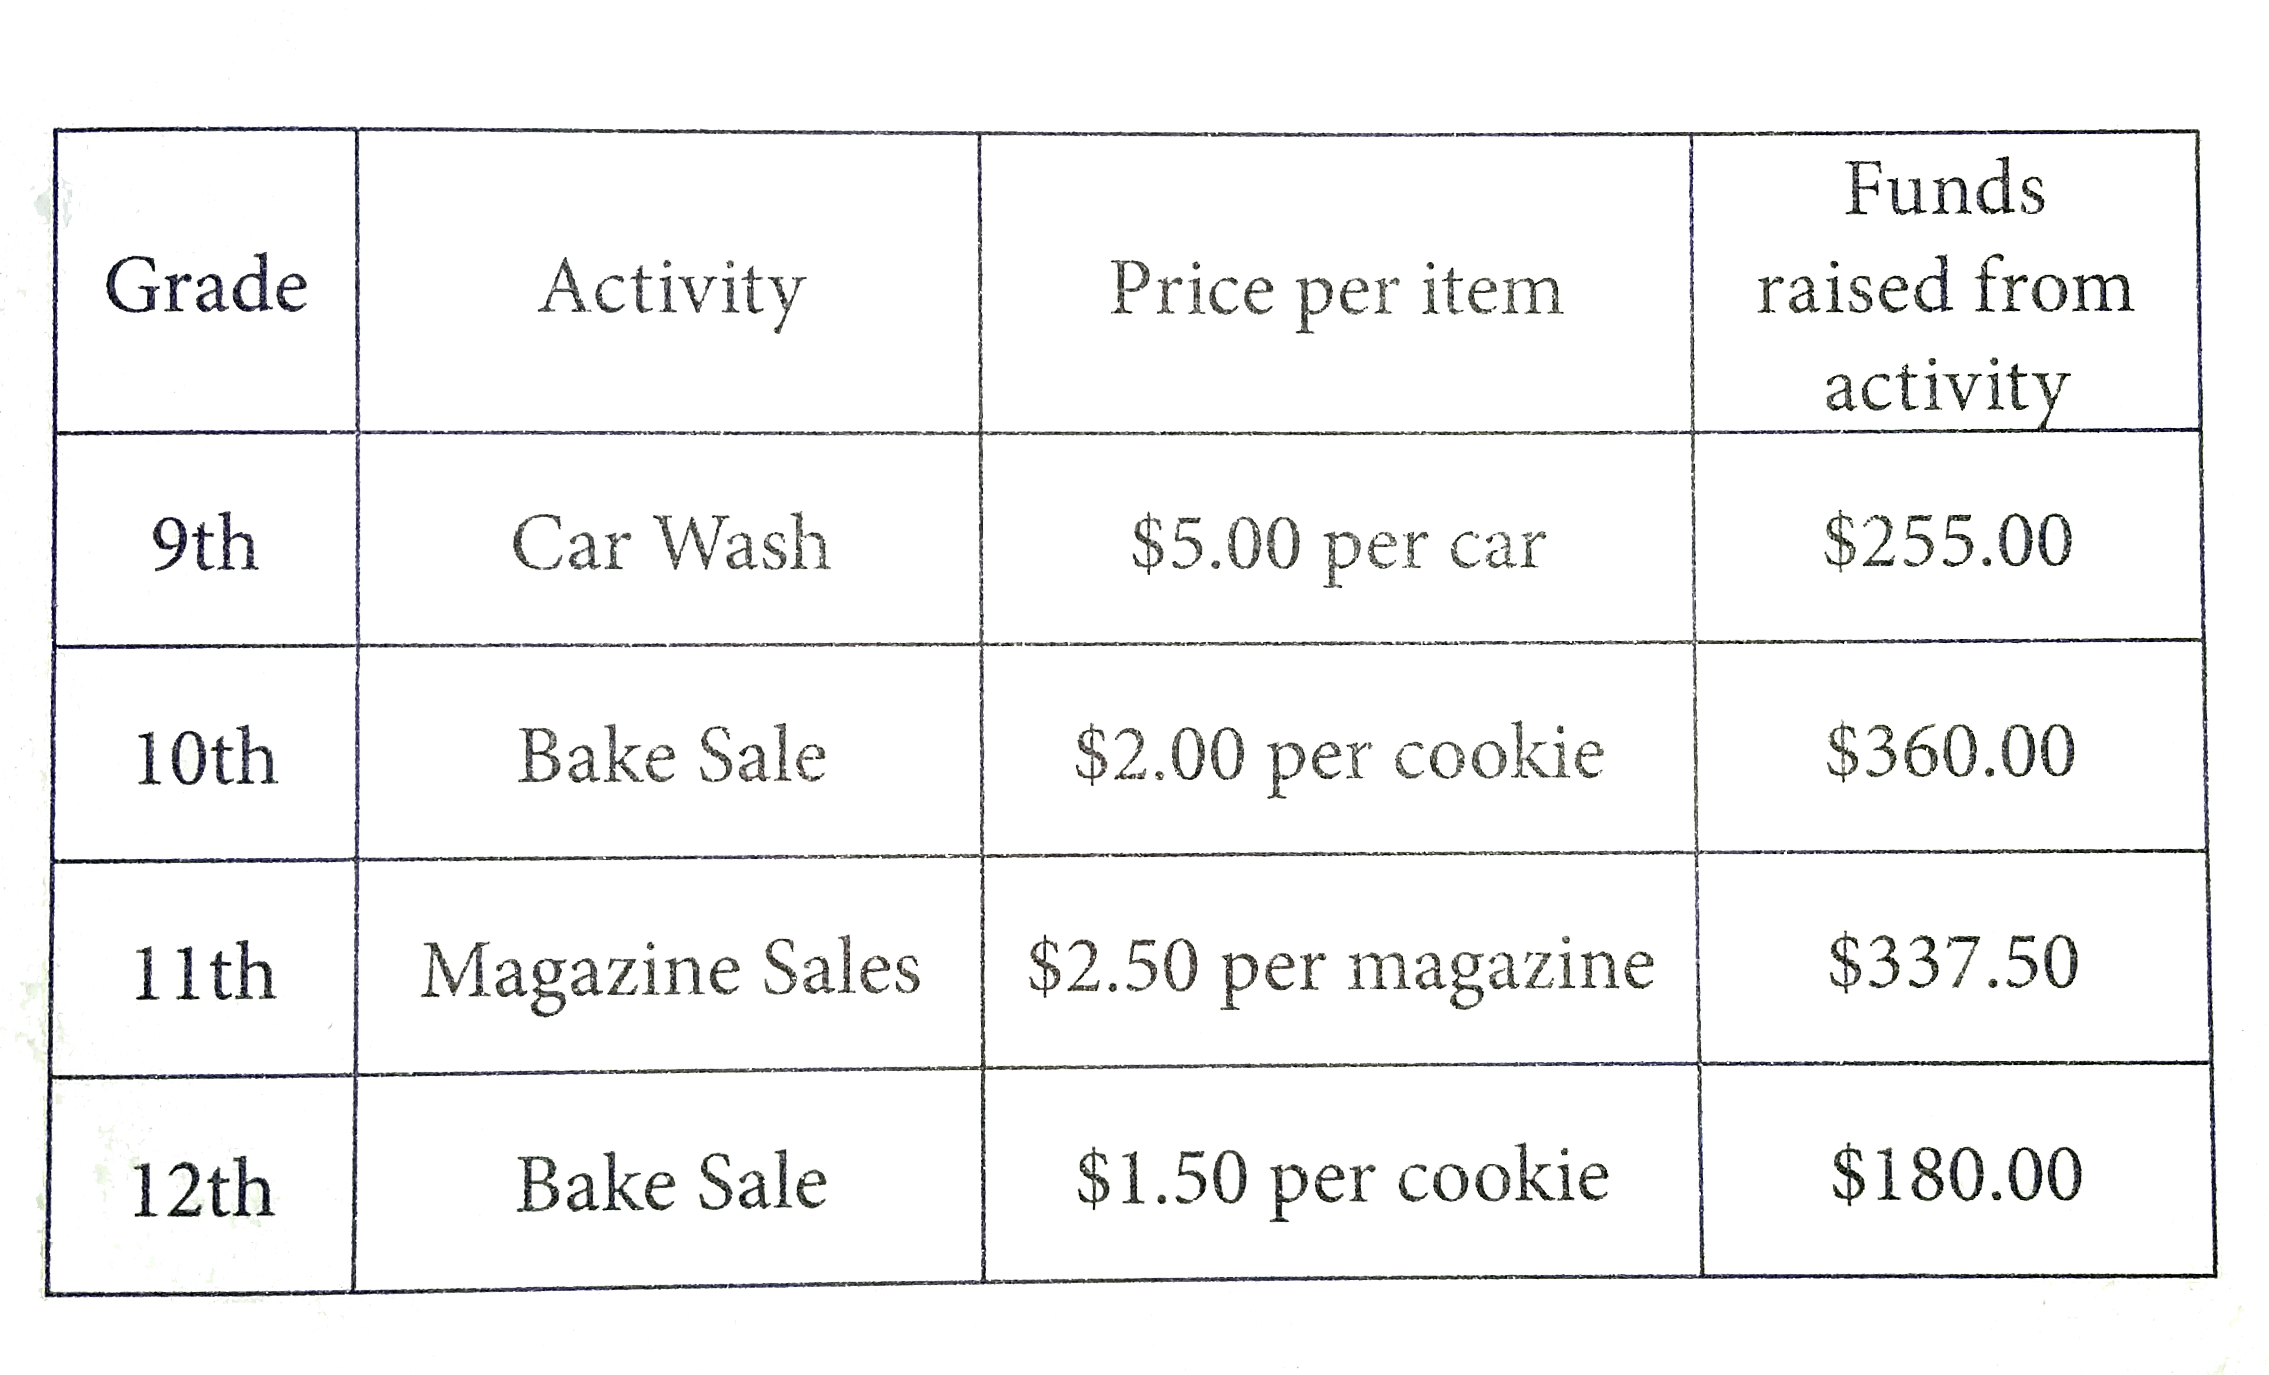
View Solution <>br> How many more cookies were sold by the 10th grade than were sold by the 12th grade?
View Solutionఏ అవయవాలు కవాటాలు కల్గి ఉంటాయి ?br i) గుండెbr ii) ధమనిbr iii) సిరలుbr iV) శోషరస నాళాలు
View Solutionవేర్ల ద్వారా శాఖీయోత్పత్తి జరిపే మొక్కbr i) డాలియాbr ii) ముల్లంగిbr iii) క్యారెట్br iv) క్యాబేజిbr
View SolutionRead the bar graph shown in Figure and answer the following questions: What is the information given by the bar graph? How many tickets of Assam State Lottery were sold by the agent? Of which state, were the maximum number of tickets sold? State whether true or false. The maximum number of tickets sold is three times the minimum number of tickets sold. Of which state were the minimum number of tickets sold?
View SolutionPhytochemistry as a criterion for the classification of organisms is also used by taxonomist in br i. Artificial system, br ii. Cytotaxonomy
View SolutionIn C4 plants, bundle sheath cells are characterised by how many features given below? Br i. Large cells, br ii- Having large number of agranal chloroplasts, br iii- Thin walled
View Solution
