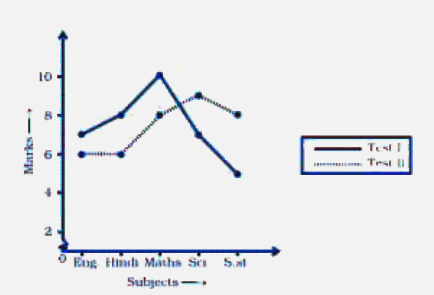
The double line graph given below shows the marks obtained out of 10 by Madhu in two different tests. Study the graph and answer the questions that follow :

(i) What information is represented by the axes ?
(ii) In which subject did she score the highest in Test I ?
(iii) In which subject did she score the least in Test II ?
(iv) What are the marks scored by her in social science in Test II ?
(v) In which test was the performance better ?
(vi) In which subject and which test did she score full marks ?
Step by step video & image solution for The double line graph given below shows the marks obtained out of 10 by Madhu in two different tests. Study the graph and answer the questions that follow : (i) What information is represented by the axes ? (ii) In which subject did she score the highest in Test I ? (iii) In which subject did she score the least in Test II ? (iv) What are the marks scored by her in social science in Test II ? (v) In which test was the performance better ? (vi) In which subject and which test did she score full marks ? by Maths experts to help you in doubts & scoring excellent marks in Class 8 exams.
Topper's Solved these Questions
- BOOK - RS AGGARWALCHAPTER - LINE GRAPHS AND LINEAR GRAPHSEXERCISE - Exercise 2325videos
LINE GRAPHS AND LINEAR GRAPHS
- BOOK - RS AGGARWALCHAPTER - INTRODUCTION TO COORDINATE GEOMETRYEXERCISE - EXERCISE B (OBJECTIVE QUESTIONS)7videos
INTRODUCTION TO COORDINATE GEOMETRY
- BOOK - RS AGGARWALCHAPTER - LINEAR EQUATIONSEXERCISE - TEST PAPER-8 (D) (Write .T. for true and .F. for false for each of the following:)1videos
LINEAR EQUATIONS
Similar Questions
The graph given below shows the marks obtained out of 10 by Sonia in two different tests. Study the graph and answer the questions that follow.
(a) What information is represented by the axes?
(b) In which subject did she score the highest in Test I?
(c) In which subject did she score the least in Test II?
(d) In which subject did she score the same marks in both the Tests?
(e) What are the marks scored by her in English in Test II?
(f) In which test was the performance better?
(g) In which subject and which test did she score full marks?View SolutionLook at the bar graph given below.
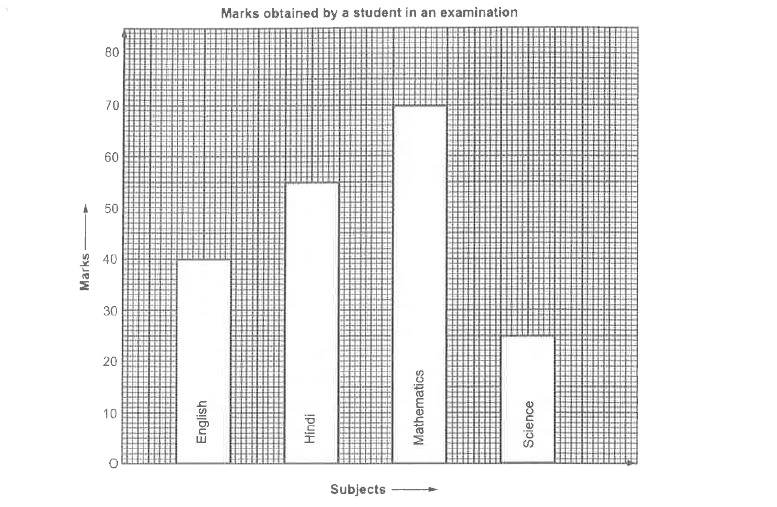
Read if cerefully and answer the questions given below:
What information does the bar graph give ?
In which subject is the student poorest ?
In which subject is the student best ?
In which subjects did he get more than 40 marks ?View Solution
Knowledge Check
- Question 1 - Select One
The following pie chart shows the marks obtained by a student in an examination, who scored 720 marks in all. Study the diagram and answer the questions given below.
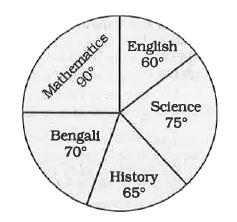
The marks scored in Science areA200B300C75D150
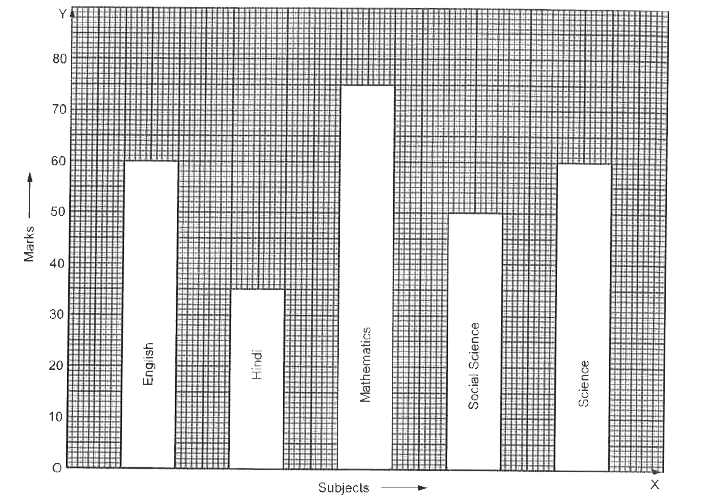
Look at the bar graph given below
Read it carefully and answer the following questions
Q(i) What information does the bar graph give
(ii) In which subject is the student very good
(iii) In which subject is he poor
(iv) What is the average of his marks
 View Solution
The given bar graph shows the marks obtained by students in a Science test.
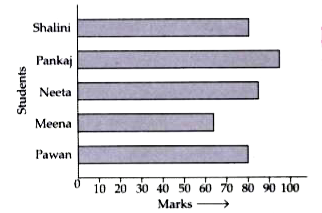
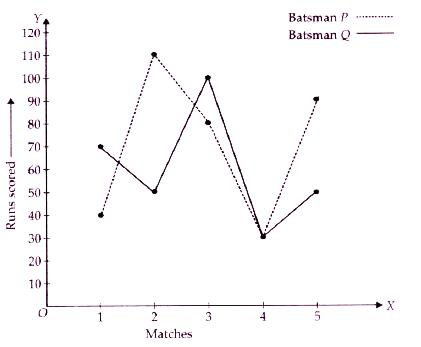
Who scored the highest marks in the test ? Whats in the score ?View SolutionPerformance based graph) The given graph shows the total runs scored by two batmans P and Q during each of the five different matches in the year 2011. study the graph and answer the following questions :
What information is given on the axes?
 View Solution
The table given below shows the marks obtained by 6 students in 3 subjects.
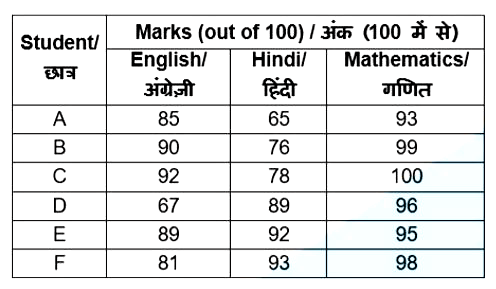
What are the average marks per subject scored by D?View SolutionObserve this bar graph which shows the marks obtained by Aziz in half-yearly examination in different subjects.
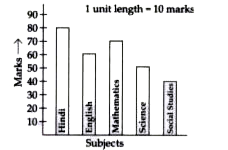
Answer the given questions.
What information does the bar graph give ?View SolutionTable given below shows marks obtained by four students in four different subjects in an exam. Study the data carefully and answer the following questions.
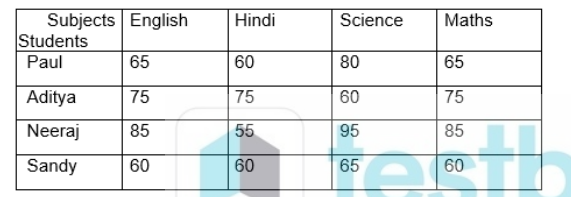
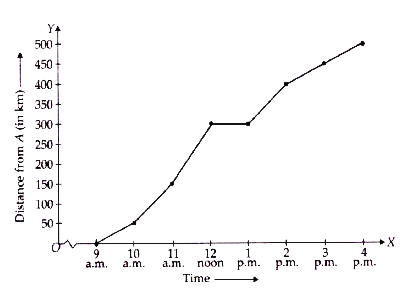
Total marks scored by Paul are how much more/less than total marks scored by Neeraj?View SolutionThe given line graph shows the distance travelled by a motorcyclist from a city A to B at different times. These two cities are 500 km apart. Study the graph and answer the following:
(i) What information is given on the two axes?
(ii) From where and when did the motorcyclist begin its journey?
(iii) How far did the motorcyclist go in the first hour?
(iv) How far did the motorcyclist go during 3rd hour?
(v) When did the motorcyclist reach city B?
 View Solution

