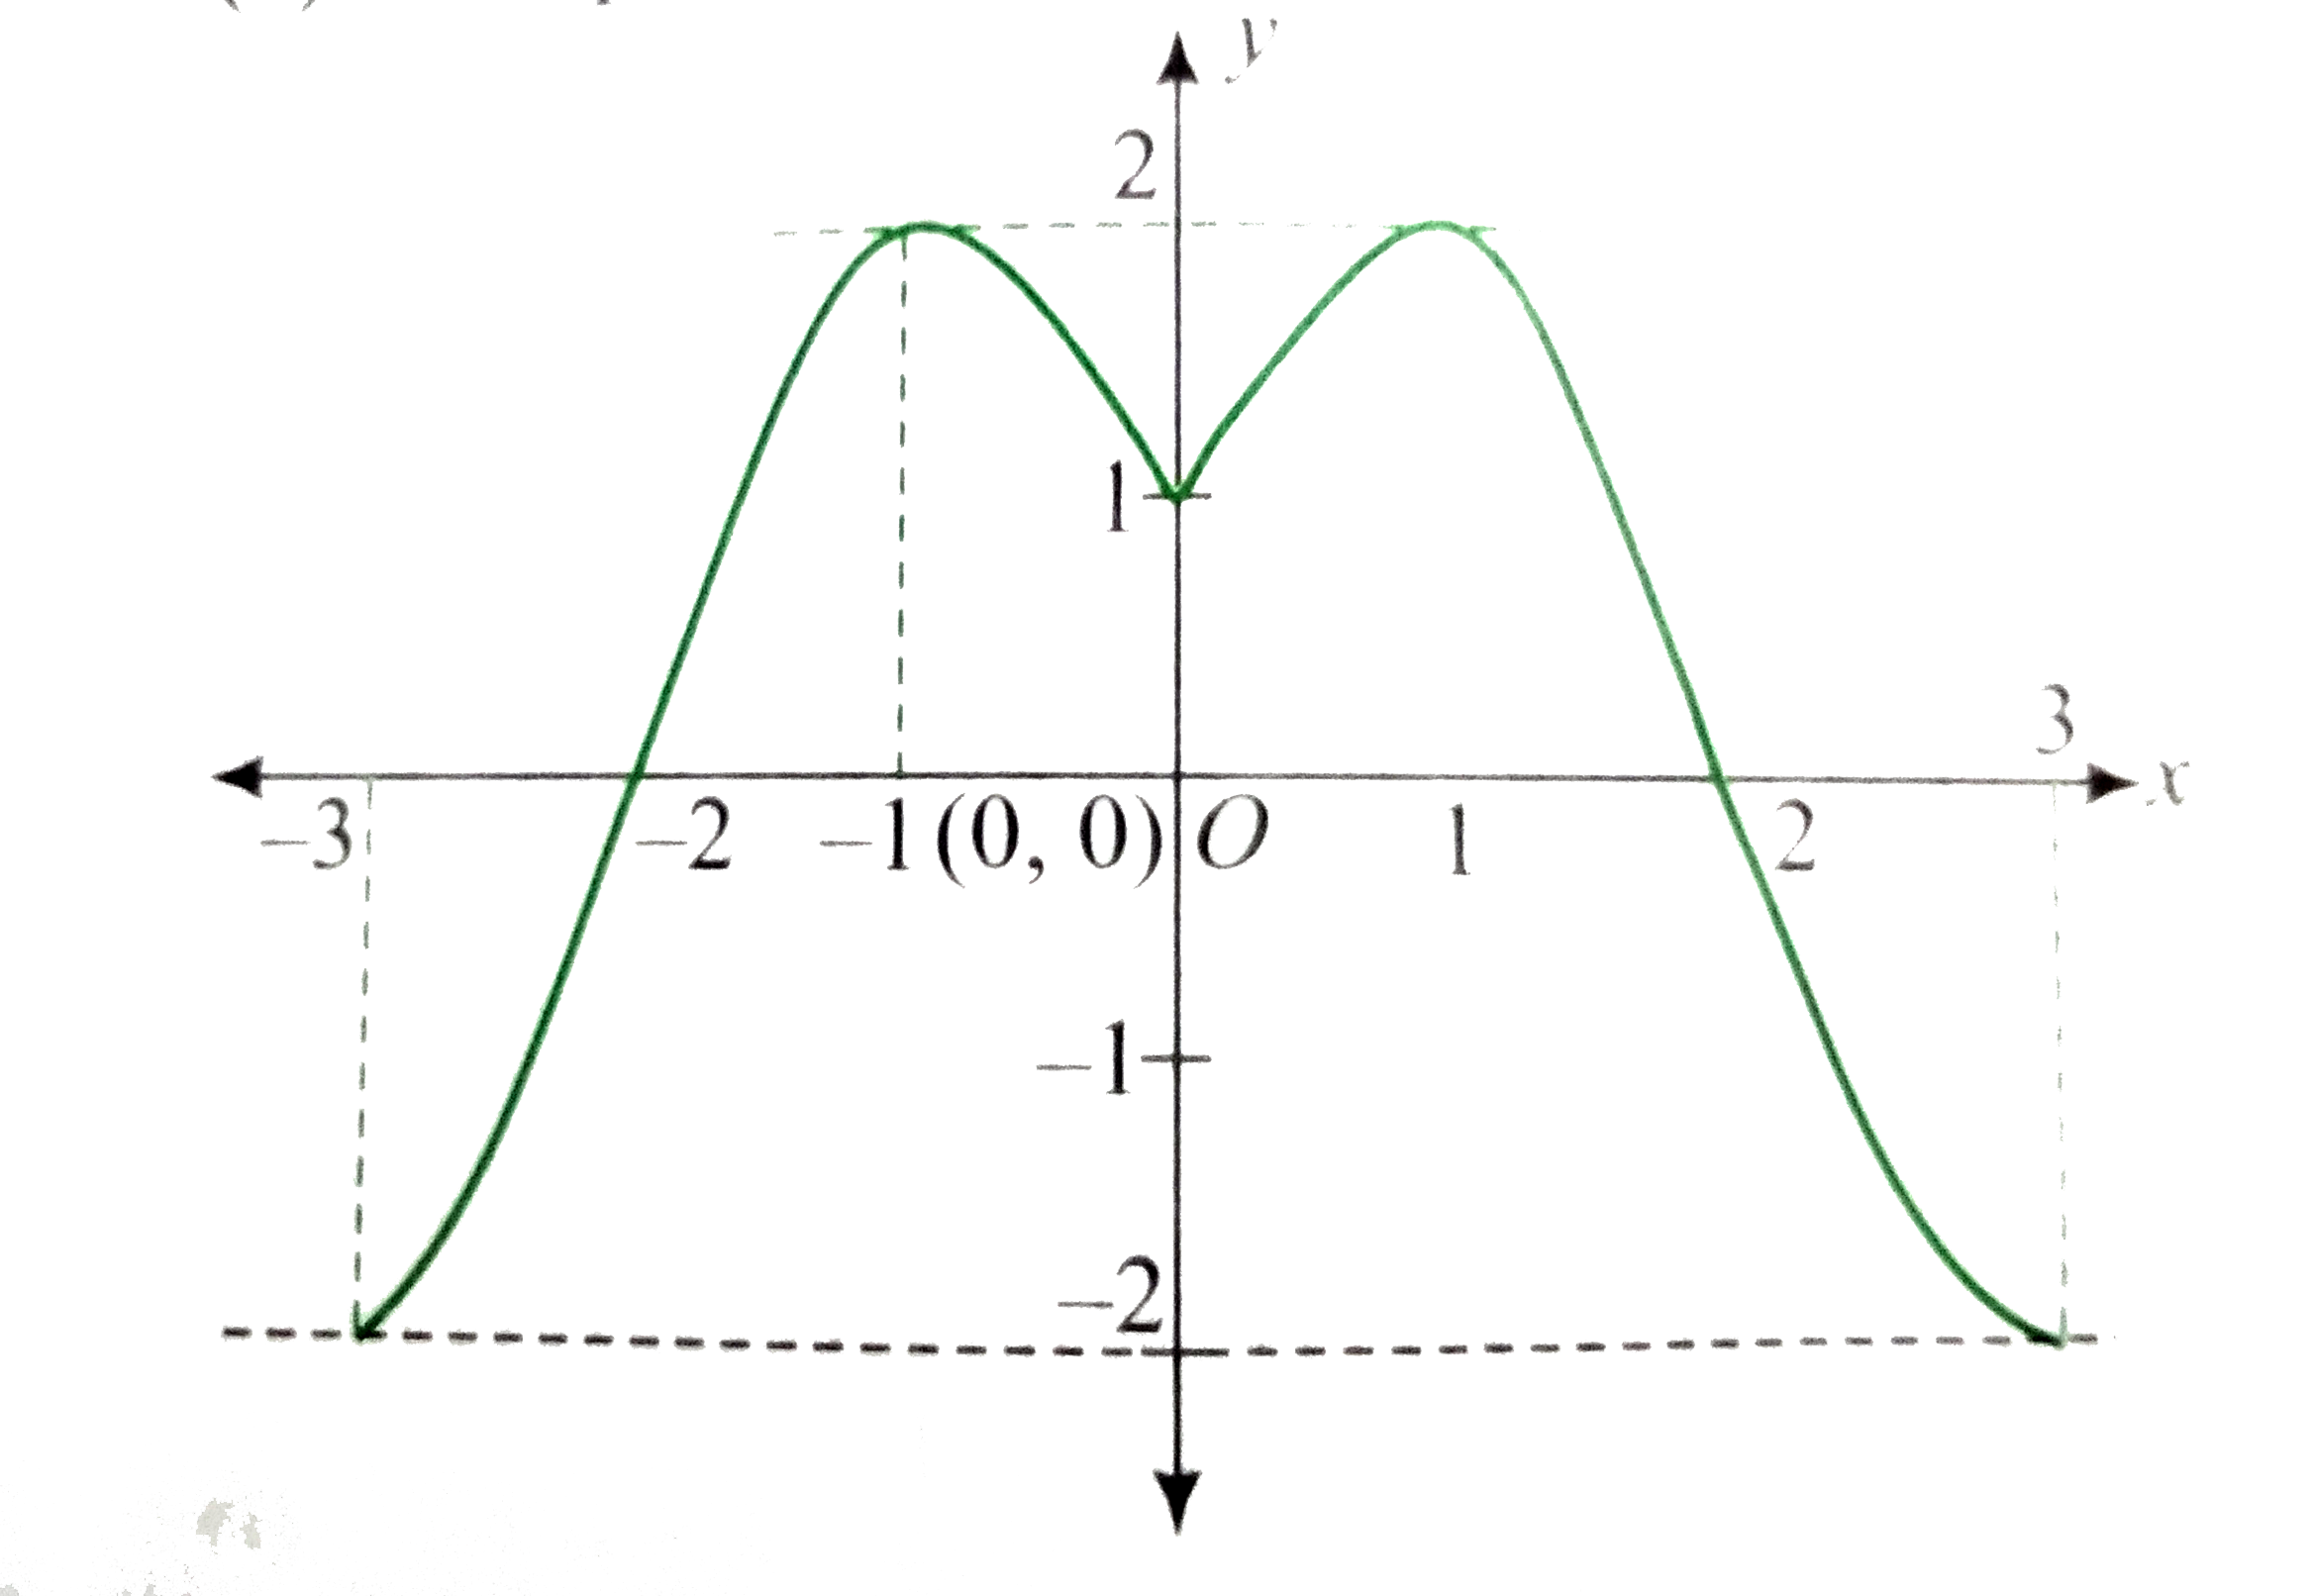
The figure illustrates the graph of the function y=f(x) defined in [-3, 2].
![The figure illustrates the graph of the function y=f(x) defined in [-3, 2]. Identify the correct statement(s)?](https://d10lpgp6xz60nq.cloudfront.net/physics_images/CEN_CAL_C01_E17_026_Q01.png)
Identify the correct statement(s)?
Range of y=f(−|x|) is [−2,2]
Domain of y=f(|x|) is [−2,2]
Domain of y=f|x|+1) is [−1,1]
Range of y=f(|x|+1) is [−1,0]
The correct Answer is:A, B, C, D
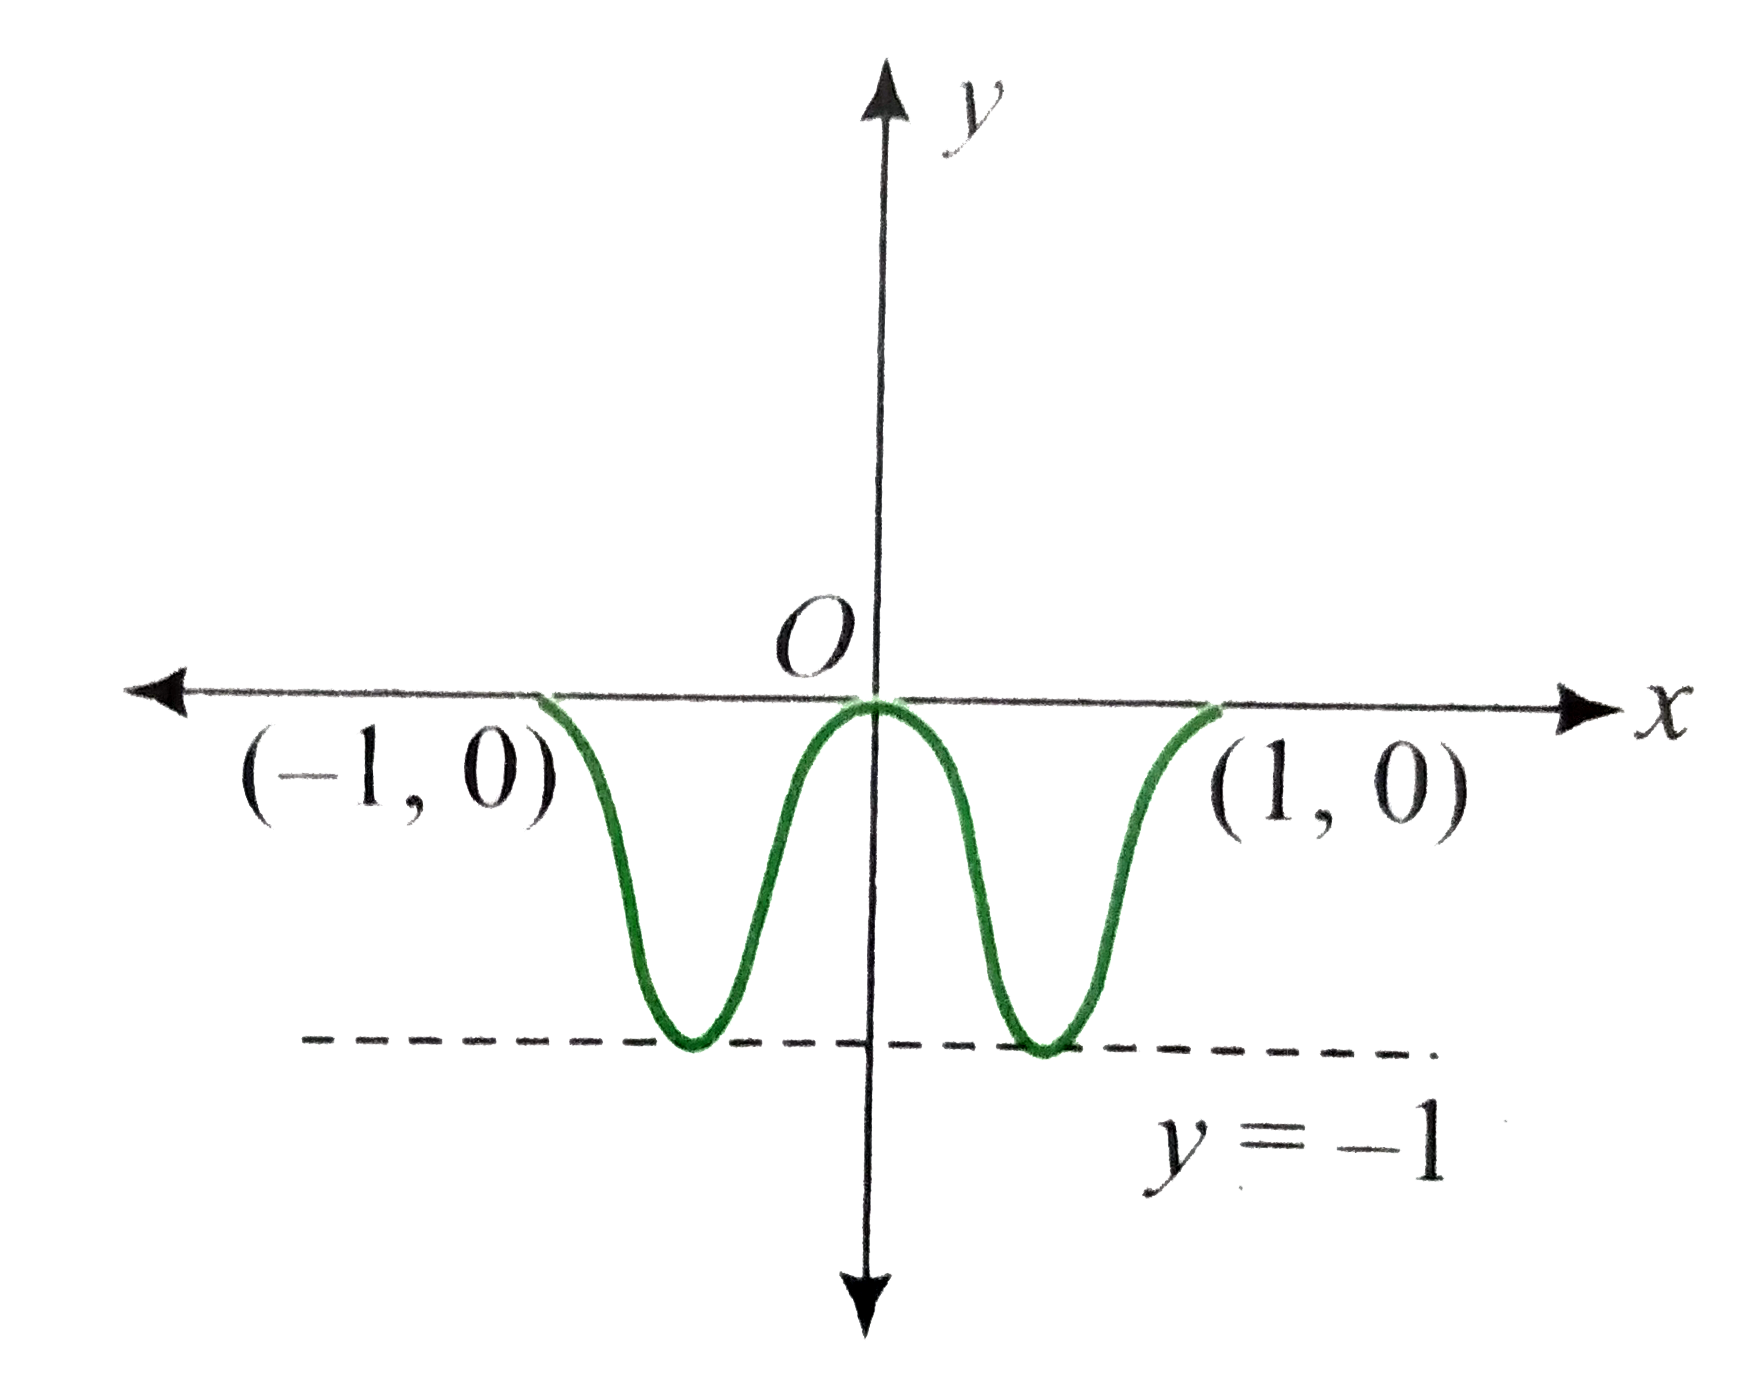
(1) Graph of y=f(−|x|) is

∴ range is [-2, 2]
(2) Domain of y=f(|x|) is
−3≤|x|≤2
⇒−2≤x≤2
(3) Domain of y=f(|x|+1) is
−3≤|x|+1≤2
⇒−4≤|x|≤1
⇒x∈[−1,1]
(4) Graph of y=f(|x|+1) is

∴ Range is [-1, 0]
Topper's Solved these Questions
- BOOK - CENGAGECHAPTER - RELATIONS AND FUNCTIONSEXERCISE - Exercise (Comprehension)32videos
RELATIONS AND FUNCTIONS
- BOOK - CENGAGECHAPTER - RELATIONS AND FUNCTIONSEXERCISE - Exercise (Matrix)9videos
RELATIONS AND FUNCTIONS
- BOOK - CENGAGECHAPTER - RELATIONS AND FUNCTIONSEXERCISE - Exercise (Single)125videos
RELATIONS AND FUNCTIONS
- BOOK - CENGAGECHAPTER - Quadratic Equations, Inequalities, Modulus and LogarithmsEXERCISE - Question Bank31videos
Quadratic Equations, Inequalities, Modulus and Logarithms
- BOOK - CENGAGECHAPTER - SCALER TRIPLE PRODUCTS EXERCISE - DPP 2.311videos
SCALER TRIPLE PRODUCTS
Similar Questions
Knowledge Check
- Question 1 - Select One
The graph of the function y=f(x) is symmetrical about the line x=2, then :
Af(x+2)=f(x−2)Bf(2+x)=f(2−x)Cf(x)=f(−x)Dnone of these
Draw the graph of the function: f(x)=||x−2|−3|
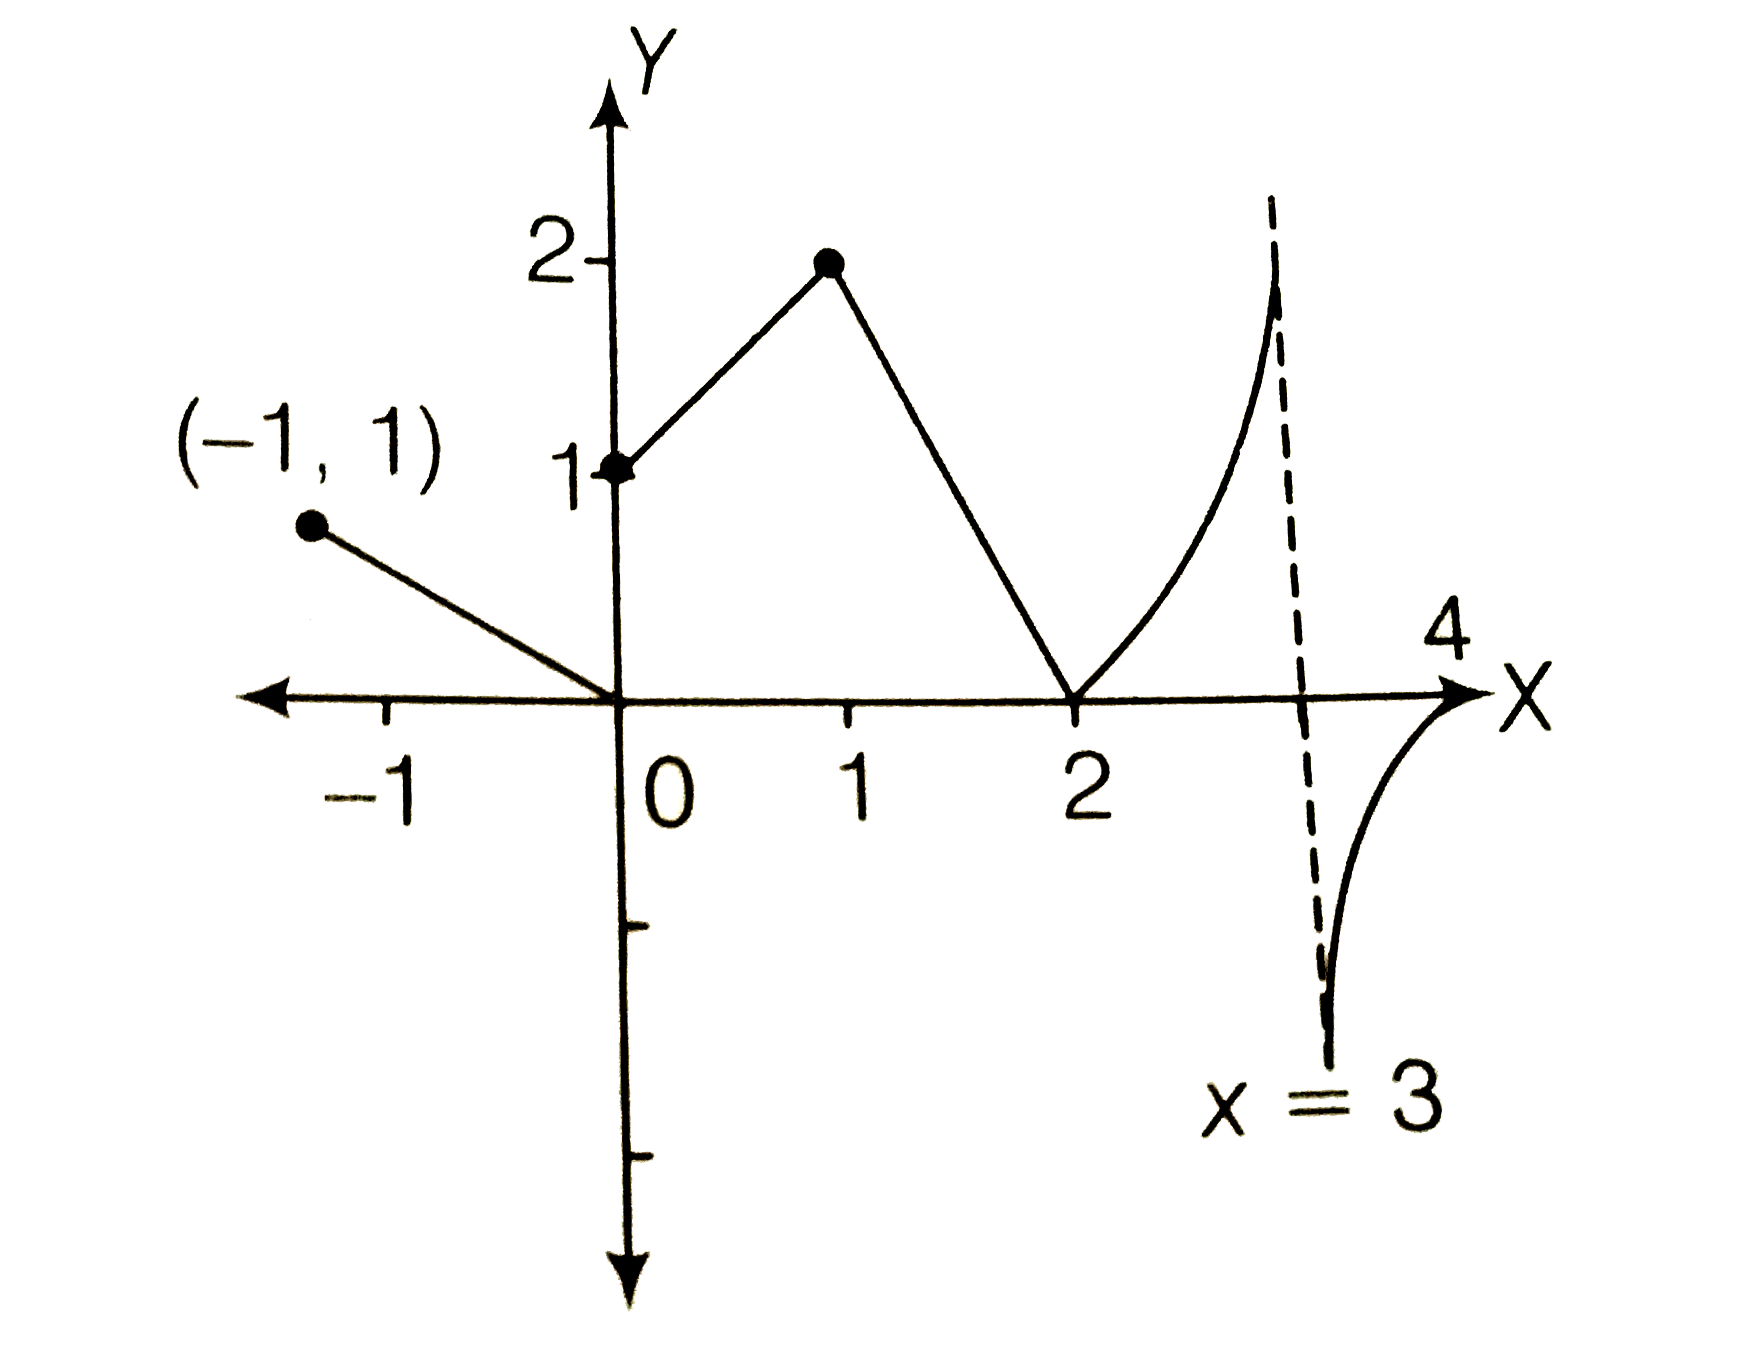
View SolutionThe graph of a function fx) which is defined in [-1, 4] is shown in the adjacent figure. Identify the correct statement(s). (1) domain of f(|x|)−1)is[−5,5] (2) range of f(|x|+1) is [0,2] (3) range of f(−|x|) is [-1,0] (4) domain of f(|x|)is[−3,3]
View SolutionIf graph of |y|=f(x)andy=|f(x)| are given as below. Then identify the correct statements
View SolutionDraw the graph of the function: f(x)=∣∣x2−3∣∣x|+2|
View SolutionDraw the graph of the function f:R→Rdefined by f(x)=x3, x∈R.
View SolutionDraw the graph of the function: f:R→R defined by f(x)=x3,x∈R
View SolutionIf the graph of the function y = f(x) is symmetrical about the line x = 2, then
View Solution


