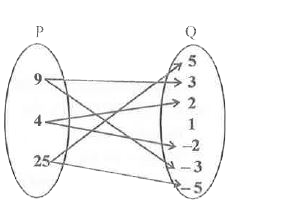
The figure shows a relation between the sets P and Q

write its domain and range Solution in Tamil
Step by step video & image solution for The figure shows a relation between the sets P and Q write its domain and range by Maths experts to help you in doubts & scoring excellent marks in Class 12 exams.
Topper's Solved these Questions
- BOOK - NEW JOYTHI PUBLICATIONCHAPTER - RELATIONS AND FUNCTIONS EXERCISE - EXERCISE25videos
RELATIONS AND FUNCTIONS
- BOOK - NEW JOYTHI PUBLICATIONCHAPTER - RELATIONS AND FUNCTIONS EXERCISE - QUESTIONS FROM COMPETITIVE EXAMS33videos
RELATIONS AND FUNCTIONS
- BOOK - NEW JOYTHI PUBLICATIONCHAPTER - PROBABILITYEXERCISE - QUESTIONS FROM COMPETITIVE EXAMS20videos
PROBABILITY
- BOOK - NEW JOYTHI PUBLICATIONCHAPTER - SEQUENCES AND SERIES EXERCISE - QUESTIONS FROM COMPETITIVE EXAMS105videos
SEQUENCES AND SERIES
Similar Questions
A={1,2,3,4},B={3,4,5} then (A×B)∩(B×A)=
01:37View SolutionIf x≠1 and f(x)=x+1x−1 is a real function then fff (2) is
02:11View SolutionIn a non-leap year the probability of getting 53 Sundays or 53 Tuesdays or 53 Thursdays is
01:31View SolutionThe sum to n terms of the series 12+34+78+1516+....... is
02:45View SolutionHow many lines of symmetry does the above figure have ?
02:17View SolutionDetermine the point of symmetry of a regular hexagon.
05:41View SolutionDtermine the images of the following figure about the given line :
03:28View SolutionMatch the following Column A to Column B
 02:31View Solution
Match the following Column A to Column B
 02:21View Solution
Match the following Column A to Column B
 02:03View Solution
Find the area of figure given below.
 02:10View Solution
Find the perimeter of the figure given below.
 02:17View Solution
Find the area of the figure given below.
 02:10View Solution
The area of the shaded part in the figure given below is ______.
 04:23View Solution
The inequation represented by the graph given below is :
01:59View SolutionThe inequation that best describes the graph given below is _________
01:21View Solution

