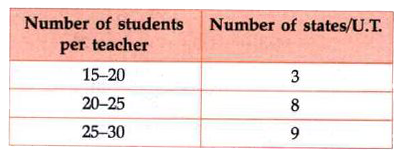
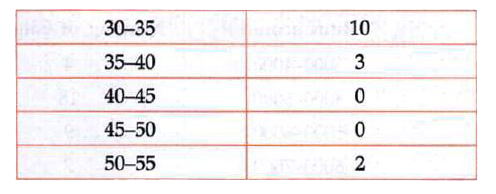
The following distribution gives the state wise teacher student ratio in higher secondary schools of India. Find the mode and mean of this data. Interpret the two measures .
Number of students per teacher Number of States /U.T. 15−20 3 20−25 8 25−30 9 30−35 10 35−40 3 40−45 0 45−50 0 50−55 2
The correct Answer is:30.6 and the mean of the given data is 29.2
Topper's Solved these Questions
- BOOK - KUMAR PRAKASHANCHAPTER - STATISTICSEXERCISE - Exercise 14.37videos
STATISTICS
- BOOK - KUMAR PRAKASHANCHAPTER - STATISTICSEXERCISE - Exercise 14.41videos
STATISTICS
- BOOK - KUMAR PRAKASHANCHAPTER - STATISTICSEXERCISE - Exercise 14.19videos
STATISTICS
- BOOK - KUMAR PRAKASHANCHAPTER - SOME AAPLICATIONS OF TRIGONOMETRYEXERCISE - Objective Questions24videos
SOME AAPLICATIONS OF TRIGONOMETRY
- BOOK - KUMAR PRAKASHANCHAPTER - SURFACE AREAS AND VOLUMESEXERCISE - TEST YOUR SKILLS5videos
SURFACE AREAS AND VOLUMES
Similar Questions
The following distribution gives the state-wise teacher-student ratio in higher secondary schools of India. Find the mode and mean of this data. Interprent the two measures.

 View Solution
There are 20 teachers in a school of 500 students. The ratio of the number of teachers to the number of students is
View Solution
Knowledge Check
- Question 1 - Select One
The mean of the following data is
{("Class interval",f),(" "10-15,5),(" "15-20,7),(" "20-25,3),(" "25-30,4),(" "30-35,8):}A22B23.05C24.05D27.05 - Question 2 - Select One
Find the approximate value of mean deviation about the mode of the following data.
{:("Class Interval",f),(" "0-10,4),(" "10-20,6),(" "20-30,3),(" "30-40,9),(" "40-50,5):}A11.5B12.5C13.5D14.5 - Question 3 - Select One
In a class of 40 students and 5 teachers, each student got sweets that are 15% of the total number of students and each teacher got sweets that are 20% of the total number of students.How many sweets were there?
A280B240C320D360
The mean weight of 20 students is 25 kg and the mean weight of another 10 students in 40 kg . Find the mean weight of the 30 students .
View SolutionThe scores in mathematics test (out of 25) of 15 students is as follows:
19, 25, 23, 20, 9, 20, 15, 10, 5, 16, 25, 20, 24, 12, 20
Find the mode and median of this data. Are they same?View SolutionThe following table gives the marks obtained by some students.
Calculate the median marks obtained by the students.
Marks0−55−1010−1515−2020−2525−3030−3535−4040−45Number of Students 6 12 17 30 10 10 8 5 2View SolutionThe scores in mathematics test (out of 25) of 15 students is as follows: 19, 25, 23, 20, 9, 20, 15, 10, 5, 16, 25, 20, 24, 12, 20 Find the mode and median of this data. Are they same?
View SolutionObtain the mean , median and mode of the following data :
Marks0−1010−2020−3030−4040−5050−6060−7070−80Number of Students 5 7 15 25 20 15 8 5View Solution

