The following pictograph shows the number of absentees in a class of 30 students during the previous week
(a) Maximum absentees were on Saturday.
(There are 8 pictures in the row for Saturday; on all
other days, the number
of pictures are less).
(b)Against Thursday, there is no picture, i.e. no one is absent.
Thus, on that day the class had full attendance.
(c) There are 20 pictures in all.
So, the total number of absentees in that
week was 20
Topper's Solved these Questions
- DATA HANDLINGBOOK - NCERT ENGLISHCHAPTER - DATA HANDLINGEXERCISE - EXERCISE 9.3
3 Videos
- DATA HANDLINGBOOK - NCERT ENGLISHCHAPTER - DATA HANDLINGEXERCISE - EXERCISE 9.4
4 Videos
- DATA HANDLINGBOOK - NCERT ENGLISHCHAPTER - DATA HANDLINGEXERCISE - EXERCISE 9.1
7 Videos
- BASIC GEOMETRICAL IDEASBOOK - NCERT ENGLISHCHAPTER - BASIC GEOMETRICAL IDEASEXERCISE - EXERCISE 4.6
4 Videos
- DECIMALSBOOK - NCERT ENGLISHCHAPTER - DECIMALSEXERCISE - EXERCISE 8.3
2 Videos
Similar Questions
The following are the details or the number of students in a class of 30 students present during a week. Day, No. of Students present Monday Tuesday Wednesday Thursday Friday Saturday, 24 20 28 30 26 22 Represent the above data by a pictograph.
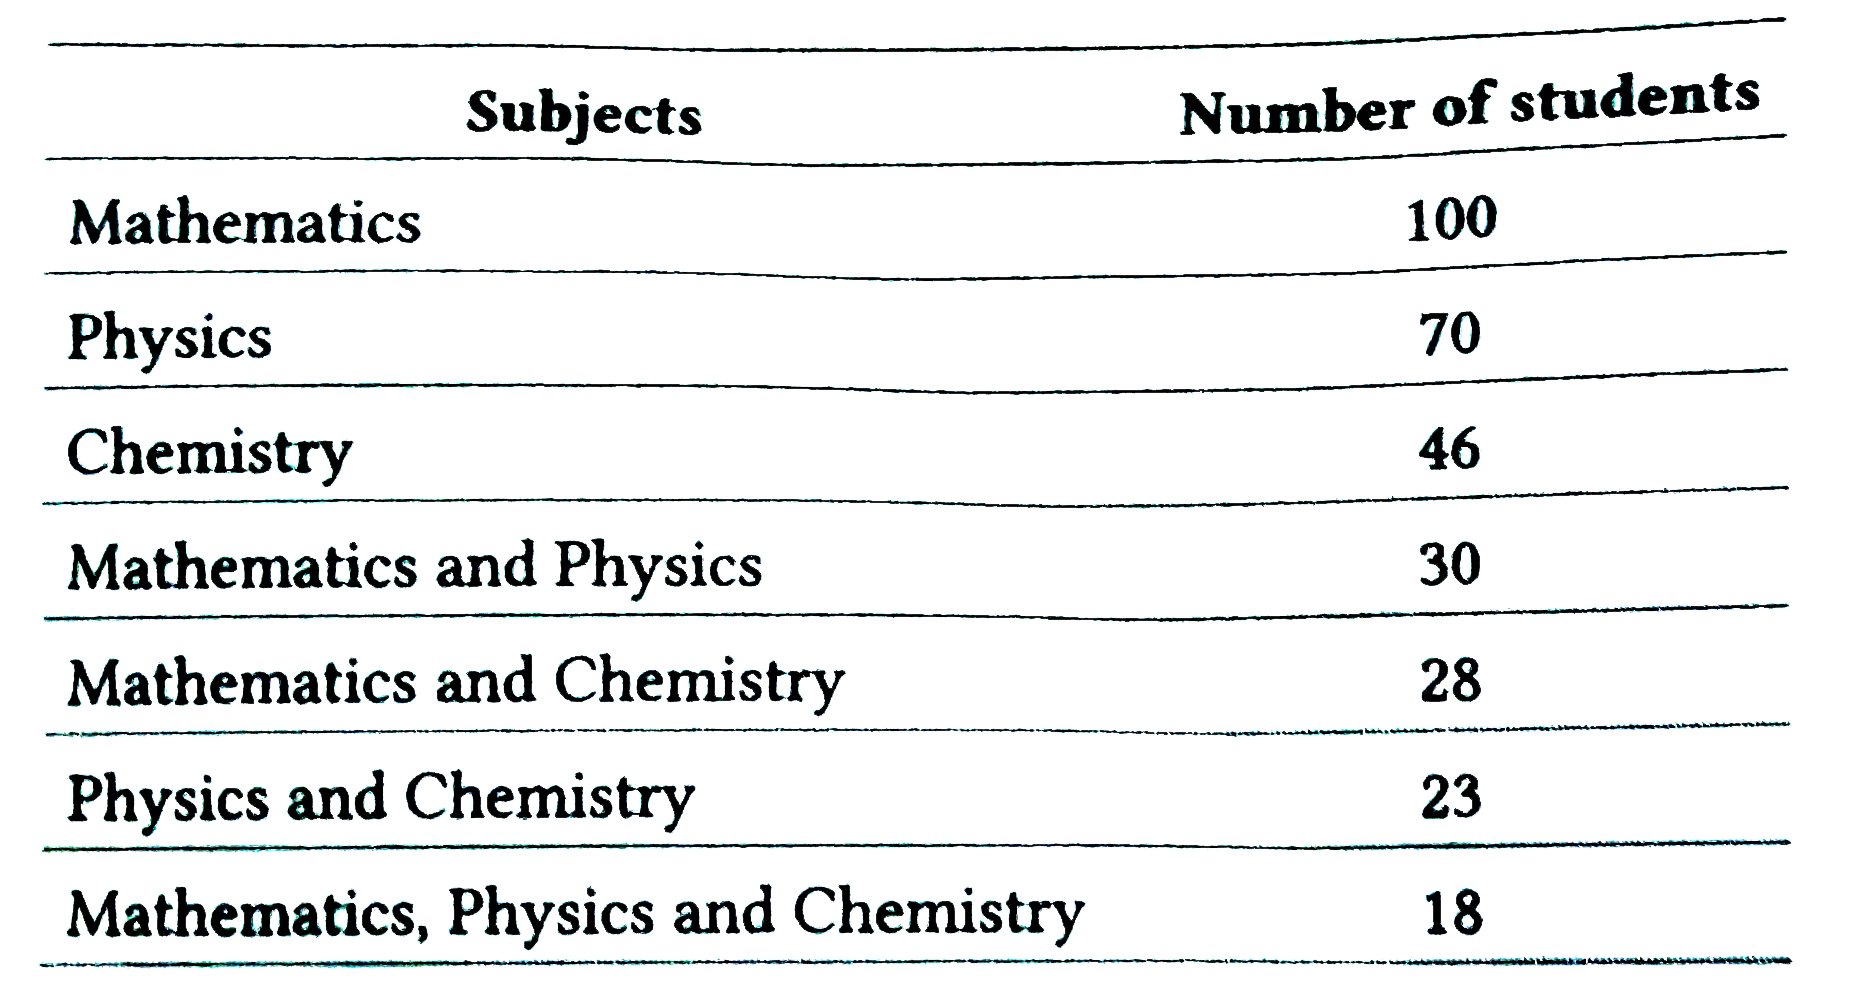
View SolutionA class has 175 students. The following table shows the number of students studying one or more of the following subjects in this case.

How many students are enrolled in Mathematics alone, Physics alone and Chemistry alone? Are there students who have not offered any one of these subjects?
View SolutionFollowing is the pictograph of the number of wrist watchesmanufactured by a factory in a particular week
View SolutionIn a class of 175 students the following data shows the number of students opting one or more subjects Mathematics 100, physics 70, chemistry 28, physics and Chemistry 23, mathematics and chemistry 28 , mathematics and physics 30 , mathematics physics and chemistry 18. how many students have offered mathematics alone ?
View SolutionIn a classroom, the students have to sit in four rows. Find the rule for the number of students in the class if the number of students in each row is n.
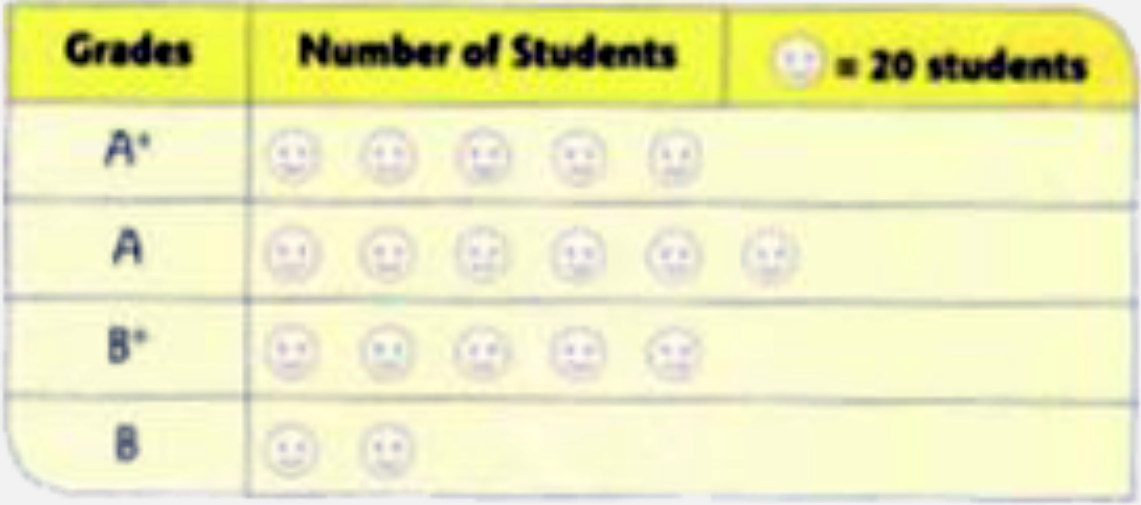
View SolutionA testing centre conducted a 'Spelling Test' for class VI students. The following pictograph represents the results of the test.

Answer the following:
How many students received B grade?
View SolutionThe following pie-chart shows the number of students admitted in different feculties of a college. If 1000 students are admitted in Science answer the following:
(i) What is the total number of students?
(ii) What is the ratio of students in science and arts?
View SolutionA testing centre conducted a 'Spelling Test' for class VI students. The following pictograph represents the results of the test.

Answer the following:
Which grade was received by the maximum number of students?
View SolutionFollowing is the pictograph of the number of wrist watches as manufactured by a factory, in a particular week

(i)On which day were least number of wrist watches manufactured?
(ii)On which day were maximum number of wrist watches manufactured?
(iii)Find out the appropriate number of wrist watches manufactured in this particular week?
View SolutionWrite the following statements into percentage form:
3 students in a class of 60 students are absent.
View Solution
