The following table gives the average temperatures, during the year 2006 and 2007. Draw a double bar graph for the given data.

Step by step video, text & image solution for The following table gives the average temperatures, during the year 2006 and 2007. Draw a double bar graph for the given data. by Maths experts to help you in doubts & scoring excellent marks in Class 7 exams.
Updated on:21/07/2023Topper's Solved these Questions
- STATISTICSBOOK - PEARSON IIT JEE FOUNDATIONCHAPTER - STATISTICSEXERCISE - CONCEPT APPLICATION Level - 1
14 Videos
- STATISTICSBOOK - PEARSON IIT JEE FOUNDATIONCHAPTER - STATISTICSEXERCISE - Level 2
22 Videos
- STATISTICSBOOK - PEARSON IIT JEE FOUNDATIONCHAPTER - STATISTICSEXERCISE - Short Answer Type
21 Videos
- SIMPLE INTEREST AND COMPOUND INTEREST BOOK - PEARSON IIT JEE FOUNDATIONCHAPTER - SIMPLE INTEREST AND COMPOUND INTEREST EXERCISE - Level 3
9 Videos
Similar Questions
The following table gives the data of number of schools (stage-wise) of a country in the year 2002.
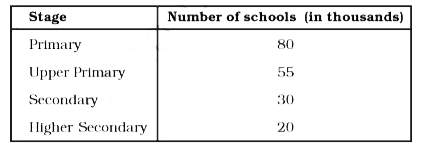
Draw a bar graph to represent the above data:
View SolutionDraw the line graph for the following table:

View SolutionThe average salary per year during period 2001-2006 is
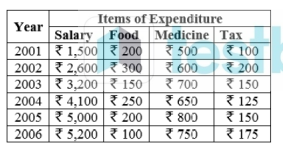
View SolutionDraw a multiple bar diagram to show the following data :

View SolutionThe following table shows the marks obtained by Sumit in the annual examination.

Draw a bar graph to show the above information.
View SolutionFollowing table gives the temperature at 12 : 00 noon on seven successive days in a city:

Draw a line graph.
View SolutionThe following table gives the data on the marks obtained by two students 'A and B' in five subjects :

Represent the data by a multiple bar diagram.
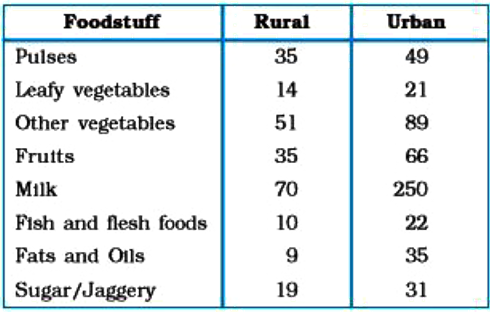
View SolutionThe following table shows the average intake of nutrients in calories by rural and urban groups in a particular year. Using a suitable scale for the given data, draw a double bar graph to compare the data.
View SolutionTake the data giving the minimum and the maximum temperature of various cities given in the table.
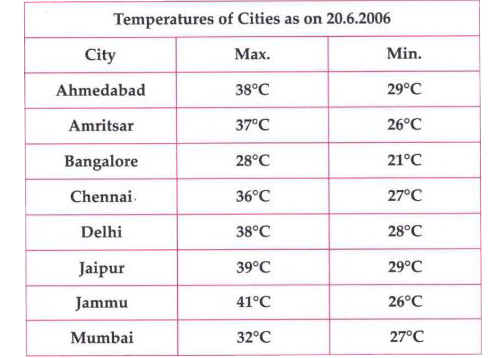
Which city has the largest difference in the minimum and maximum temperature on the given date ?
View SolutionTake the data giving the minimum and the maximum temperature of various cities given in the table.
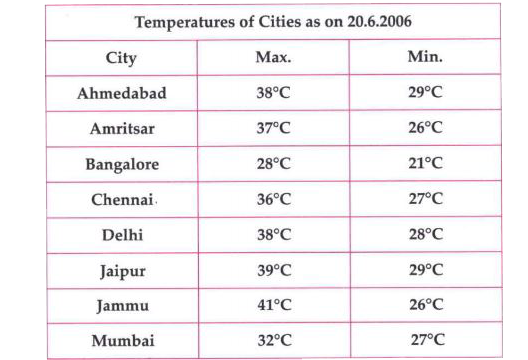
Which is the hottest city and which is the coldest city ?
View Solution
