The given bar graph shows the number of identical articles sold by 5 different stores A, B, C, D and E during a particular month.
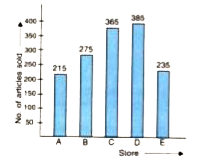
Study the bar graph and answer the following questions :
(i) Which store sold the largest number of articles ?
(ii) By what per cent is the sale of store D more than that of store B ?
(iii) Find the ratio of the total sale of the two highest selling stores to the total sale of the two least selling stores.
(iv) By how much must store E increase its sale to catch up with its nearest rival store ?
Step by step video & image solution for The given bar graph shows the number of identical articles sold by 5 different stores A, B, C, D and E during a particular month. Study the bar graph and answer the following questions : (i) Which store sold the largest number of articles ? (ii) By what per cent is the sale of store D more than that of store B ? (iii) Find the ratio of the total sale of the two highest selling stores to the total sale of the two least selling stores. (iv) By how much must store E increase its sale to catch up with its nearest rival store ? by Maths experts to help you in doubts & scoring excellent marks in Class 8 exams.
Updated on:21/07/2023Topper's Solved these Questions
- DATA HANDLING BOOK - ICSECHAPTER - DATA HANDLING EXERCISE - EXERCISE 22 (A)
5 Videos
- DATA HANDLING BOOK - ICSECHAPTER - DATA HANDLING EXERCISE - EXERCISE 22 (A) ( Fill in the blanks : )
5 Videos
- CUBES AND CUBE - ROOTS BOOK - ICSECHAPTER - CUBES AND CUBE - ROOTS EXERCISE - EXERCISE 4(B)
39 Videos
- DIRECT AND INVERSE VARIATIONSBOOK - ICSECHAPTER - DIRECT AND INVERSE VARIATIONSEXERCISE - EXERCISE 10 (E)
19 Videos
Similar Questions
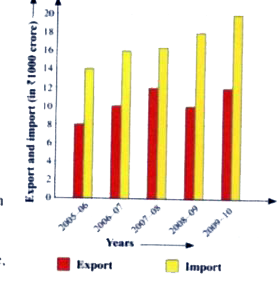
Read the bar graph and answer the following questions.
What information is given by the bar graph?
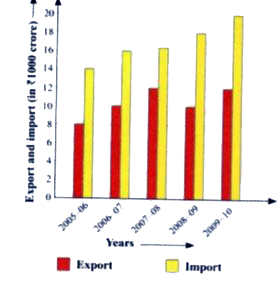
View SolutionRead the bar graph and answer the following questions.
in which year the value of the export is greater than that of the import?
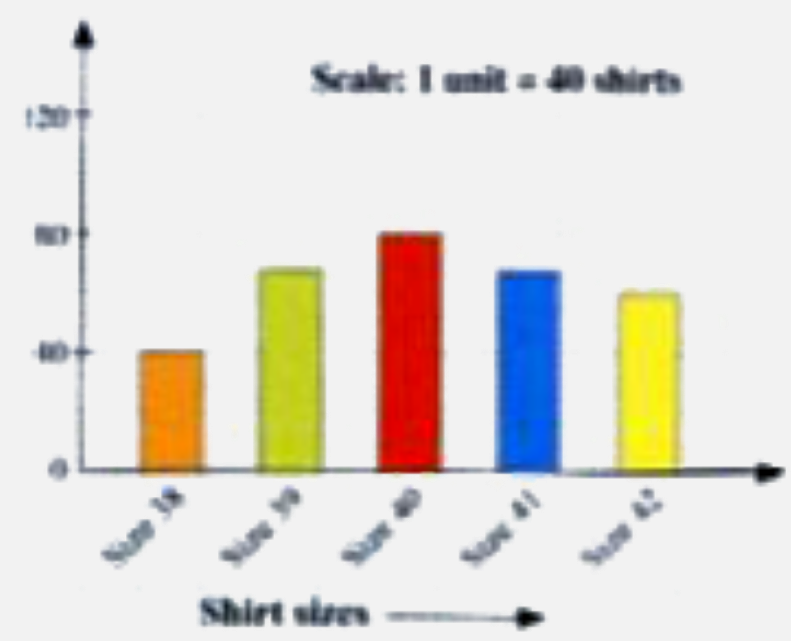
View SolutionRead the following graph and answer the following question.
What are the different sizes of shirts that are sold?
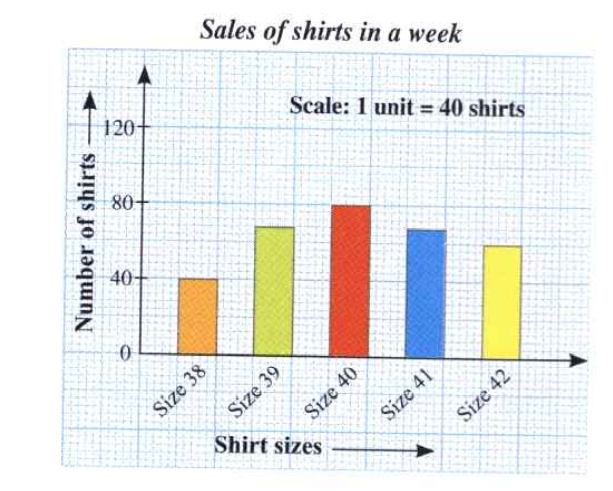
View SolutionRead the following graph and answer the following question.
Find the ratio of the number of shirts of size 38 sold to the number of shirts of size 42 sold.
View SolutionObserve the bar graph given below :
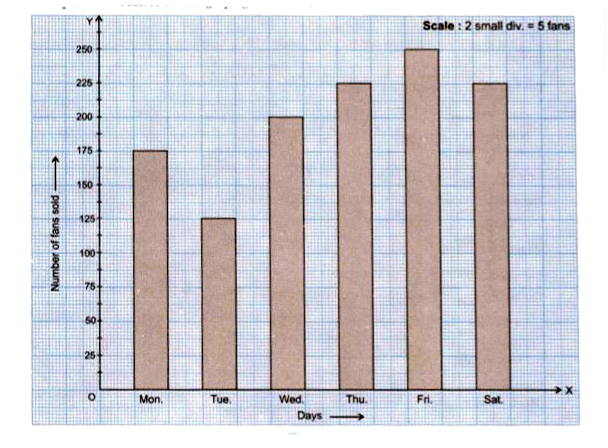
Read the bar graph carefully and answer the following questions :
What was the total sale during the week?
View SolutionObserve the bar graph given below :
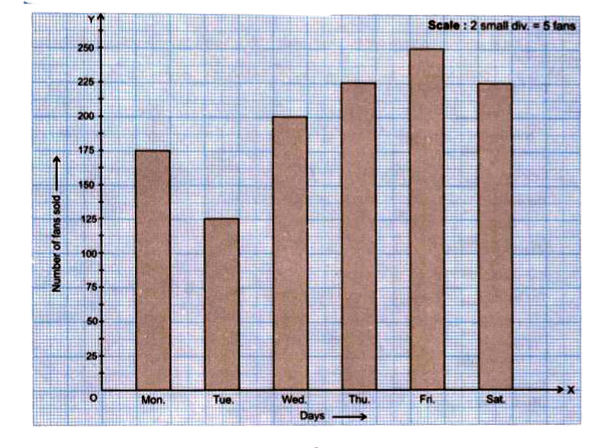
Read the bar graph carefully and answer the following questions :
What is the ratio between the minimum sale and the maximum sale?
View SolutionStudy the given algae and asnwer the following questions :-
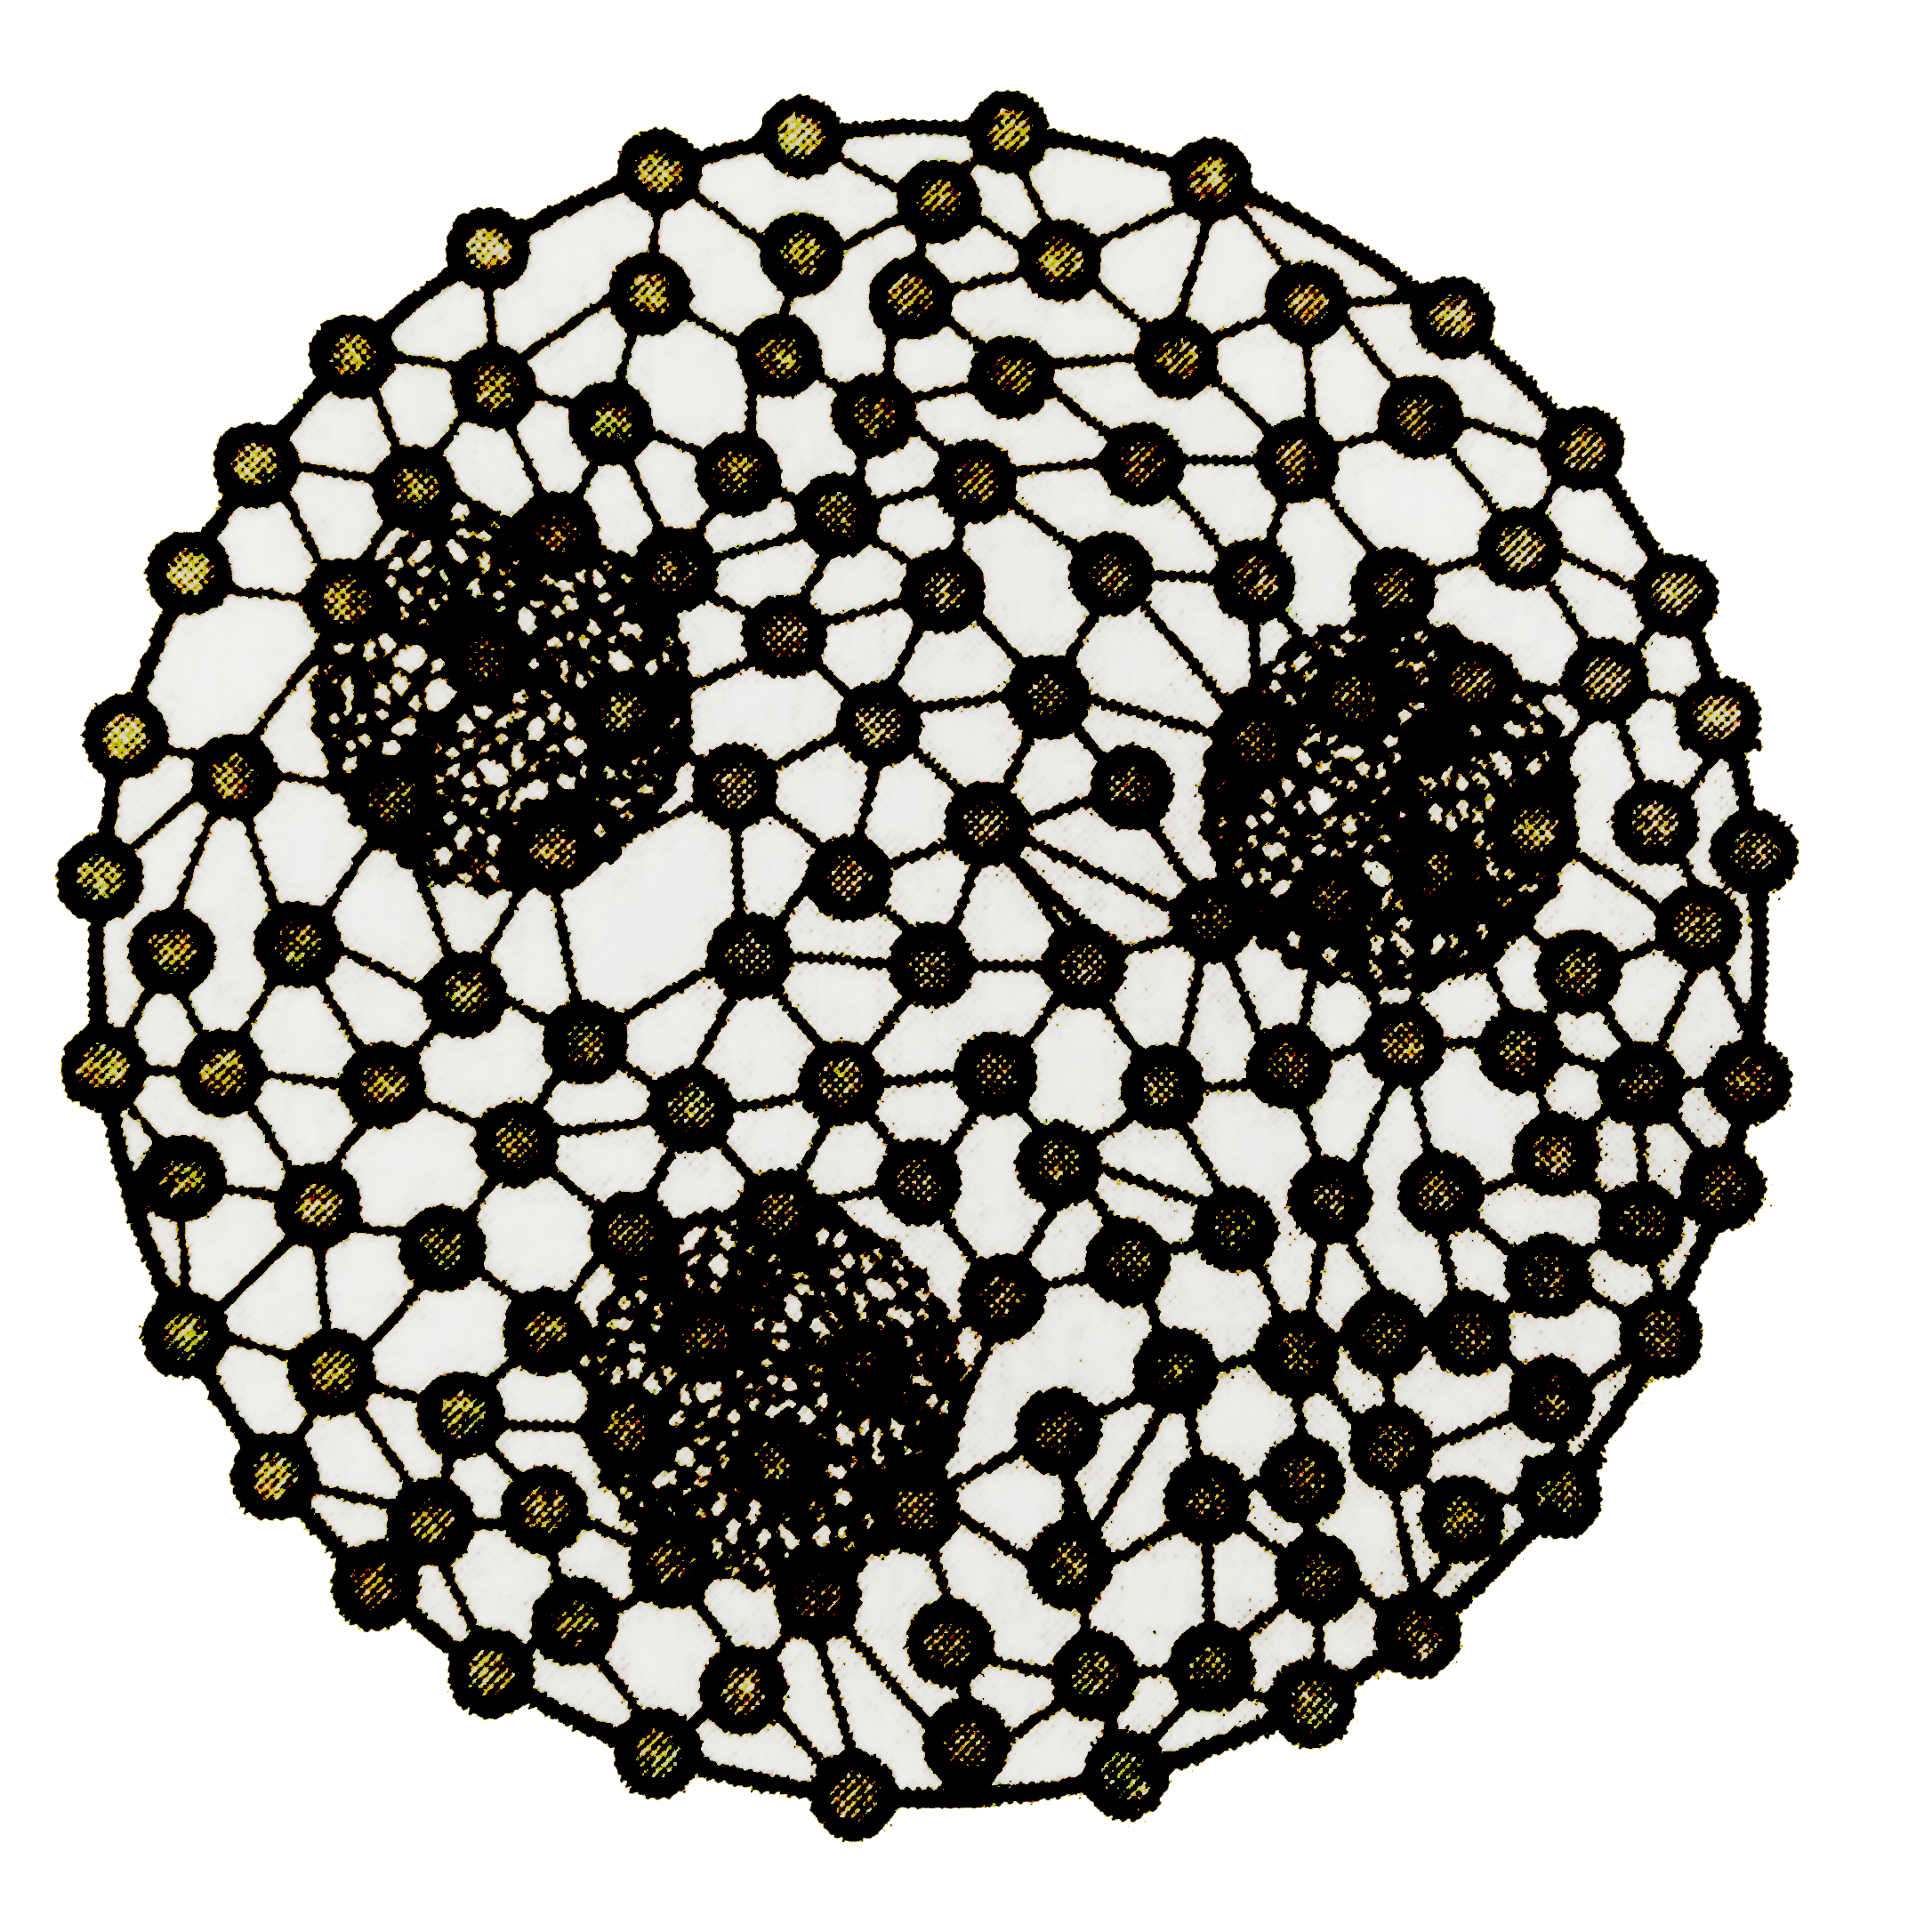
(a) Name of alage ?
(b) Tpe of sexual reproduction ?
(c) Name of division ?
(d) Stored food ?
View SolutionObserve the bar graph given below :
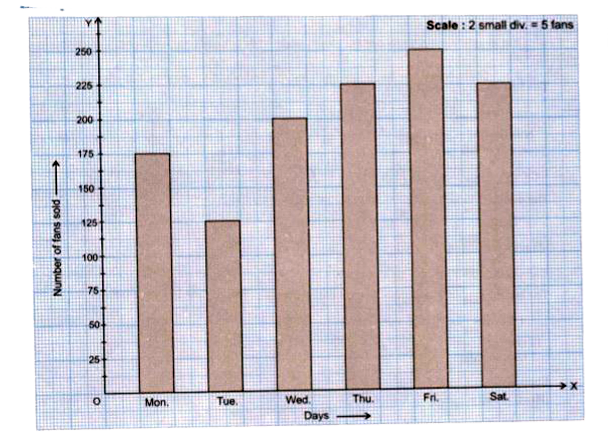
Read the bar graph carefully and answer the following questions :
On which day of the week was the sale maximum?
View SolutionObserve the bar graph given below :
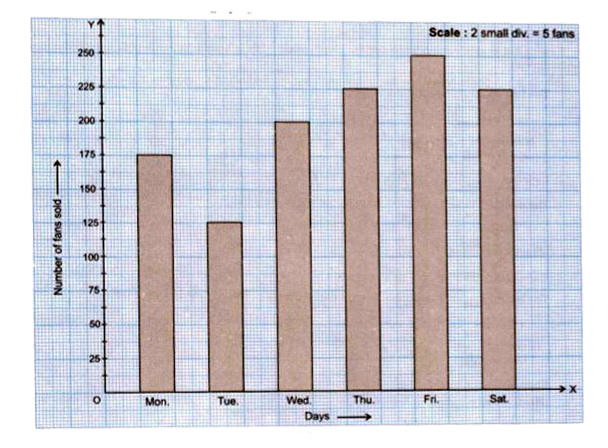
Read the bar graph carefully and answer the following questions :
What information is given by the bar graph?
View SolutionGiven below is a bar graph showing the heights of five mountain peaks.
Read the bar graph carefully and answer the following questions:
(i) Which is the highest peak and what is its height?
(ii) What is the ratio of the heights of the highest peak and the next highest peak?
(iii) Arrange the heights of the given peaks in descending order.
View Solution
