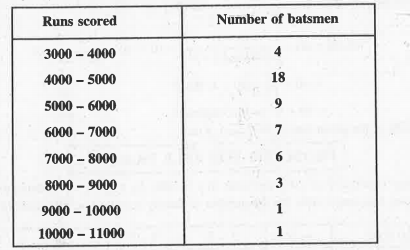
The given distribution shows the number of runs scored by some top batsmen of the world in one-day international cricket matches.
Runs scored Number of batsmen 3000−4000 44000−5000 185000−6000 96000−7000 77000−8000 68000−9000 39000−10000 110000−11000 1
Find the mode of the data Solution in Gujrati
The correct Answer is:4608.7 runs.
Step by step video, text & image solution for The given distribution shows the number of runs scored by some top batsmen of the world in one-day international cricket matches. {:("Runs scored ","Number of batsmen "),(3000-4000," "4),(4000-5000," "18),(5000-6000," "9),(6000-7000," "7),(7000-8000," "6),(8000-9000," "3),(9000-10000," "1),(10000-11000," "1):} Find the mode of the data by Maths experts to help you in doubts & scoring excellent marks in Class 10 exams.
Topper's Solved these Questions
- BOOK - KUMAR PRAKASHANCHAPTER - STATISTICSEXERCISE - Exercise 14.37videos
STATISTICS
- BOOK - KUMAR PRAKASHANCHAPTER - STATISTICSEXERCISE - Exercise 14.41videos
STATISTICS
- BOOK - KUMAR PRAKASHANCHAPTER - STATISTICSEXERCISE - Exercise 14.19videos
STATISTICS
- BOOK - KUMAR PRAKASHANCHAPTER - SOME AAPLICATIONS OF TRIGONOMETRYEXERCISE - Objective Questions24videos
SOME AAPLICATIONS OF TRIGONOMETRY
- BOOK - KUMAR PRAKASHANCHAPTER - SURFACE AREAS AND VOLUMESEXERCISE - TEST YOUR SKILLS5videos
SURFACE AREAS AND VOLUMES
Similar Questions
The following frequency distribution gives the monthly consumption of electricity of 68 consumers of a locality . Find the median, mean and mode of the data and compare them .
Monthly consumption (in units) Number of consumers 65−85 4 85−105 5 105−125 13 125−145 20 145−165 14 165−185 8 185−205 401:58View SolutionDuring the medical check-up of 35 students of a class. their weights were recorded as follows :
weight (in kg) Number of students Less than 38 0Less than 40 3Less than 42 5Less than 44 9Less than 46 14Less than 48 28Less than 50 32Less than 52 35
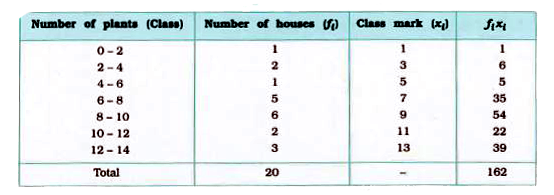
Draw a less than type ogive for the given data. Hence obtain the median weight from the graph and verify the result by using the formula03:23View SolutionA survey was conducted by a group of students as a part of their environment awareness programme, in which they collected the following data regarding the number of plants in 20 houses in a locality . Find the mean number of plants per house.
Number of plants 0−22−44−66−88−1010−1212−14Number of houses 1 2 1 5 6 2 3
Which method did you use for finding the mean, and why ?
 05:11View Solution
A kite is flying at a height of 75m from the level ground, attached to a taut string inclined at 60∘ to the horizontal. Then, the length of the string is …………m
04:09View SolutionThe slant height of a frustum of a cone is 4 m and the perimeter of circular ends are 18 m and 16 m. Find the cost of painting its curved surface at 10 per sq. m.
04:35View SolutionThe given distribution shows the number of runs scored by some top batsmen of the world in one-day international cricket matches.Find the mode of the data.
02:52View Solutionदिया हुआ बंटन विश्व के कुछ श्रेष्ठतम बल्लेबाजों द्वारा एकदिवसीय अंतरष्ट्रीय क्रिकेट मेंचों में बनाए गए रनों को दर्शाता है ।
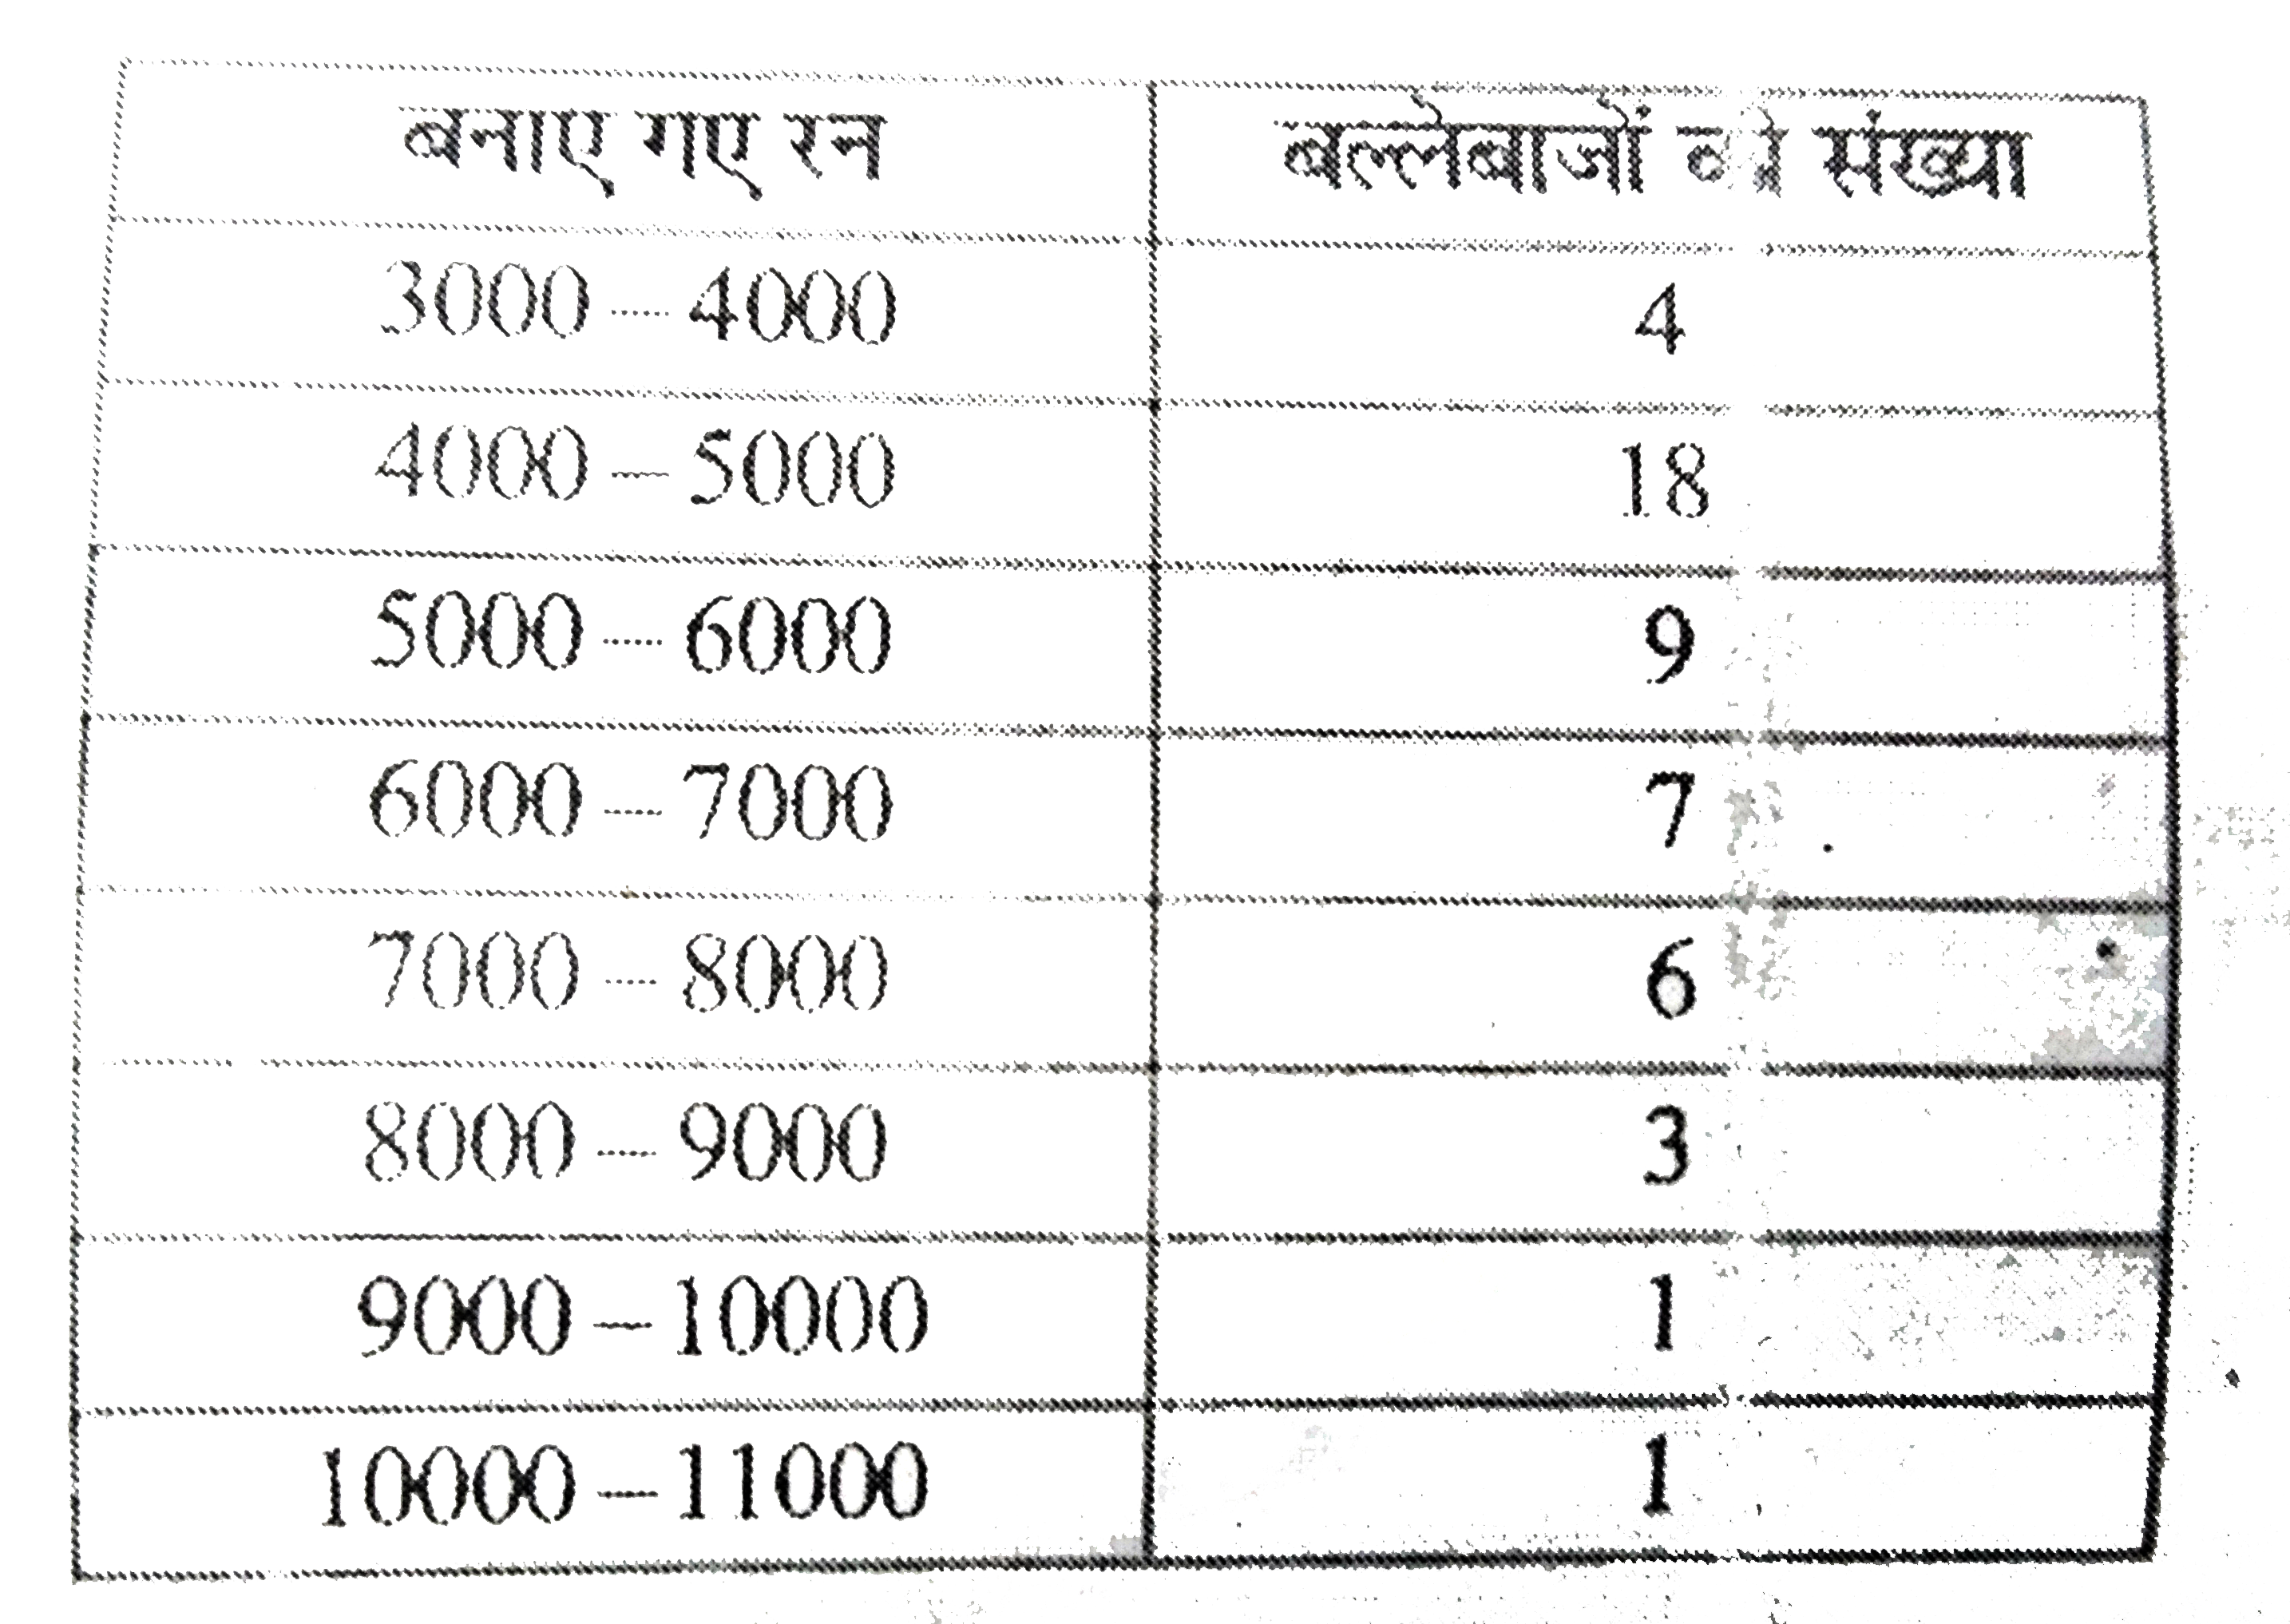
इन आँकड़ों का बहुलक ज्ञात कीजिए।View SolutionThe given distrbution shows the numbers of runs scored by some top batsmen of the world in one -day international cricket matches .
RunsNumber of batsmen3000−400044000−5000185000−600096000−700077000−800068000−900039000−10000110000−110001
Find the mode of the data .02:16View SolutionThe monthly salary of 10 employees in a factory are given below :
₹5000, ₹7000, ₹5000, ₹7000, ₹8000, ₹7000, ₹7000, ₹8000, ₹7000, ₹5000
Find the mean, median and mode.02:22View SolutionThe given distribution shows the number of runs scored by some top batsmen of the world in one-day international cricket matches.
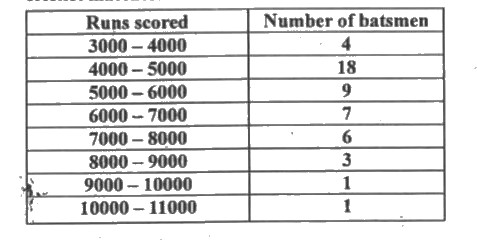
Find the mode of the distribution.03:36View SolutionThe given distribution shows the number of runs scored by some top batsmen of the world in one-day international cricket matches.

Find the mode of the data.03:05View SolutionThe given distribution shows the number of runs scored by some top batsmen of the world in one-day international cricket matches.
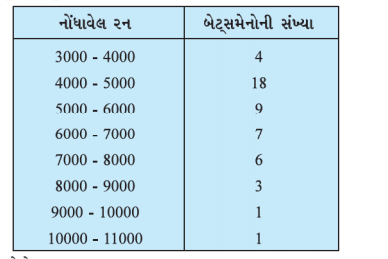
Find the mode of the data.04:28View SolutionThe given distribution shows the number of runs scored by some top batsmen of the world in one-day international cricket matches.Find the mode of the data.
05:33View SolutionThe following frequency distribution shows the number of runs scored by some batsmen of India in one-day cricket matches :
 07:57View Solution
The given distribution shows the number of runs scored by some top batsmen of the world in one-day international cricket matches. Runs scored 3000-4000 4000-5000 5000-6000 6000-7000 7000-8000 8000-9000 9000-10000 10000-11000 No. of batsmen 4 18 9 7 6 3 1 1. Find the mode of the data.
05:02View SolutionThe given distribution shows the number of runs scored by some top batsmen of the world in one-day international cricket matches
Find the mode of the data.08:52View Solution

