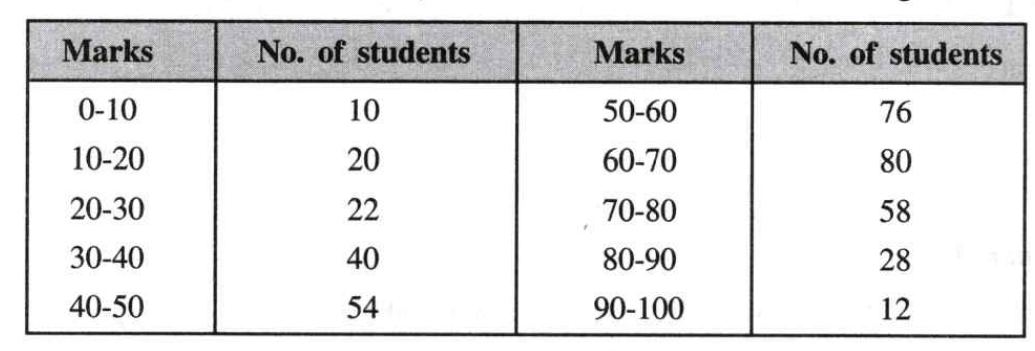
The marks obtained (out of 100) by a class of 80 students are given below:

Construct a histogram to represent the data above
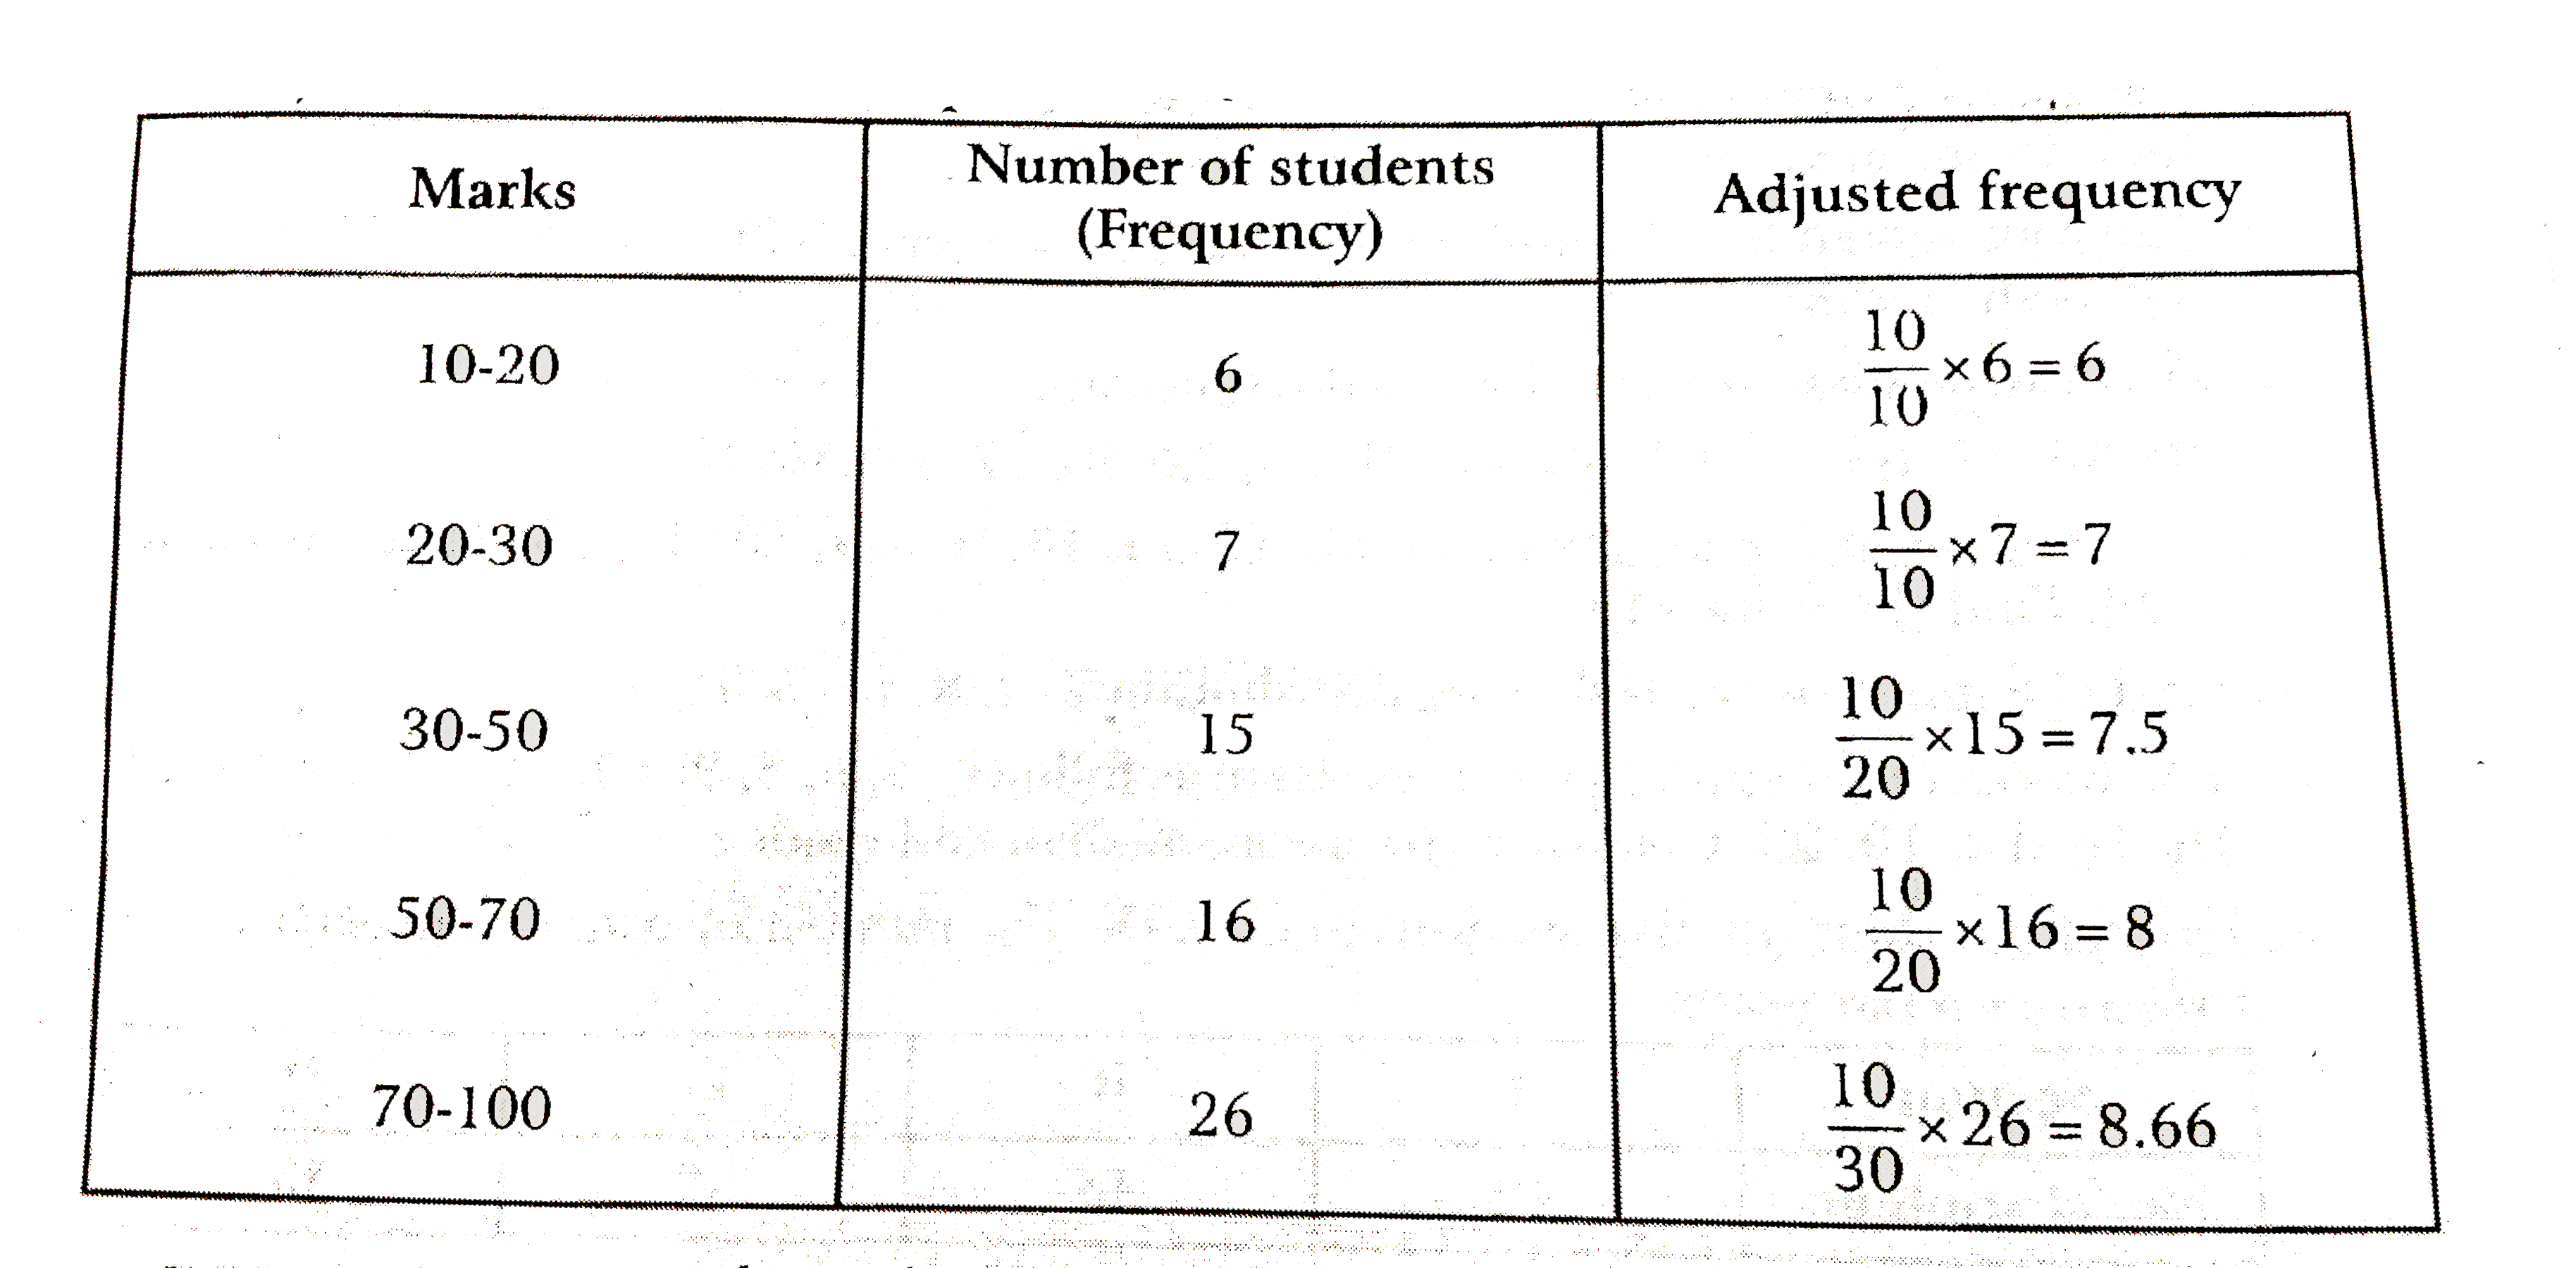
Here, the class intervals are of unequal width. So, we shall first input compute adjusted frequencies of each class. The minimum class-size is 20-10=10. The adjusted frequencies are computed by using the following formula
Adjusted frequency=minimum class-sizeclass-size×frequency of the class

Now, we construct rectangles with class-limits as bases and respective adjusted frequencies as heights.

Topper's Solved these Questions
- BOOK - NAGEEN PRAKASHAN ENGLISHCHAPTER - STATISTICSEXERCISE - Exercise 14a10videos
STATISTICS
- BOOK - NAGEEN PRAKASHAN ENGLISHCHAPTER - STATISTICSEXERCISE - EXERCISE 14B13videos
STATISTICS
- BOOK - NAGEEN PRAKASHAN ENGLISHCHAPTER - STATISTICSEXERCISE - Revision Exercise12videos
STATISTICS
- BOOK - NAGEEN PRAKASHAN ENGLISHCHAPTER - QUADRILATERALSEXERCISE - Revision Exercise (long Answer Questions)5videos
QUADRILATERALS
- BOOK - NAGEEN PRAKASHAN ENGLISHCHAPTER - SURFACE AREA AND VOLUMEEXERCISE - Revision Exercise (long Answer Questions)10videos
SURFACE AREA AND VOLUME
Similar Questions
In a class of 40 students, the marks obtained (out of 50) are as given below:

Draw a histogram to represent the given data.View SolutionThe marks obtained (out of 100) by 400 students in an examination are given below:

Using a graph paper, draw an ogive for the above distribution. Use ogive to estimate the following: estimate the number of students who obtained more than 80% marks in the examination.View SolutionThe marks obtained (out of 100) by 400 students in an examination are given below:

Using a graph paper, draw an ogive for the above distribution. Use ogive to estimate:
the number of students who did not pass if the pass percentage was 35.View SolutionThe marks obtained (out of 100) by 400 students in an examination are given below:

Using a graph paper, draw an ogive for the above distribution. Use ogive to estimate the following: estimate the median.View Solution(Use a graph paper for this question). The daily pocket expenses of 200 students in a school are given below:

Draw a histogram representing the above distribution and estimate the mode from the graph.View SolutionThe daily pocket expenses of 206 students in a school are given below.

Construct a frequency polygon representing the above data.View SolutionIn a school, there are five sections of class VII. The number of students in each section is given below. Construct a bar graph representing this data: Section, A, B, C, D, E No. of Students, 40, 48, 52, 45, 30
View SolutionIn a school, there are five sections of class IX. The number of students in each section is given below. Construct a bar graph representing this data: Section: A B C D E No. of Students 40 48 52 45 30
View SolutionThe expenditure of a family of different heads in a month is given below

Draw a bar graph to represent the data above.View SolutionDraw a histogram for the marks of students given below:
 View Solution

