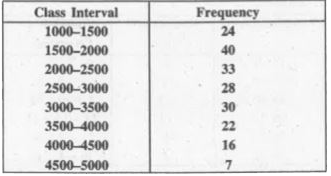
The mode of a frequency distribution can be determined graphically from ......
Bar graph
ogive
Histogram
Pie chart
The correct Answer is:C
Topper's Solved these Questions
- STATISTICSBOOK - OSWAL PUBLICATIONCHAPTER - STATISTICSEXERCISE - Very Short Answer Type Questions
4 Videos
- STATISTICSBOOK - OSWAL PUBLICATIONCHAPTER - STATISTICSEXERCISE - Short Answer Type Questions
2 Videos
- STATISTICSBOOK - OSWAL PUBLICATIONCHAPTER - STATISTICSEXERCISE - BOARD CORNER (Long answer type questions)
7 Videos
- SOME APPLICATIONS OF TRIGONOMETRY (HEIGHTS AND DISTANCES) BOOK - OSWAL PUBLICATIONCHAPTER - SOME APPLICATIONS OF TRIGONOMETRY (HEIGHTS AND DISTANCES) EXERCISE - CASE-BASED MCQs
15 Videos
- SURFACE AREAS AND VOLUMES BOOK - OSWAL PUBLICATIONCHAPTER - SURFACE AREAS AND VOLUMES EXERCISE - BOARD CORNER (LONG ANSWER TYPE QUESTIONS)
9 Videos
Similar Questions
Knowledge Check
The mode of a frequency distribution is obtained graphically from
Aa frequency curveBa frequency polygonCa histogramDan ogiveMode of distribution can be obtained from :
AMore than type ogivesBLess than type ogivesCHistogramDFrequency polygon
Find the mode of following frequency distribution :

View SolutionThe median of a frequency distribution is found graphically with the help of
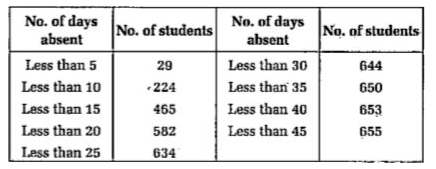
View SolutionRecast the following cumulative table in the from of an ordinary frequency distribution and determine the value of the mode by using the formula : mode = 3 median -2 mean

View SolutionThe median of a given frequency distribution is found graphically with the help of (a) Histogram (b) Frequency curve (c) Frequency polygon (d) Ogive
View SolutionThe median of a given frequency distribution is found graphically with the help of (a) Histogram (b) Frequency curve (c) Frequency polygon (d) Ogive
View SolutionFind the mode of the following frequency distribution :

View Solution

