The relative humidity (in %) of a certain city for a month of 30 days was as follows :
 : What is the range of this data ?
Solution in Punjabi
The correct Answer is:14.3
Step by step video, text & image solution for The relative humidity (in %) of a certain city for a month of 30 days was as follows : : What is the range of this data ? by Maths experts to help you in doubts & scoring excellent marks in Class 9 exams.
Topper's Solved these Questions
- BOOK - SWAN PUBLICATIONCHAPTER - STATISTICS EXERCISE - EXERCISE 14.317videos
STATISTICS
- BOOK - SWAN PUBLICATIONCHAPTER - STATISTICS EXERCISE - EXERCISE 14.47videos
STATISTICS
- BOOK - SWAN PUBLICATIONCHAPTER - STATISTICS EXERCISE - Objective Type Questions (Fill in Blanks:)1videos
STATISTICS
- BOOK - SWAN PUBLICATIONCHAPTER - QUADRILATERALSEXERCISE - Objective Type Questions ( Fill in the Blanks)10videos
QUADRILATERALS
- BOOK - SWAN PUBLICATIONCHAPTER - SURFACE AREAS AND VOLUMES EXERCISE - Objective Type Questions (Fill in the Blanks )7videos
SURFACE AREAS AND VOLUMES
Similar Questions
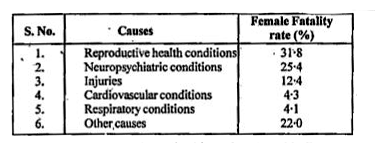
A survey conducted by an organisation for the cause of illness and death among the women between the ages 15-44 (in years) worldwide, found the following figures (in %):

Represent the information given above graphically.01:37View SolutionThe following number of goals were scored by a team in a series of 10 matches : 2, 3, 4, 5, 0, 1, 3, 3, 4, 3 Find mean, median and mode of these scores :
06:07View SolutionThe mid value of the class intervals is known as the ...........
02:11View SolutionSum of the angles of a quadrilateral is ................ .
01:31View SolutionTotal surface area of a cone = ..............
02:45View SolutionHow many lines of symmetry does the above figure have ?
02:17View SolutionWhich of the following are correct chain isomers of butane ? (i)
05:41View SolutionDetermine the point of symmetry of a regular hexagon.
02:10View SolutionDtermine the images of the following figure about the given line :
02:17View SolutionMatch the following Column A to Column B
 02:10View Solution
Match the following Column A to Column B
 04:23View Solution
Match the following Column A to Column B
 01:19View Solution
The inequation represented by the graph given below is :
03:12View SolutionThe inequation that best describes the graph given below is _________
01:43View SolutionThe inequation that best describes the following graph is _________
01:45View SolutionWhich inequations represent the shaded region in the given figure
02:41View Solution

