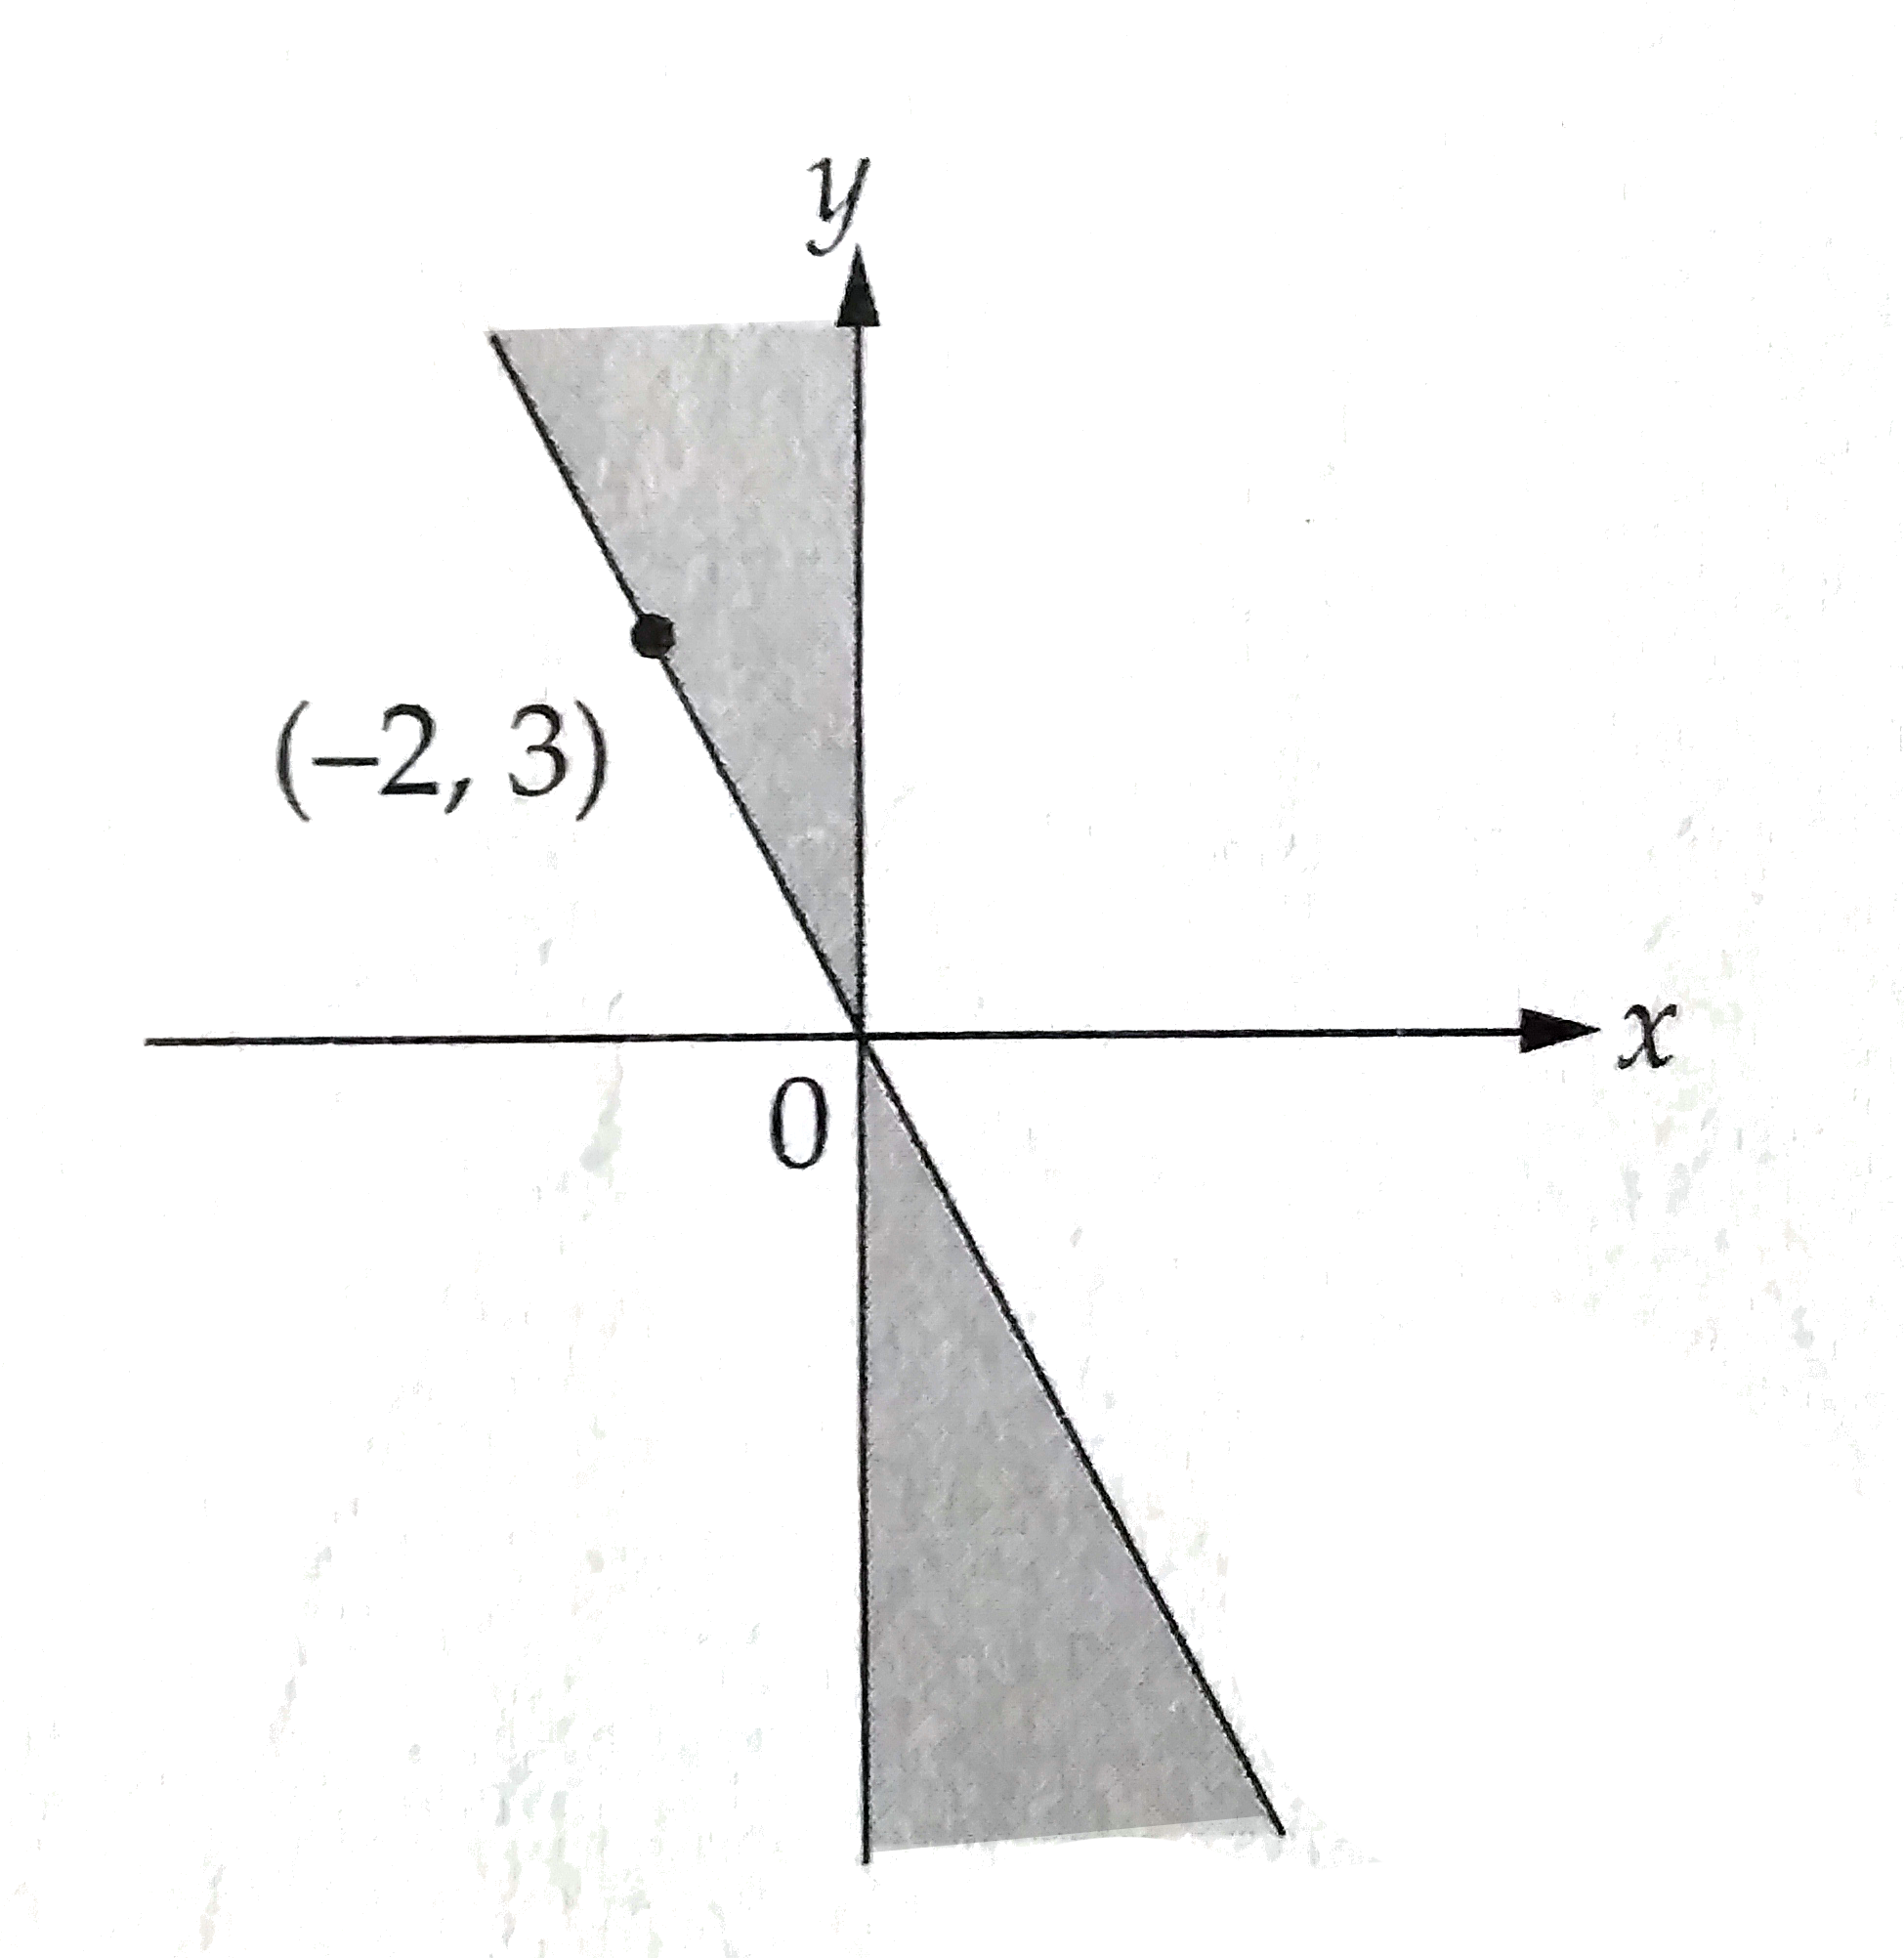
The shaded portion of Figure shows the graph of which of the following ?
A
x(y−23x)>0
B
x(y−32x)≥0
C
x(y+32)≥0
D
x(y+32x)≤0
Video Solution
Text Solution
The correct Answer is:D
First find the equation of the line to help you eliminate answer choices. The line passes through point (-2, 3) and the origin, so its equation is y=−32x.
According to the graph, you're looking for the answer choice that has the following properties : x≤0 and y≥−32x (the shaded protion of the second quadrant)
IN ADDITION
x≥0 and y≤−32x (the shaded portion of the fourth quadrant).
To fulfill the first set of requirements, it is necessary that x≤0 and y+32x≥0 .
The product of these two expressions has to be negative, because the product of a negative and a positive is always negative. Therefore, (x)(y+32x)≤0. To fulfill the second set of requirements, it is necessary that x≥0 and y+32x≤0.
Once again, the product of these two expression has to be negative, resulting in the same inequality.
Therefore, x(y+32x)≤0 fits the shaped portions of the graph.
|
Topper's Solved these Questions
- COORDINATE GEOMETRY BOOK - KAPLANCHAPTER - COORDINATE GEOMETRY EXERCISE - COORDINATE GEOMETRY FOLLOW - UP TEST
6 Videos
- CIRCLESBOOK - KAPLANCHAPTER - CIRCLESEXERCISE - Multiple Choice Question
12 Videos
- EXPONENTS, RADICALS, POLYNOMIALS, AND RATIONAL EXPRESSIONS BOOK - KAPLANCHAPTER - EXPONENTS, RADICALS, POLYNOMIALS, AND RATIONAL EXPRESSIONS EXERCISE - Multiple Choice Question
20 Videos
Similar Questions
Knowledge Check
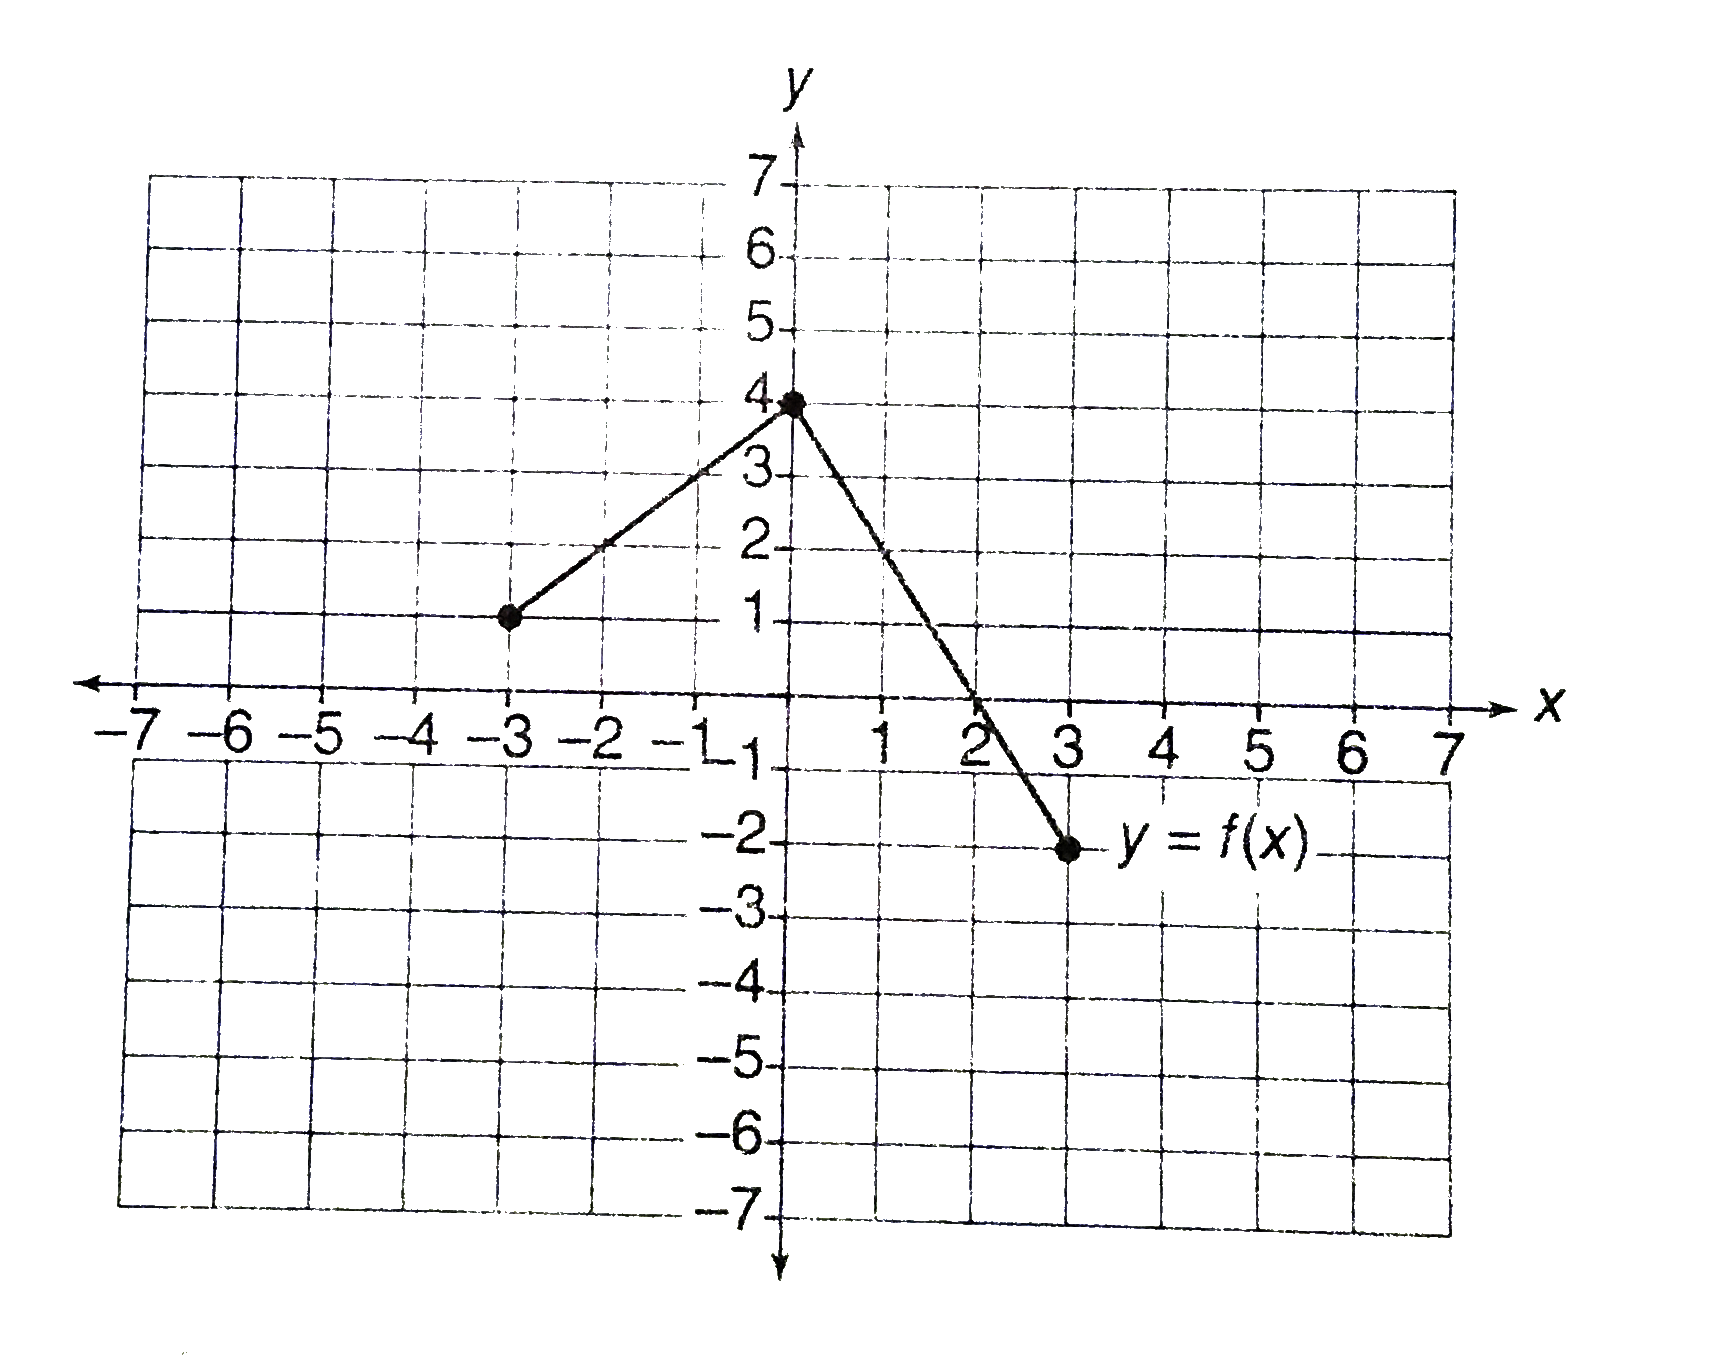
If the accomanying figure above shows the graph of function f, which of the following could represent the graph of y=f(x+1)?A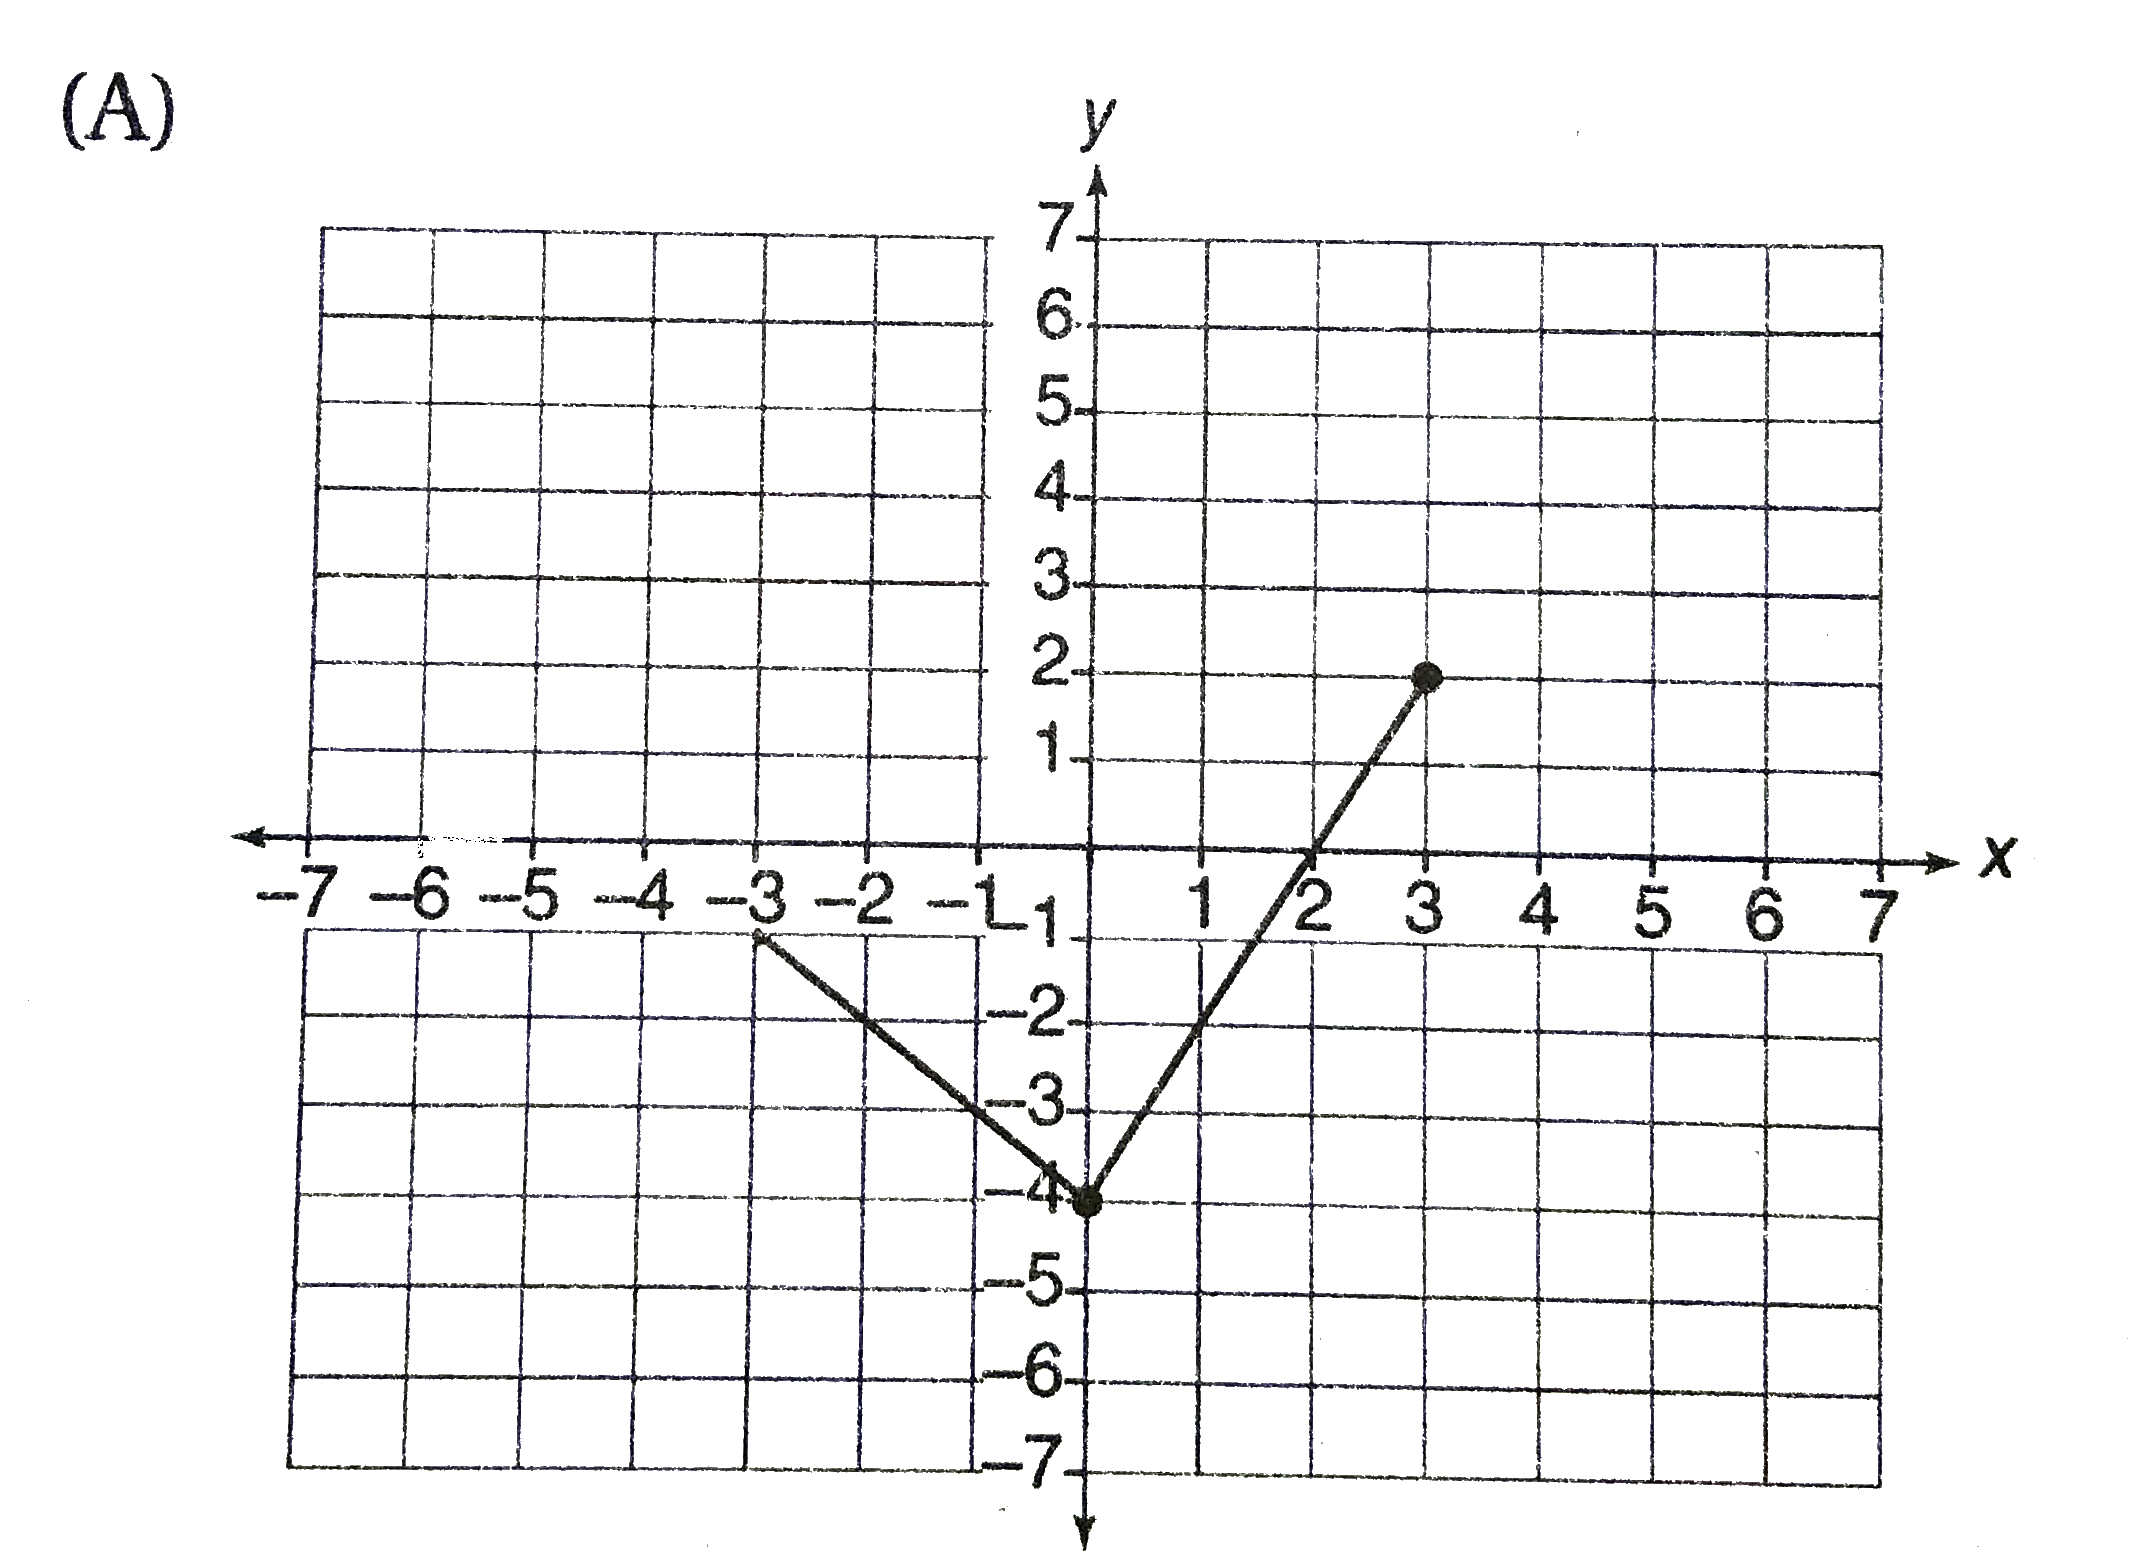 B
B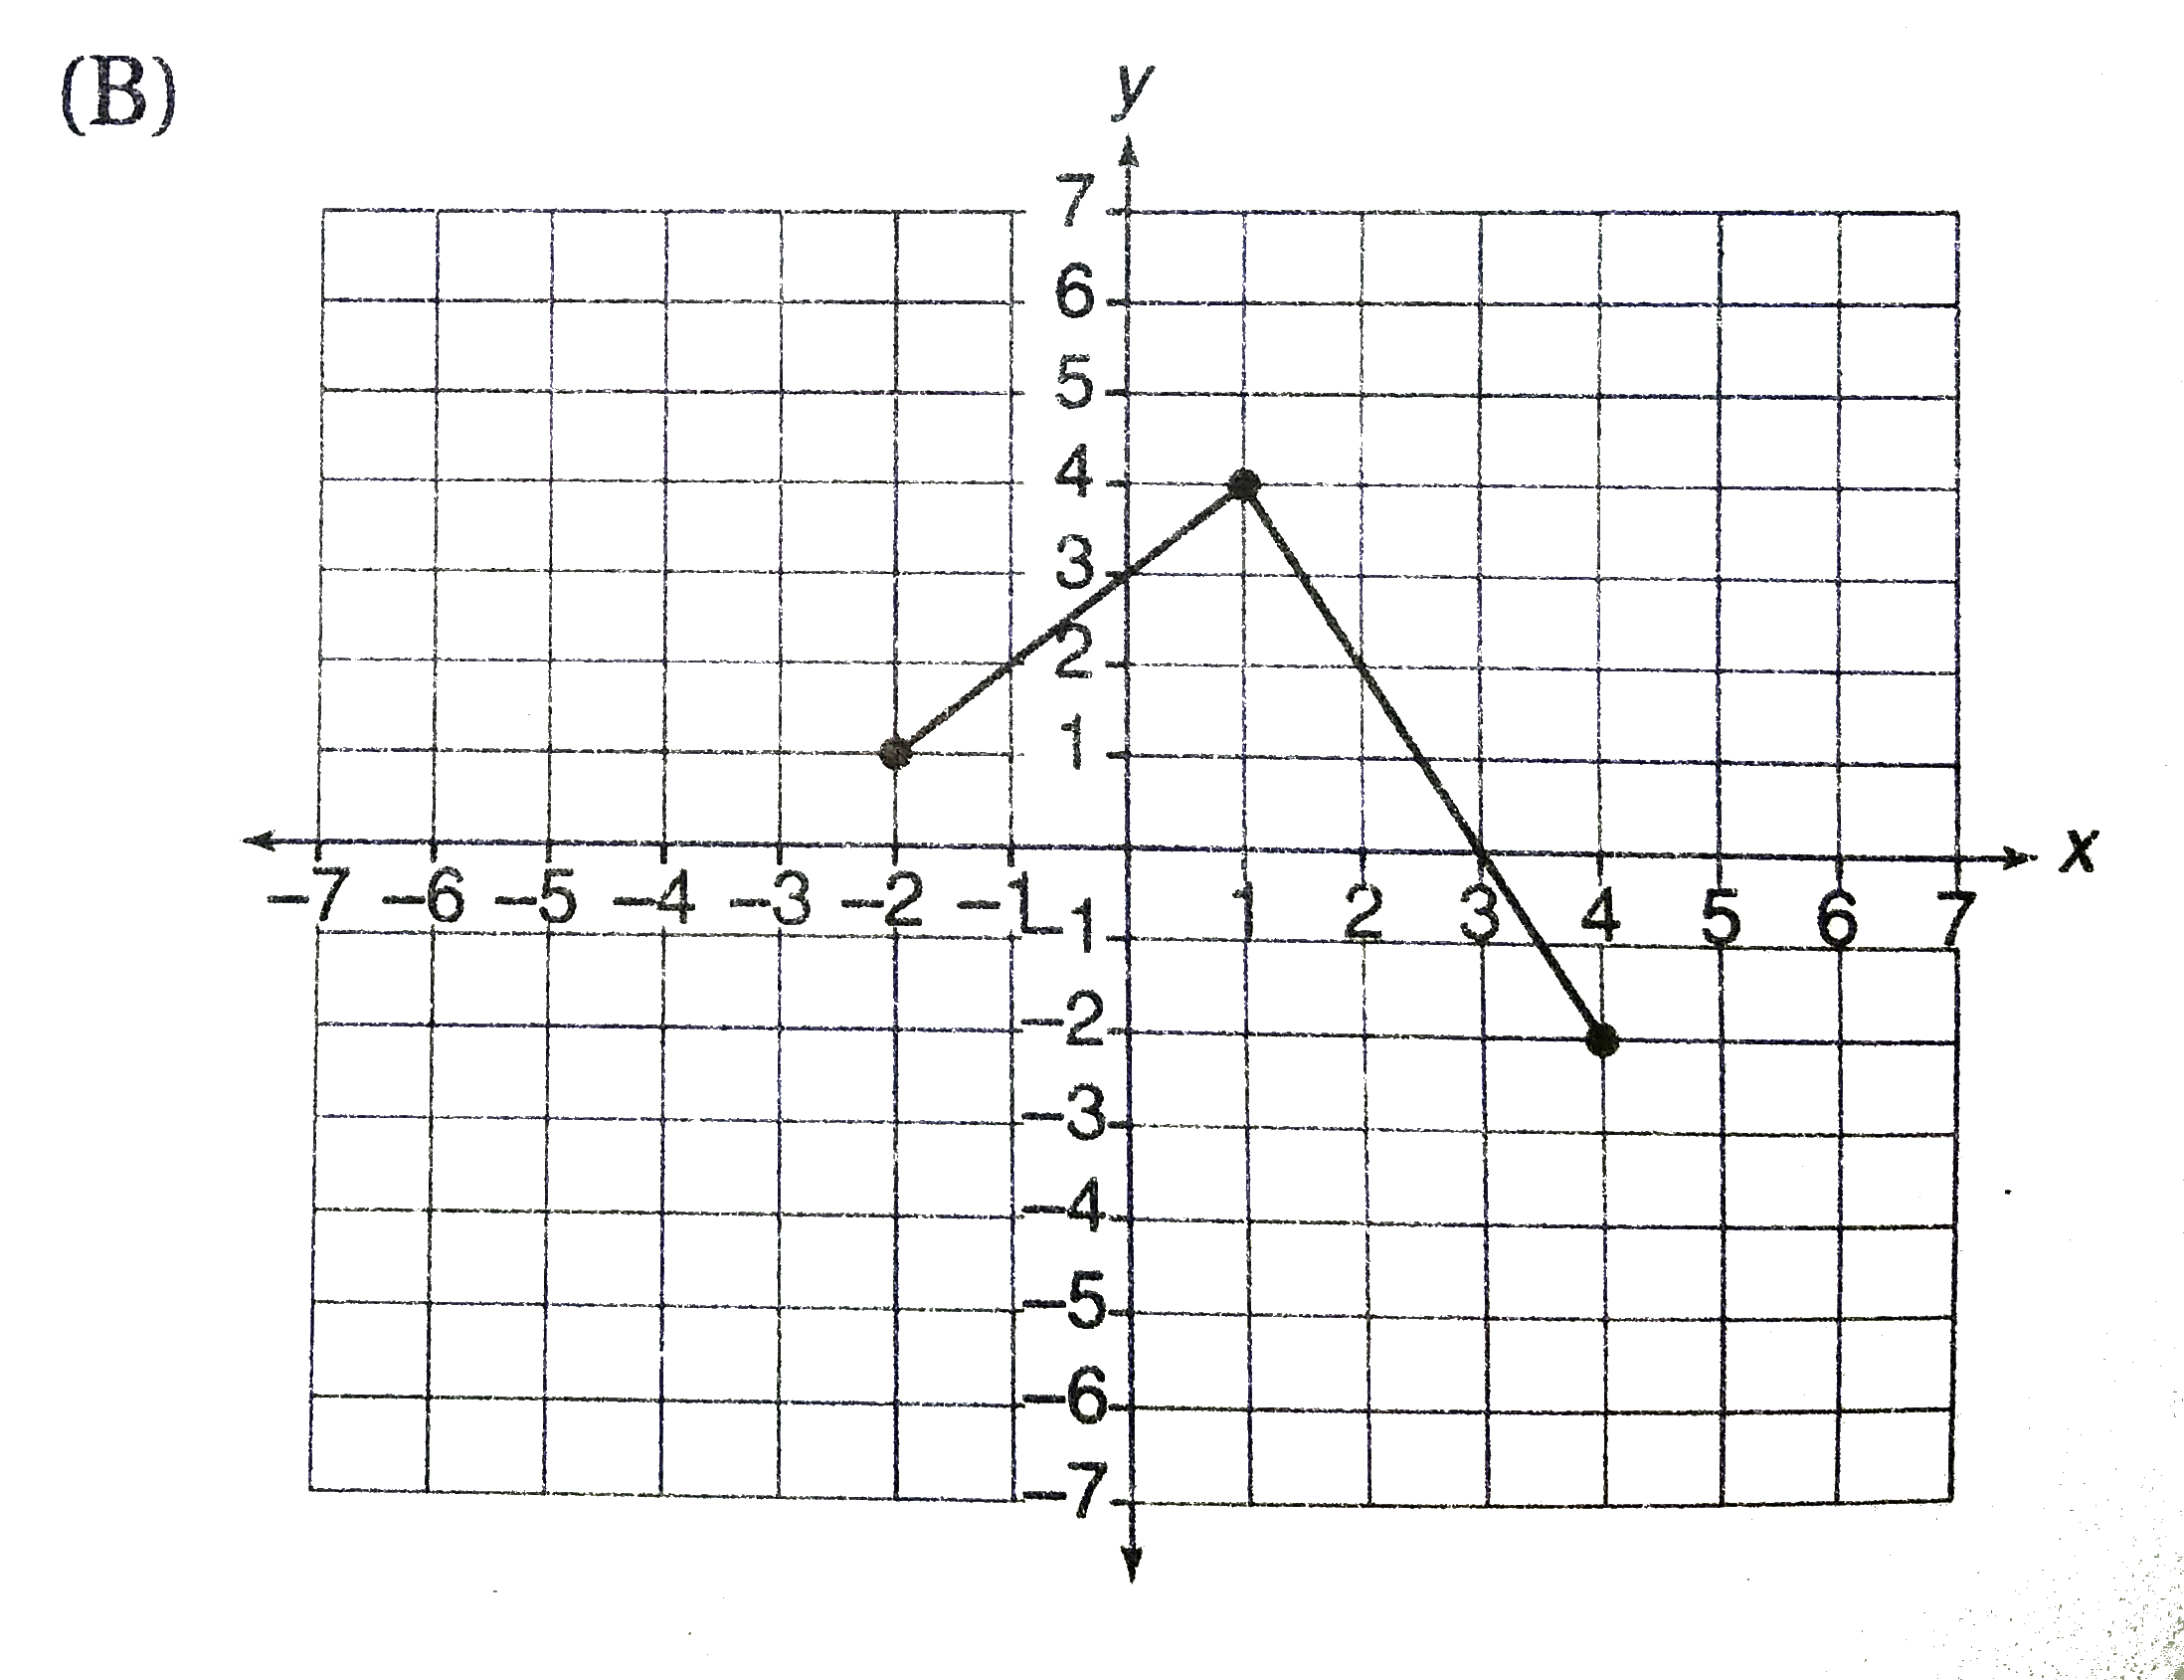 C
C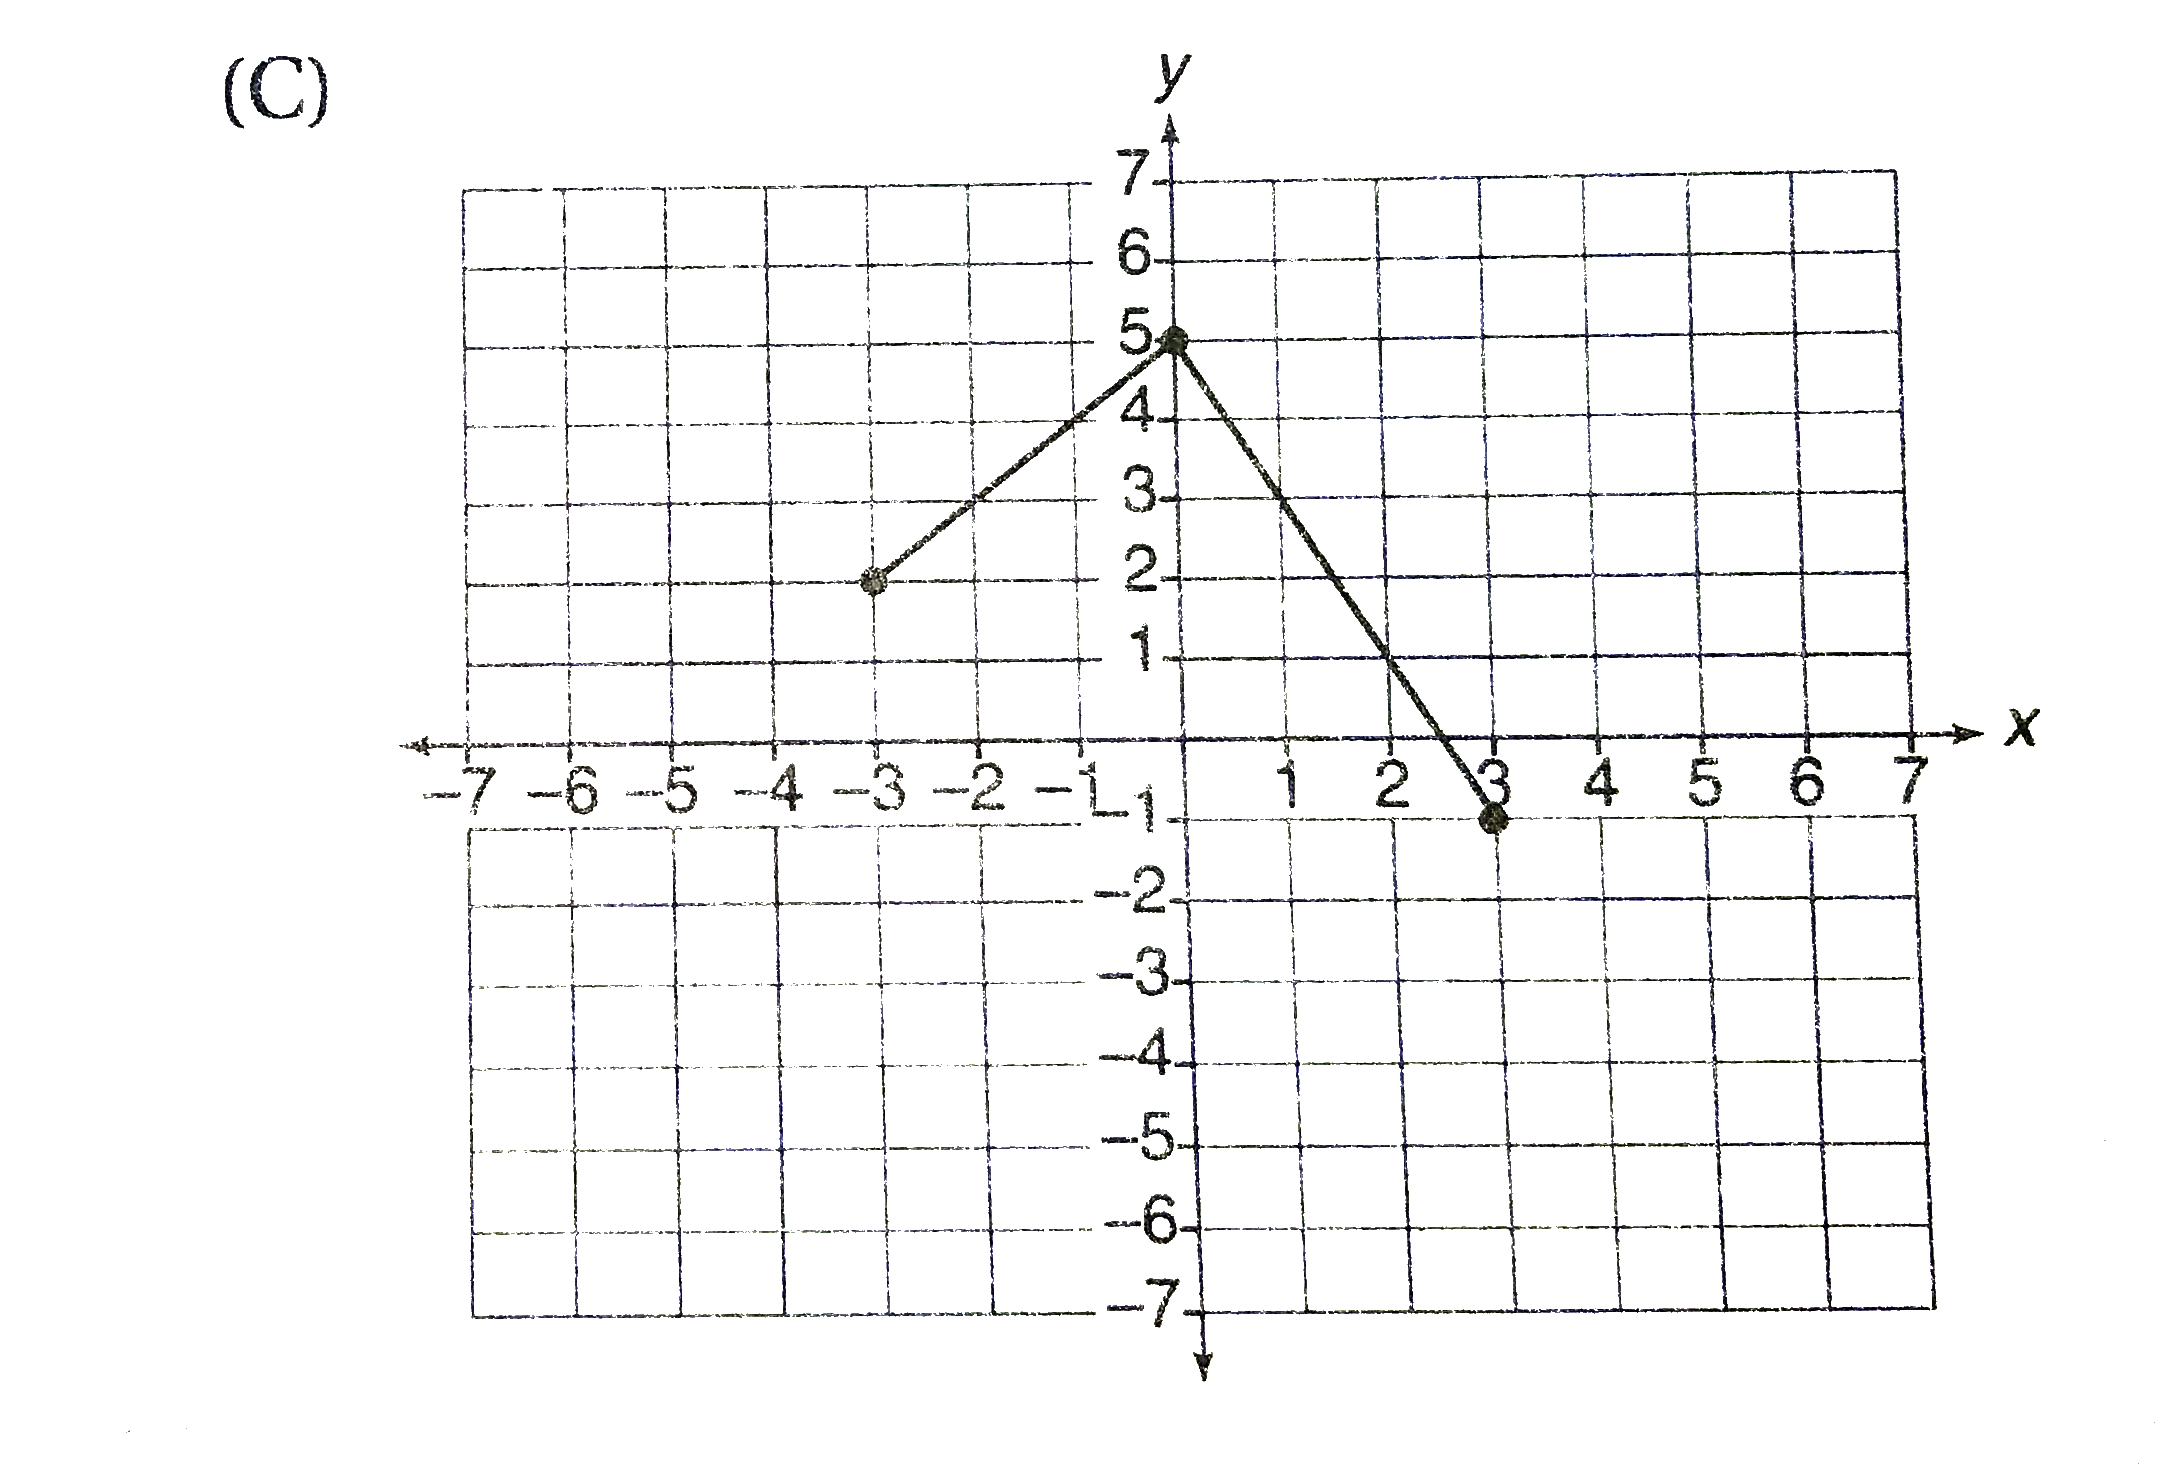 D
D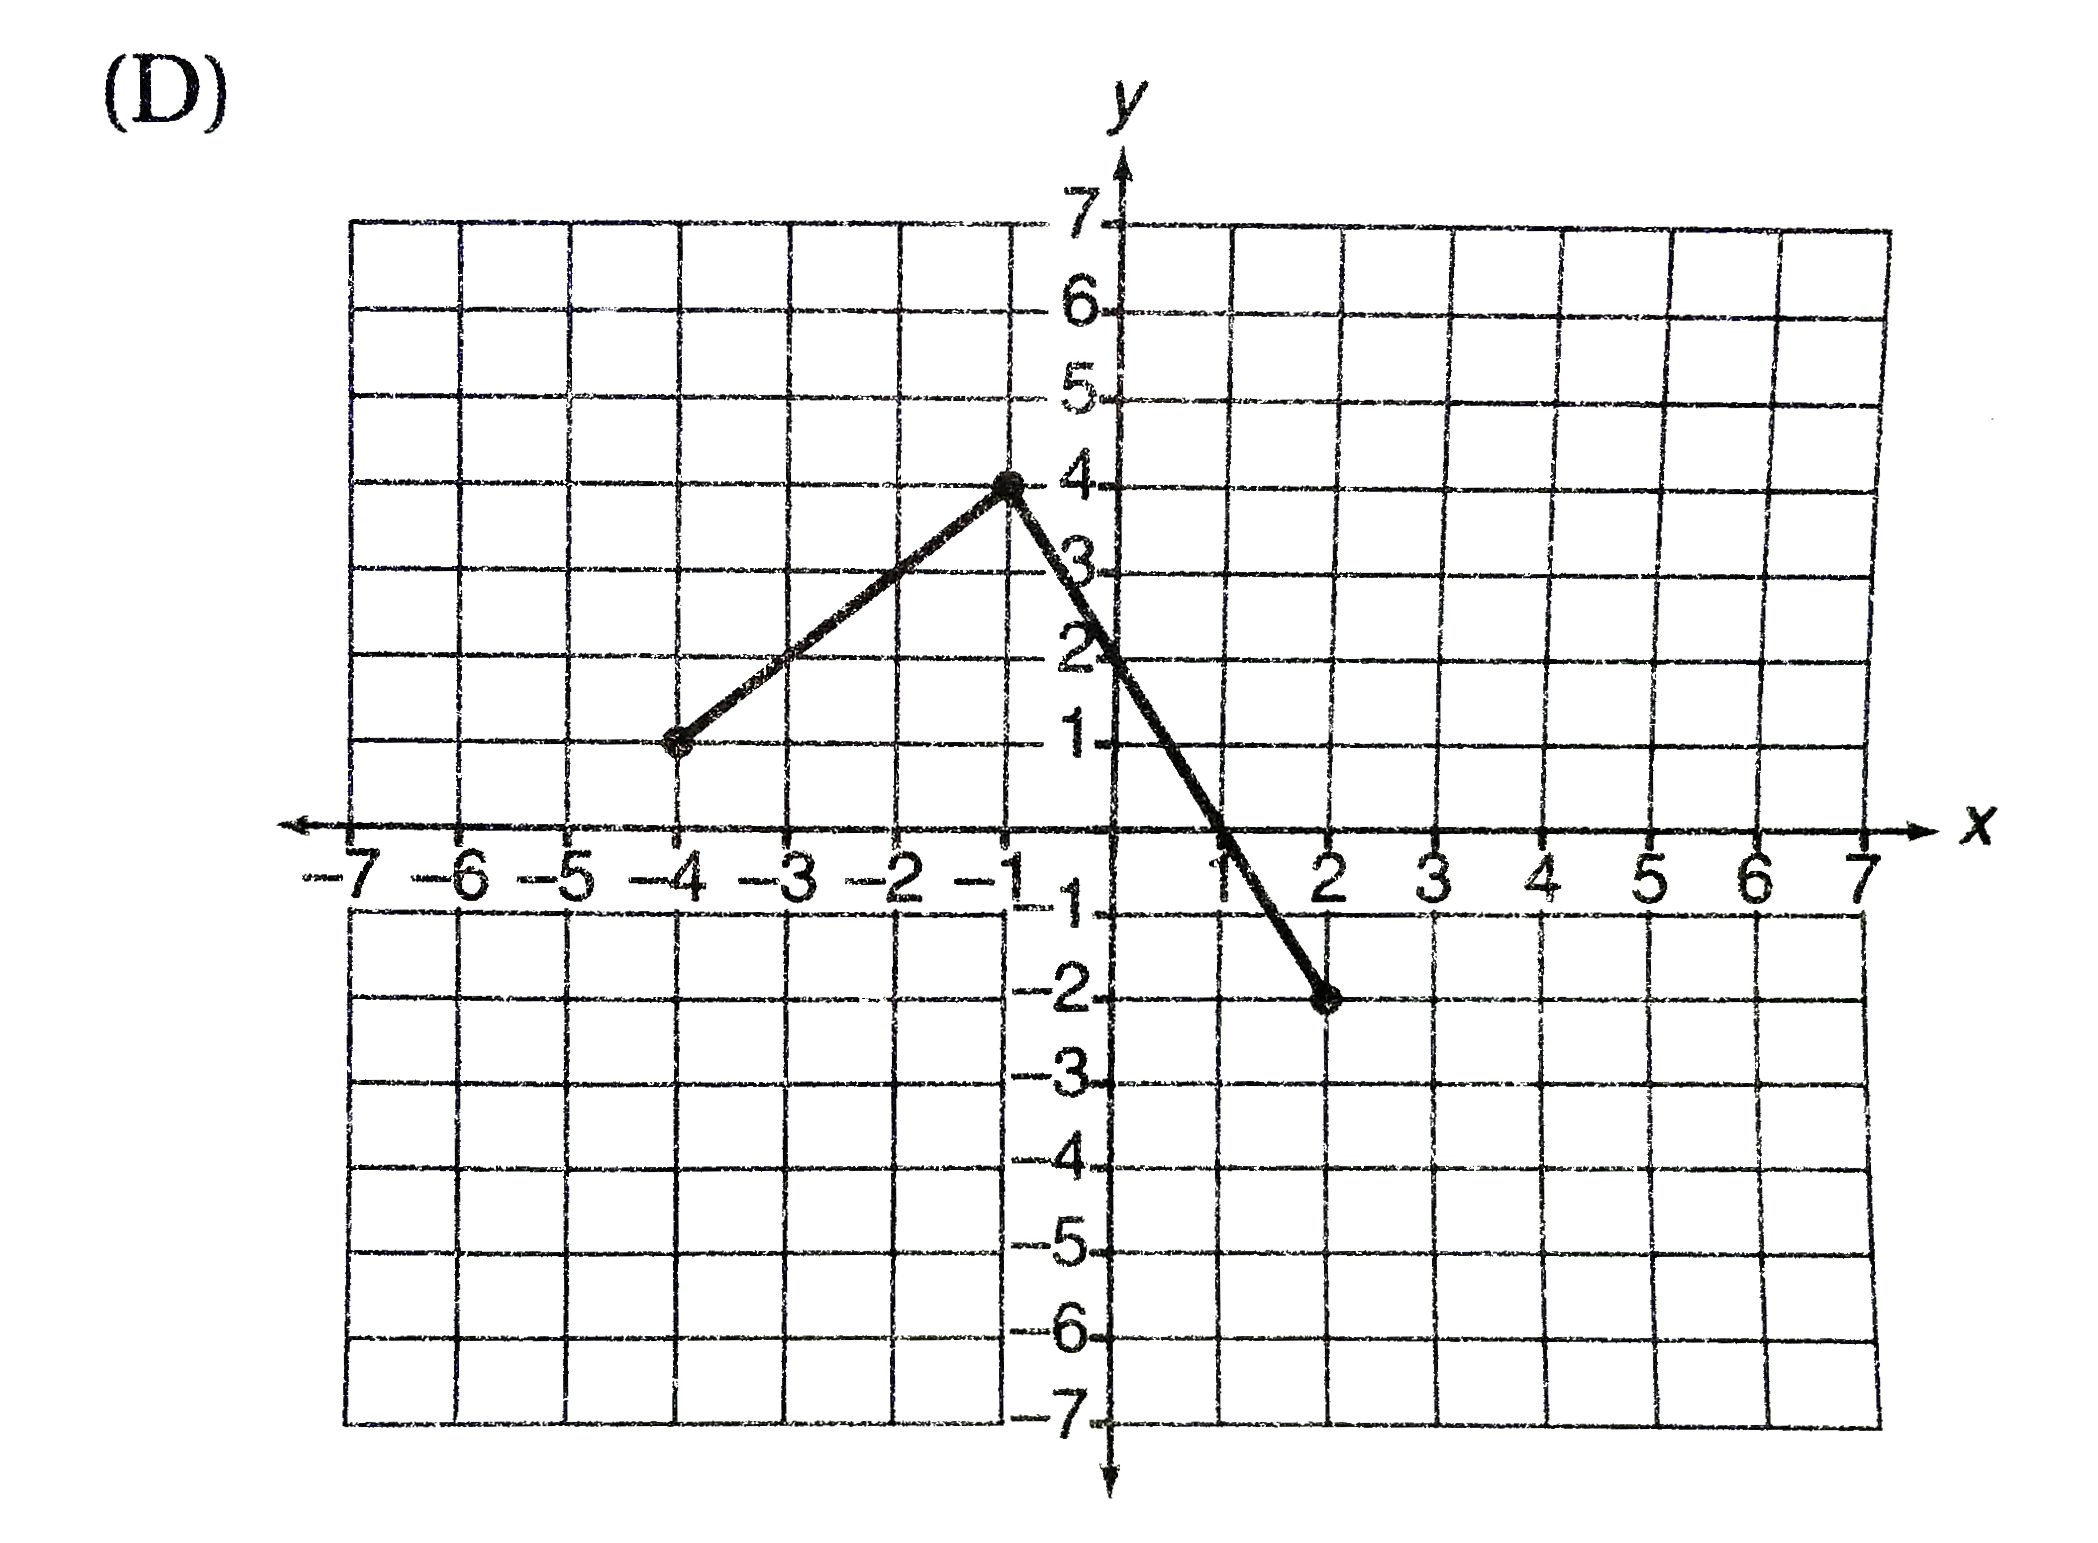
If (x,y) represents a point on the the graph of y=2x+1, which of the following could be a portion of the graph of the set of points (x,y2)?
A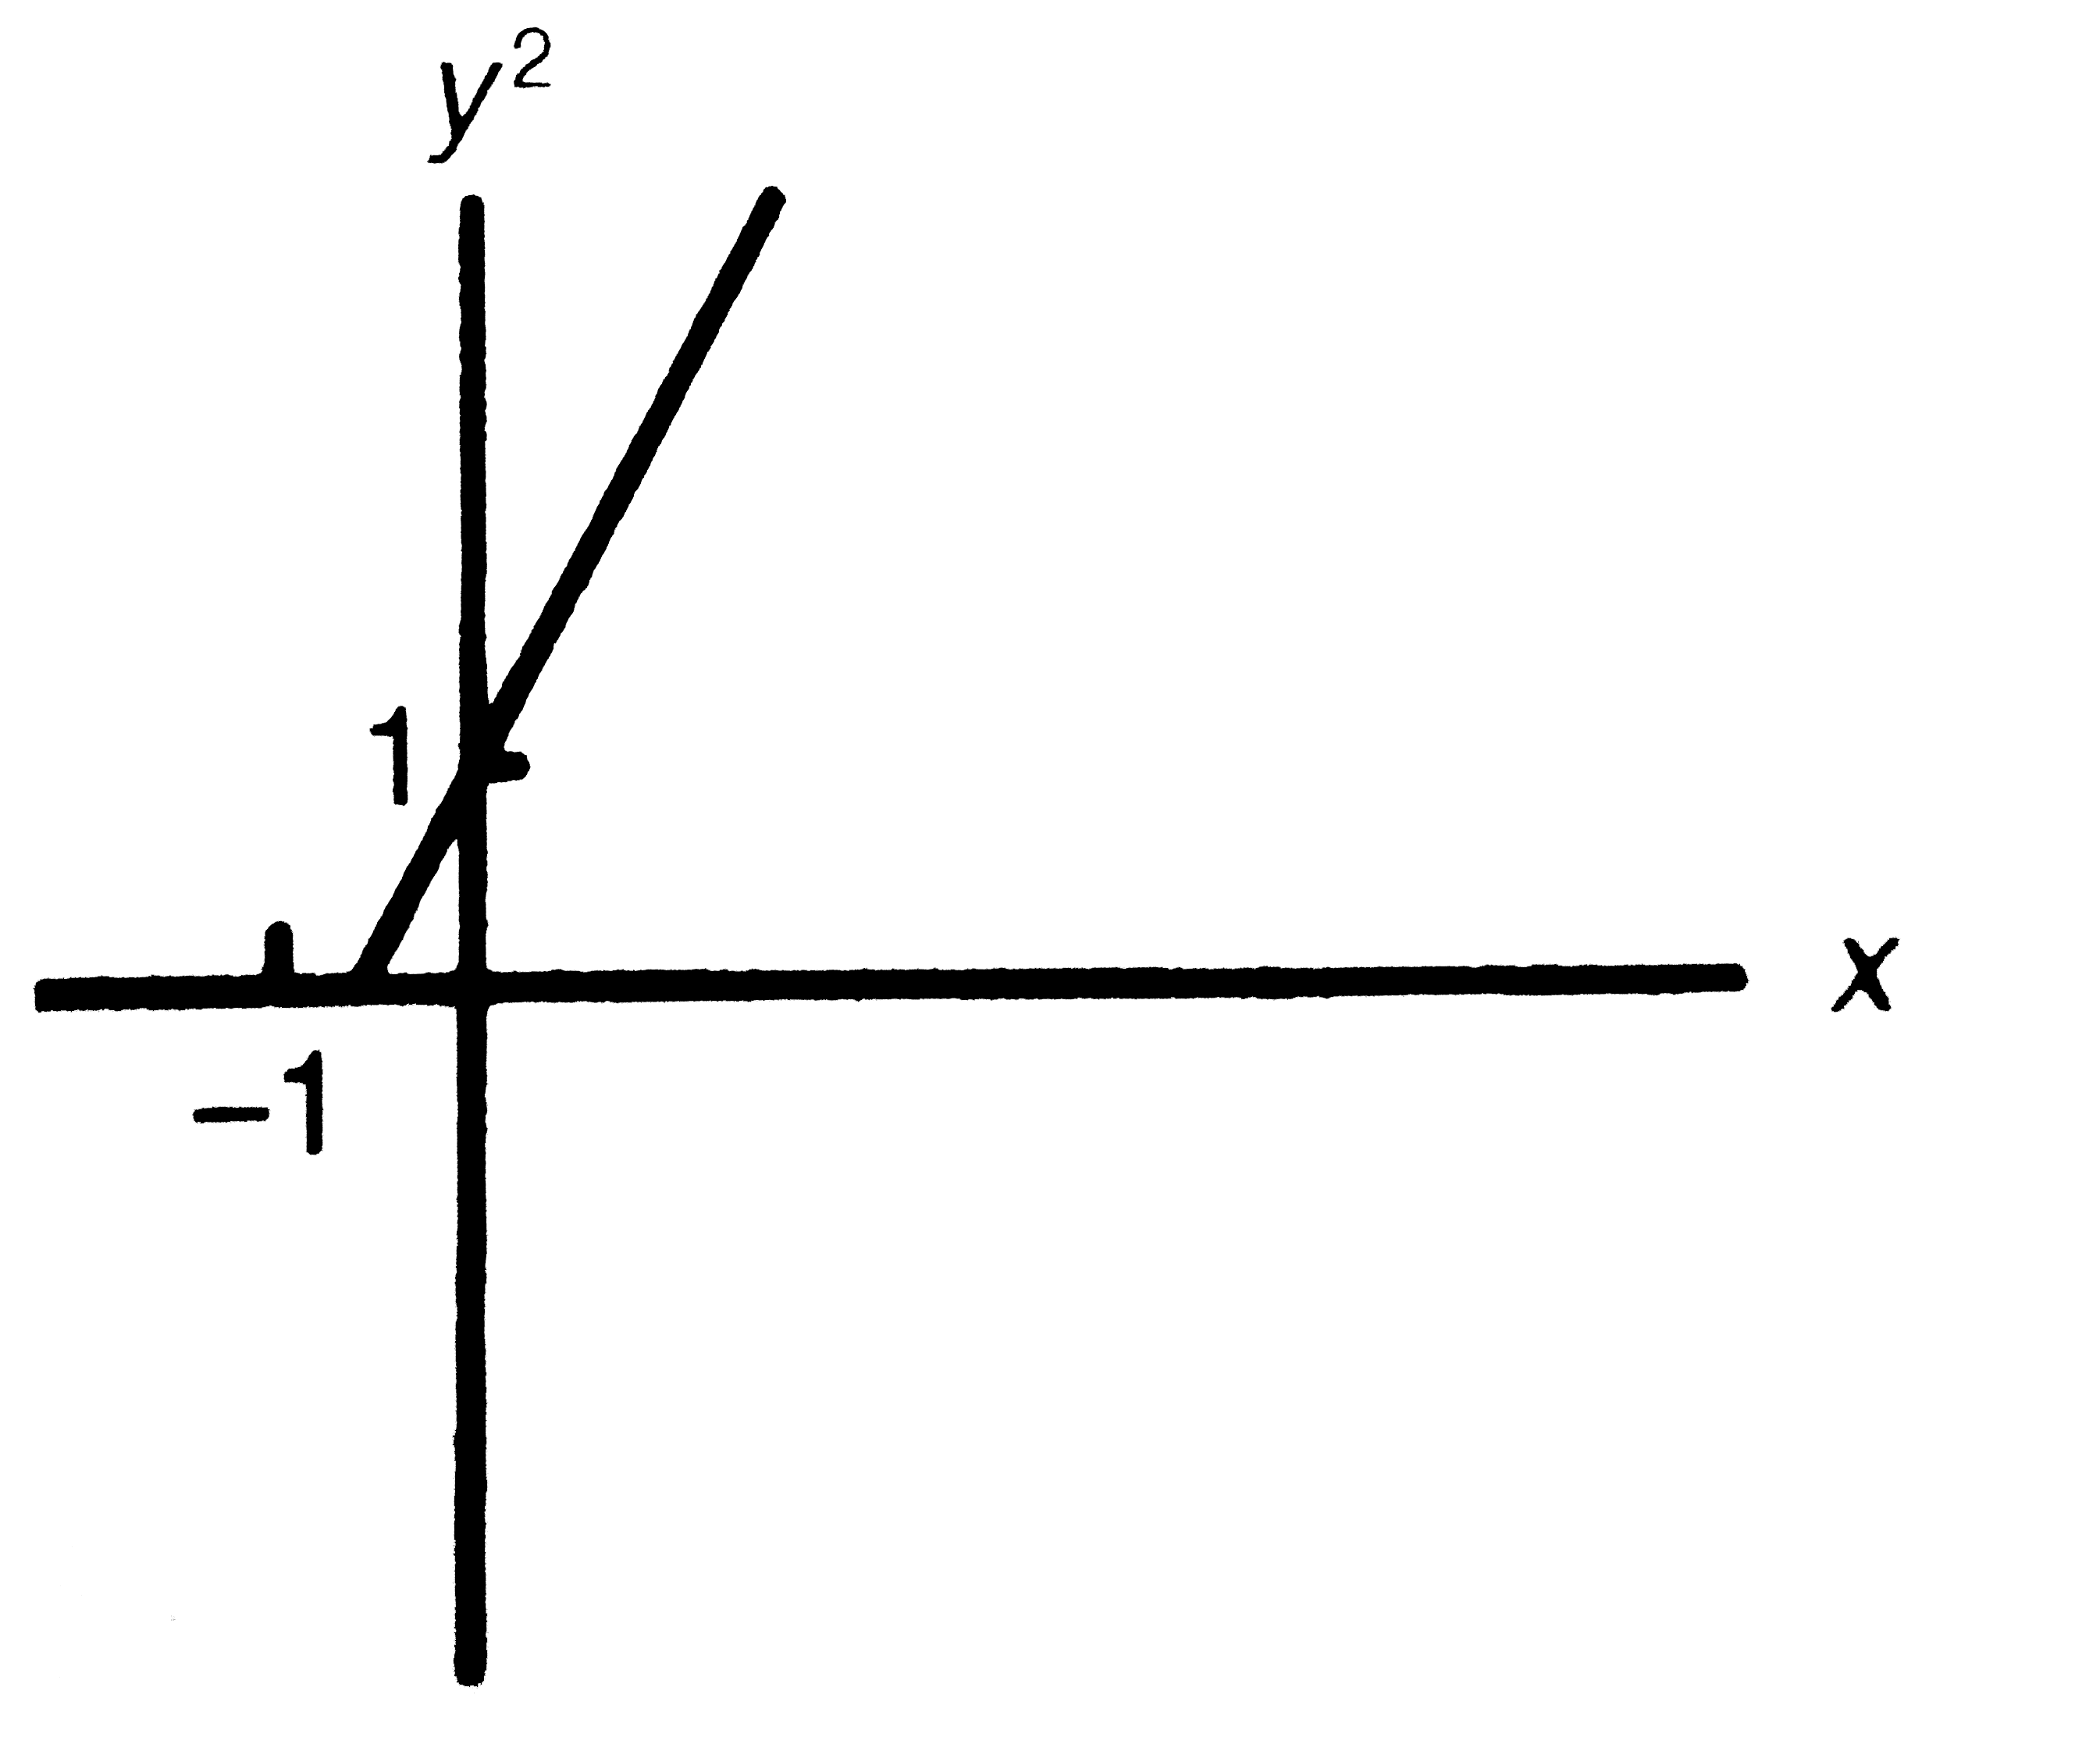 B
B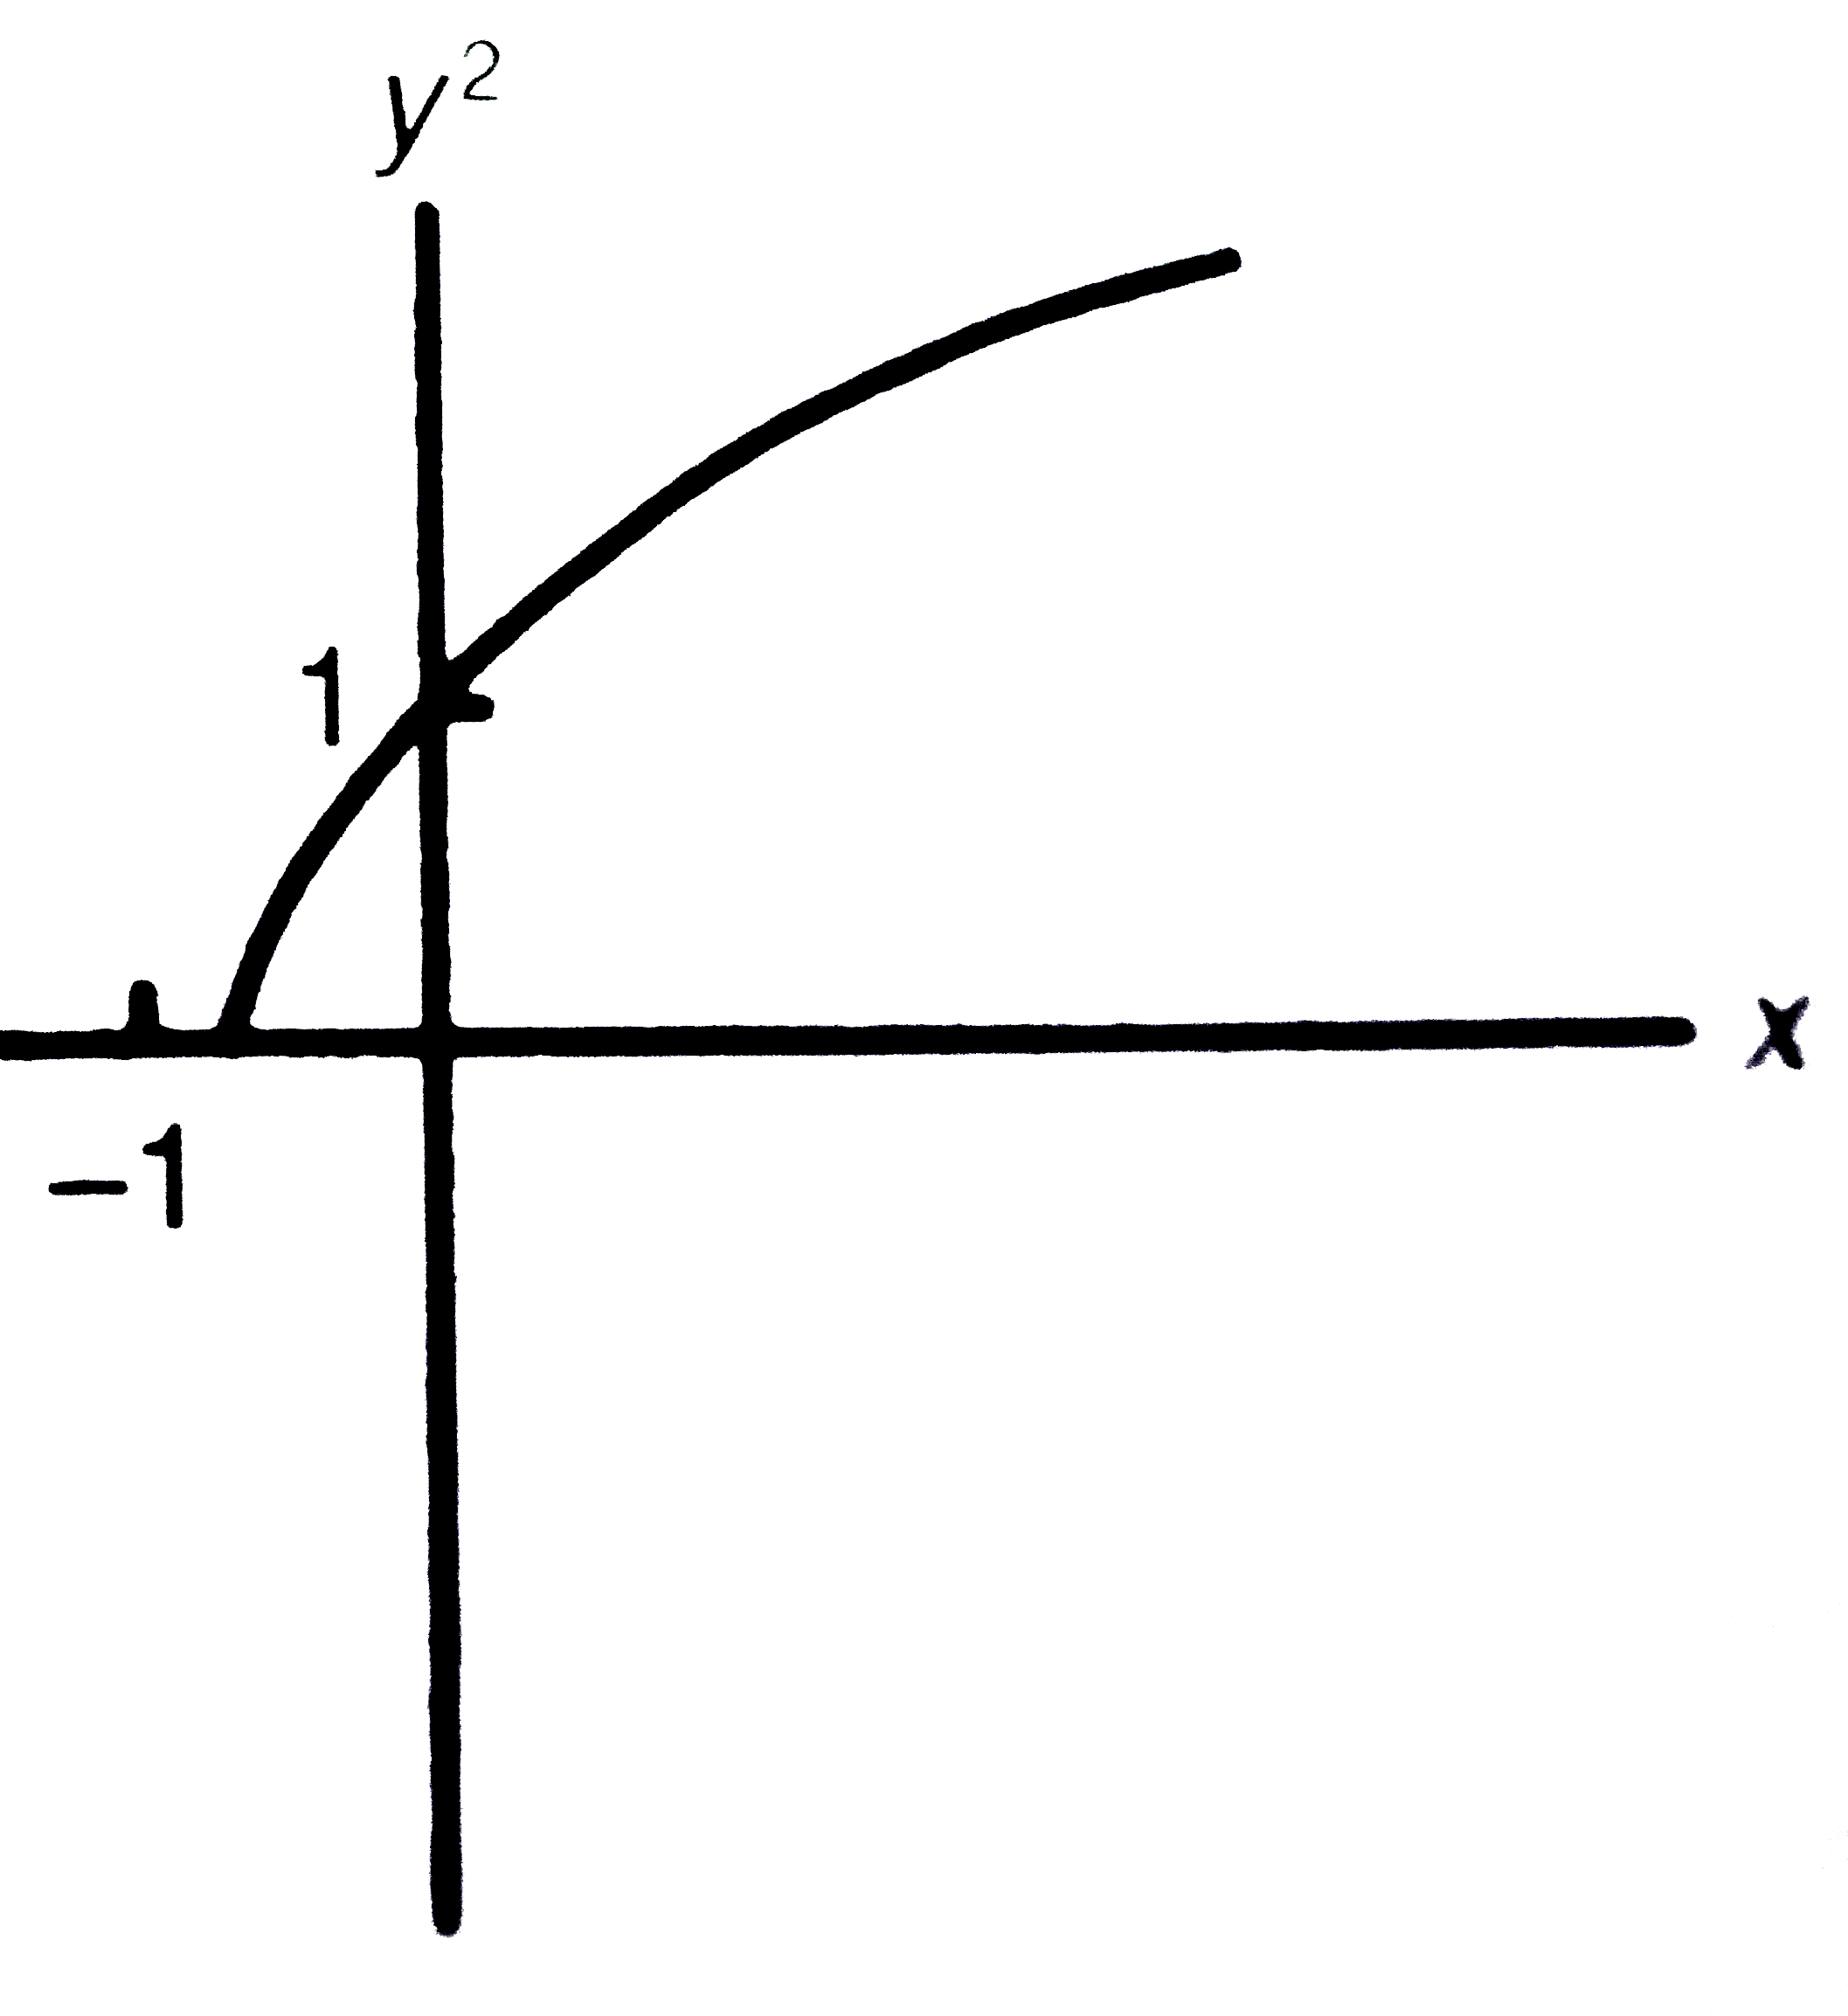 C
C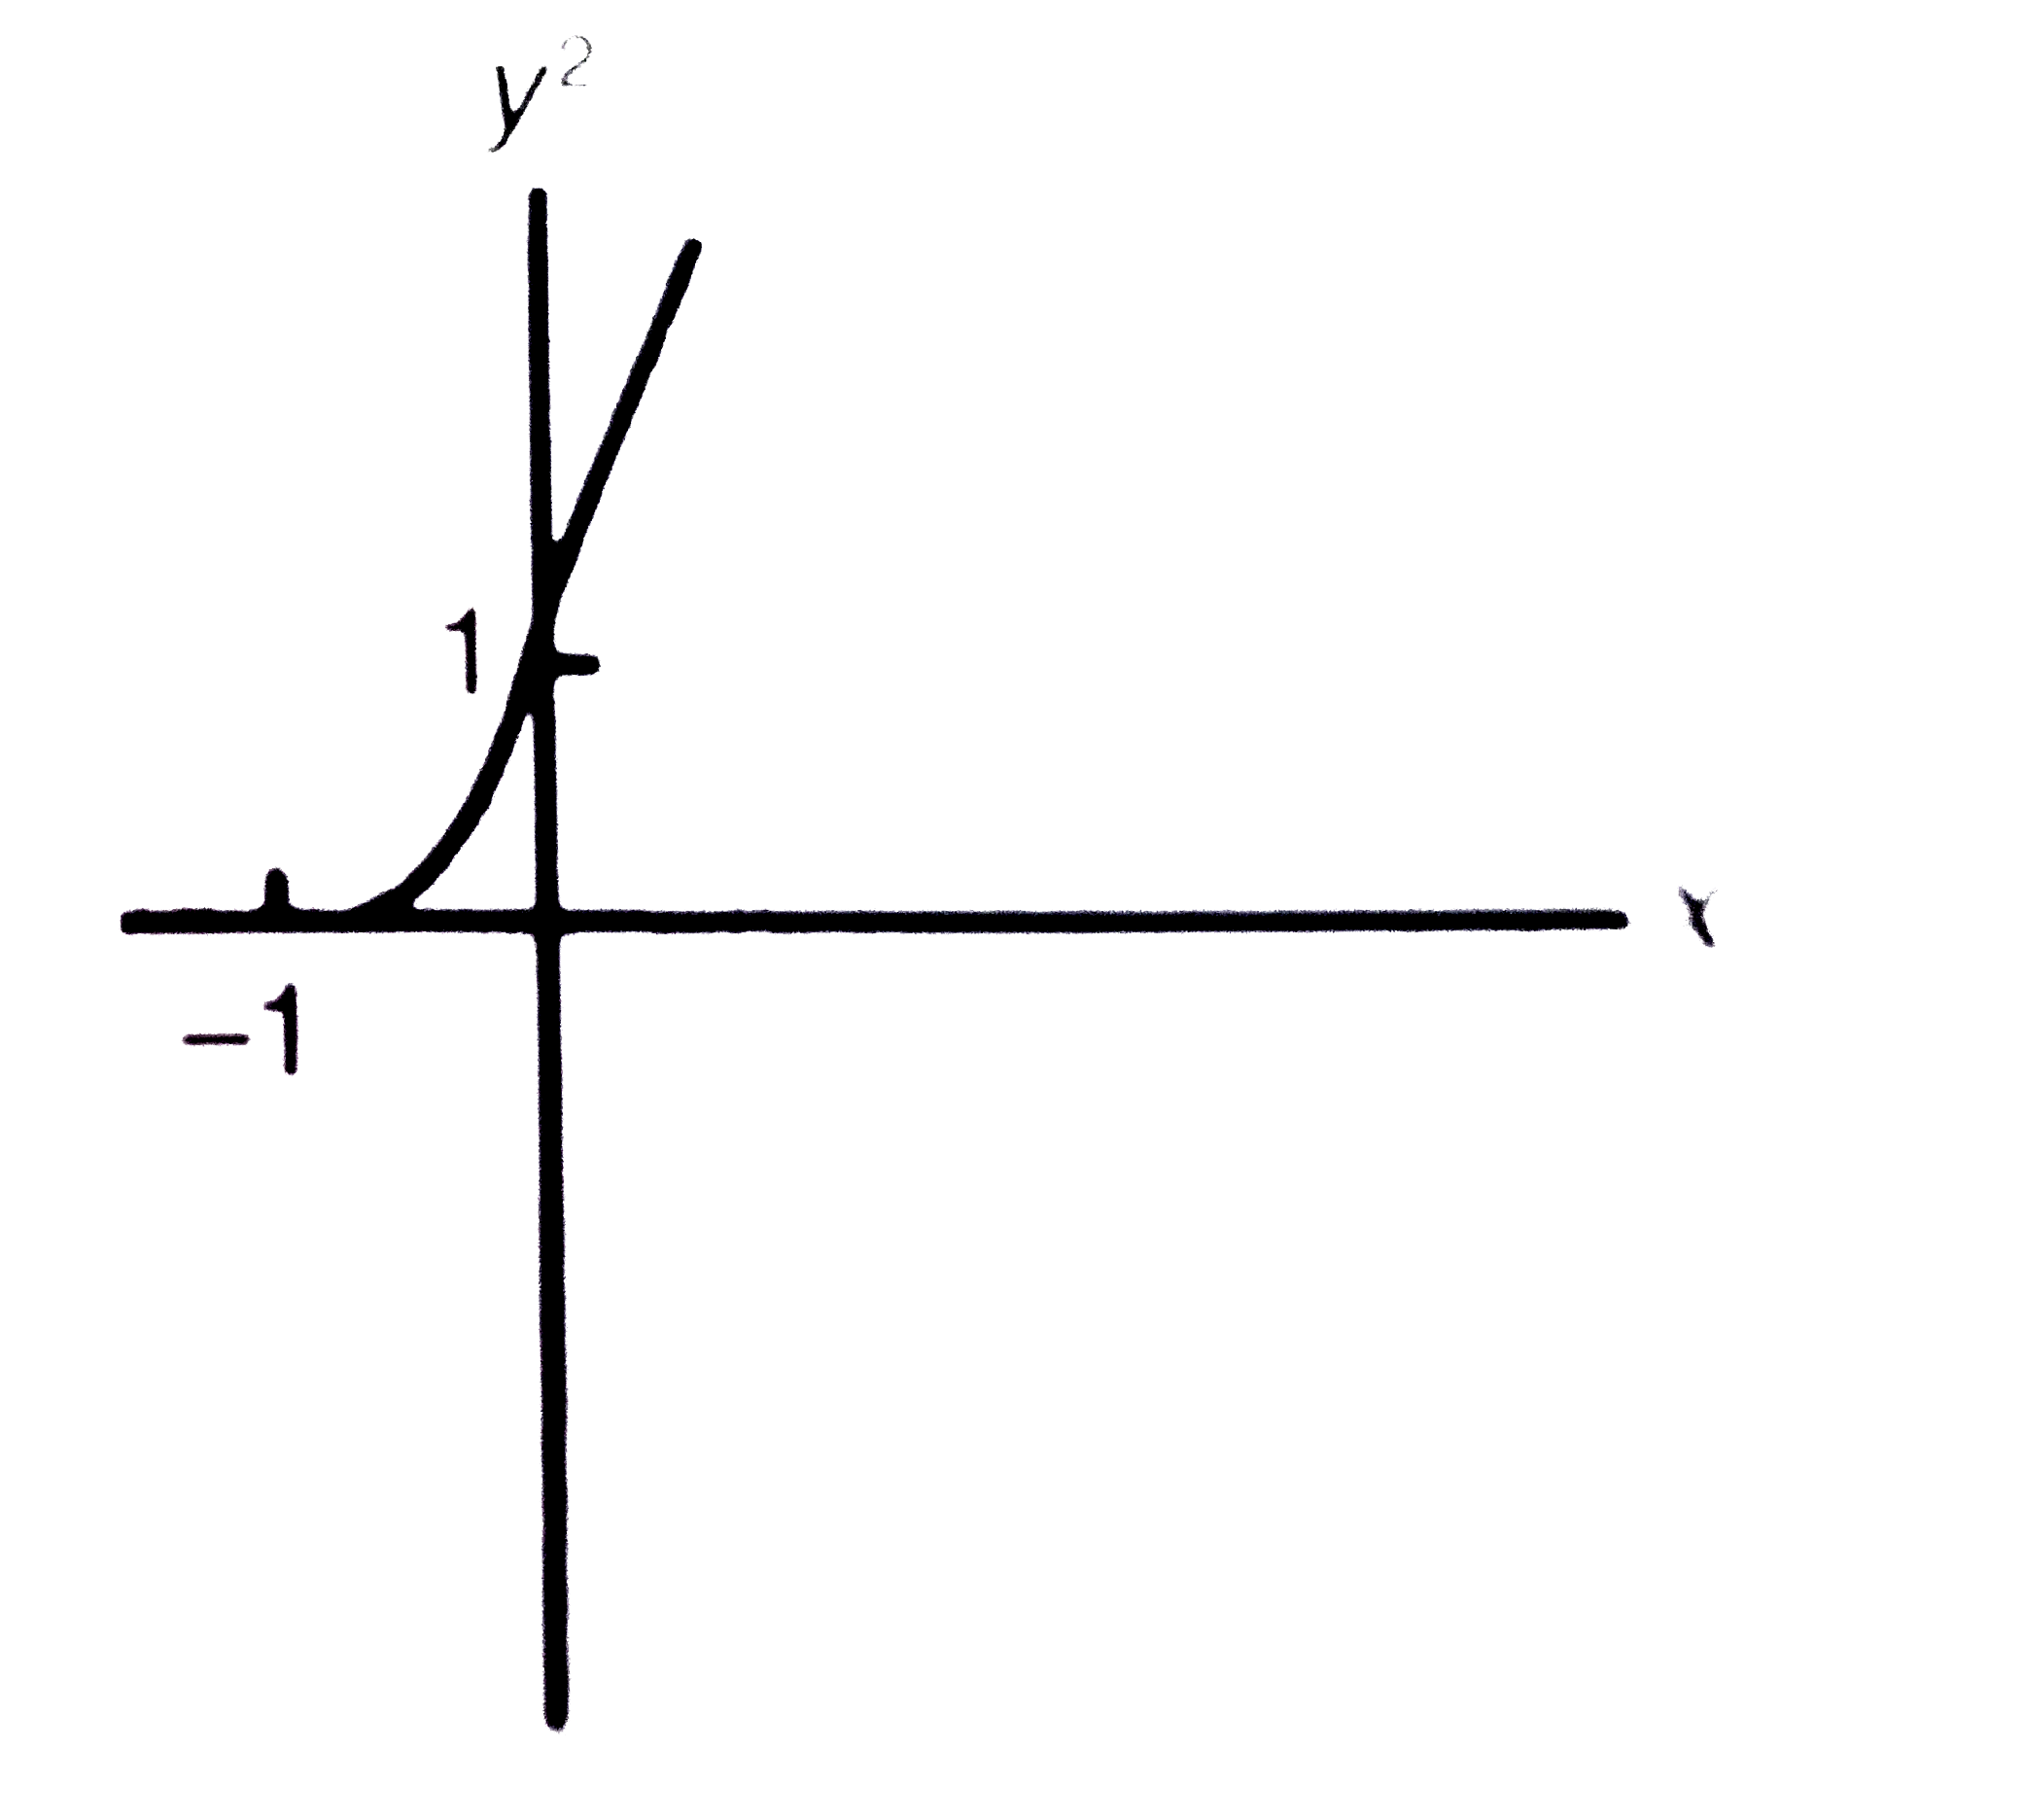 D
D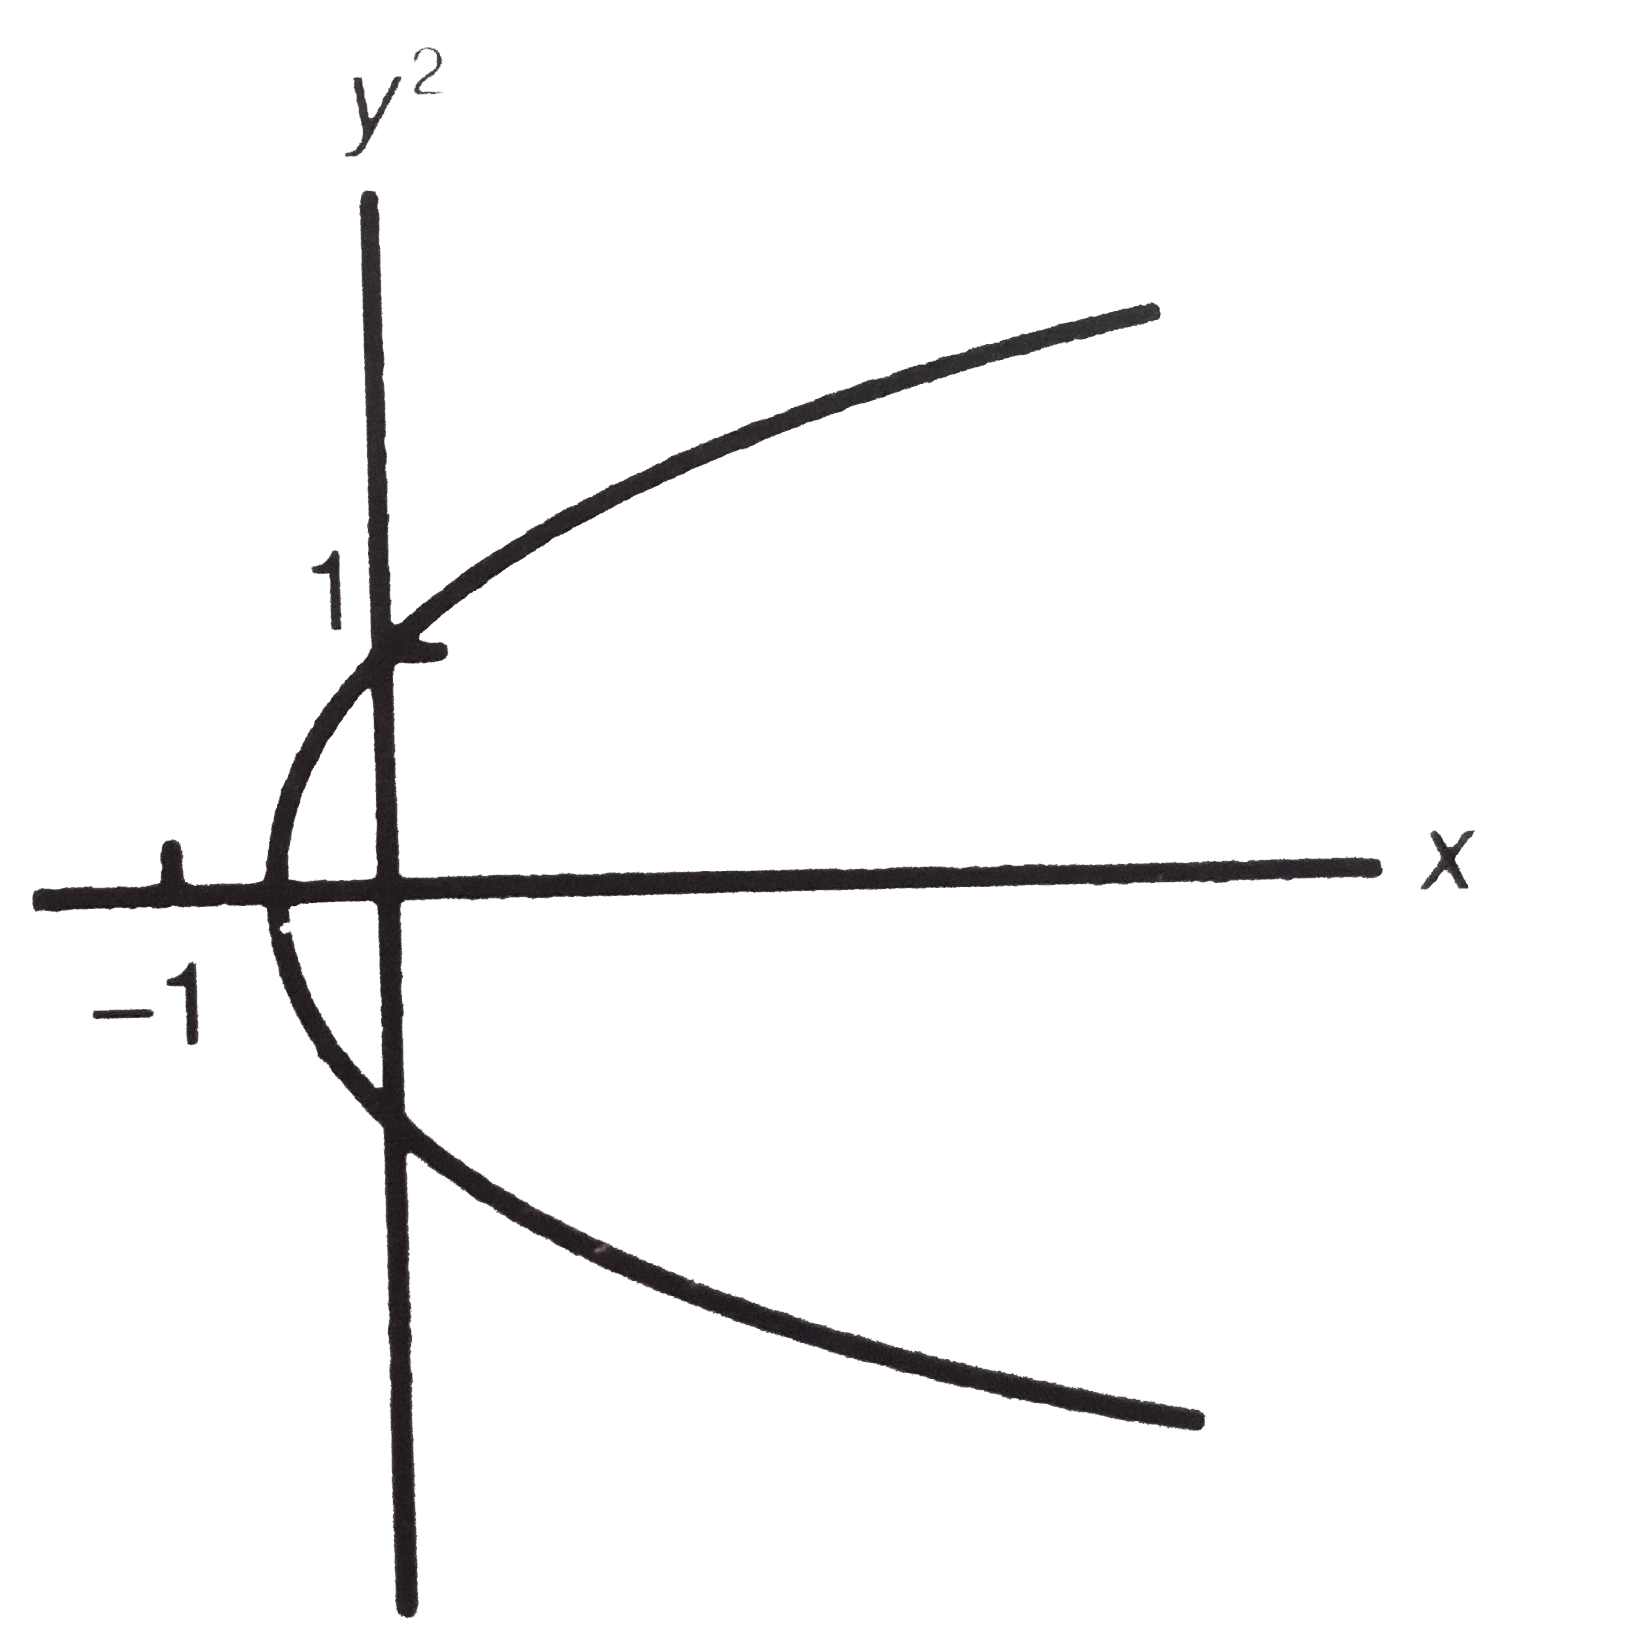
Which of the following shaded regions shows the graph of the inequality y≤|x−2| ?
A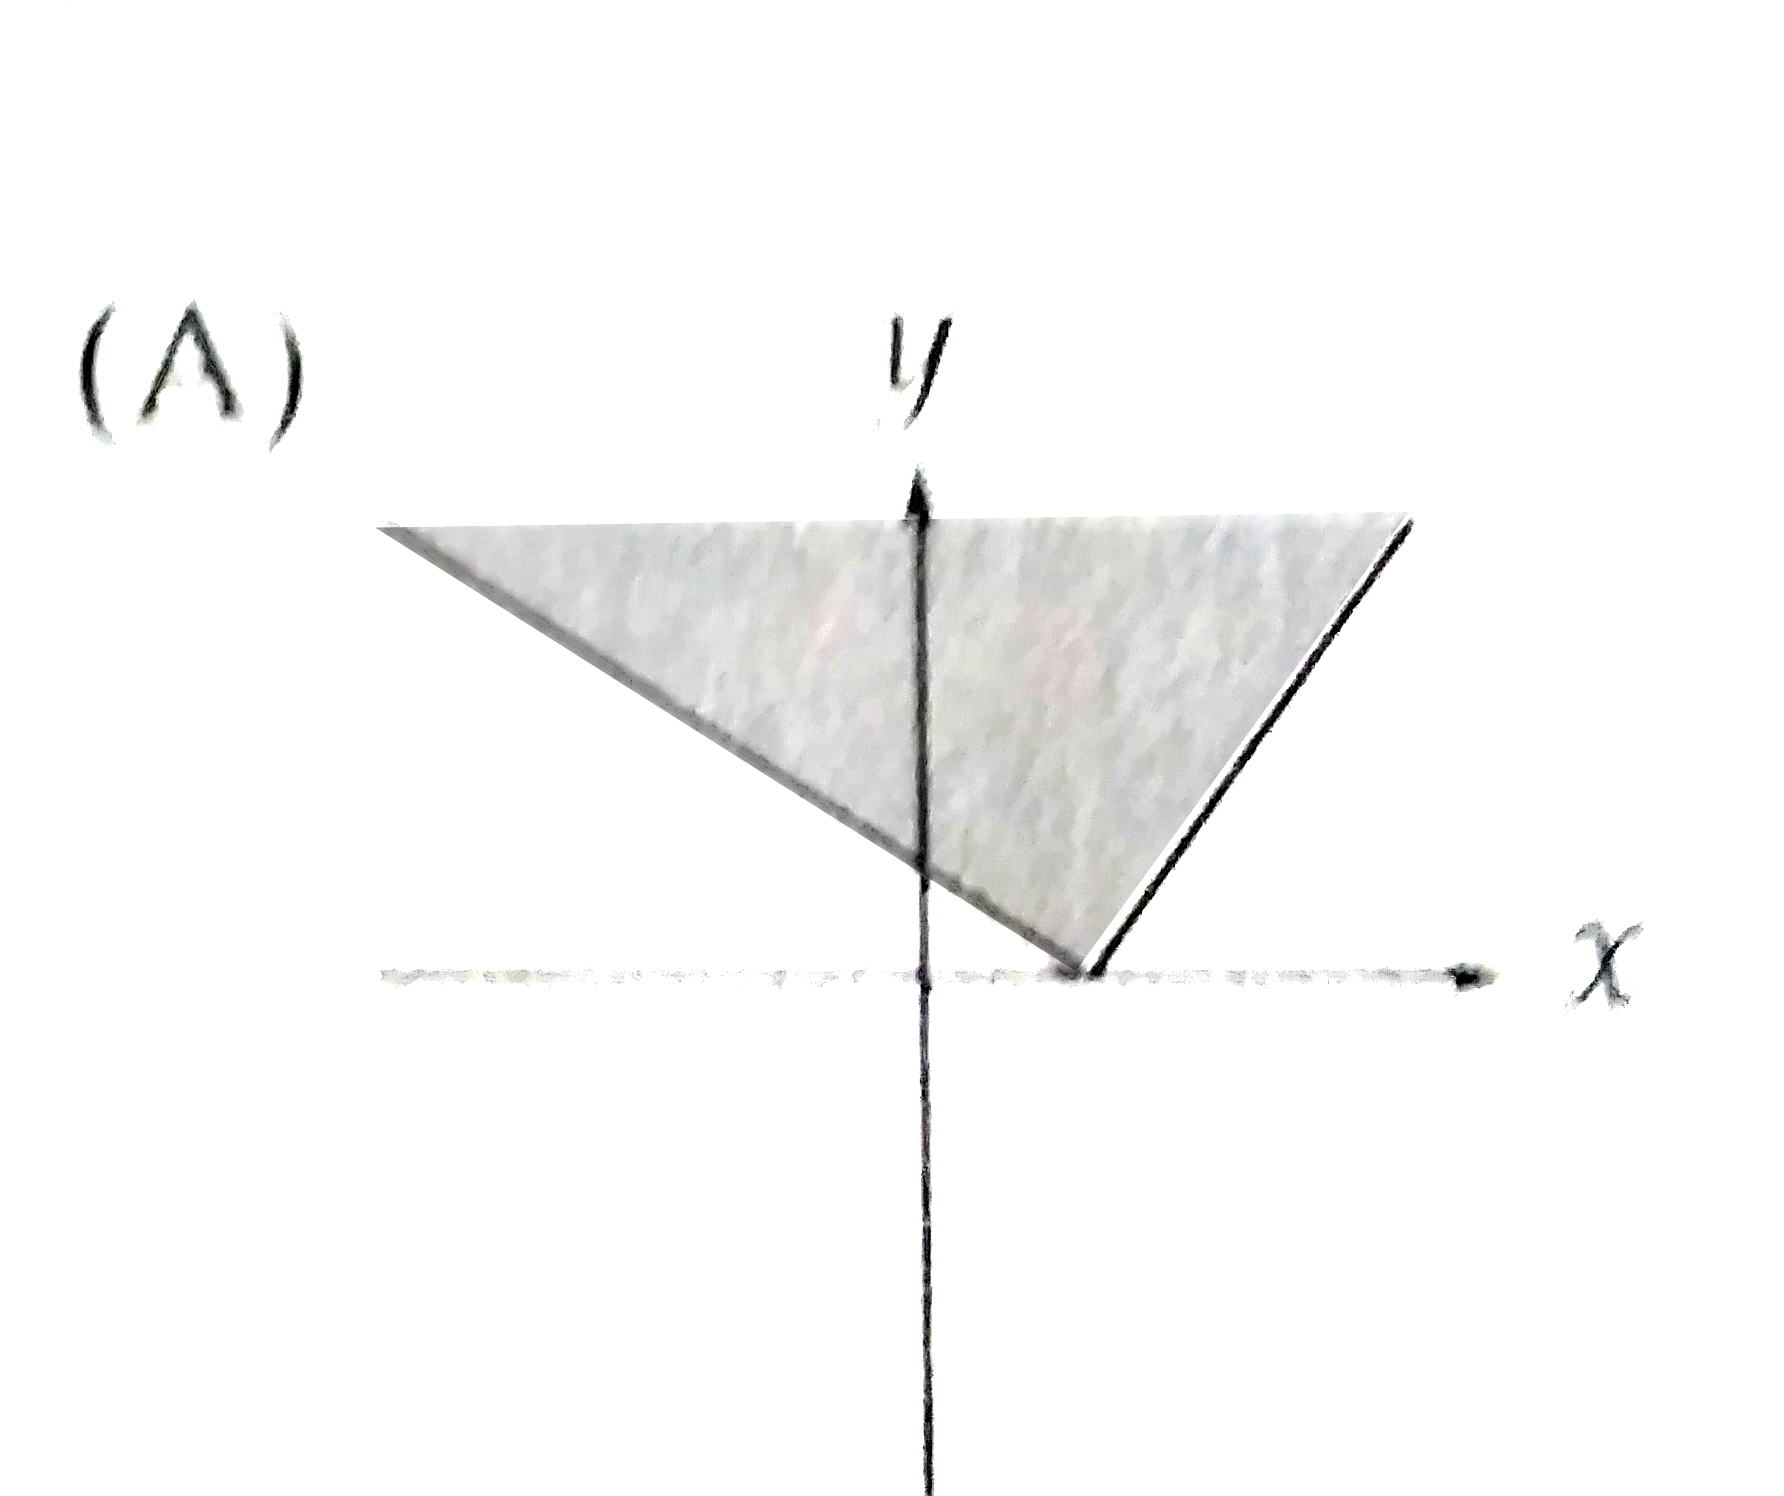 B
B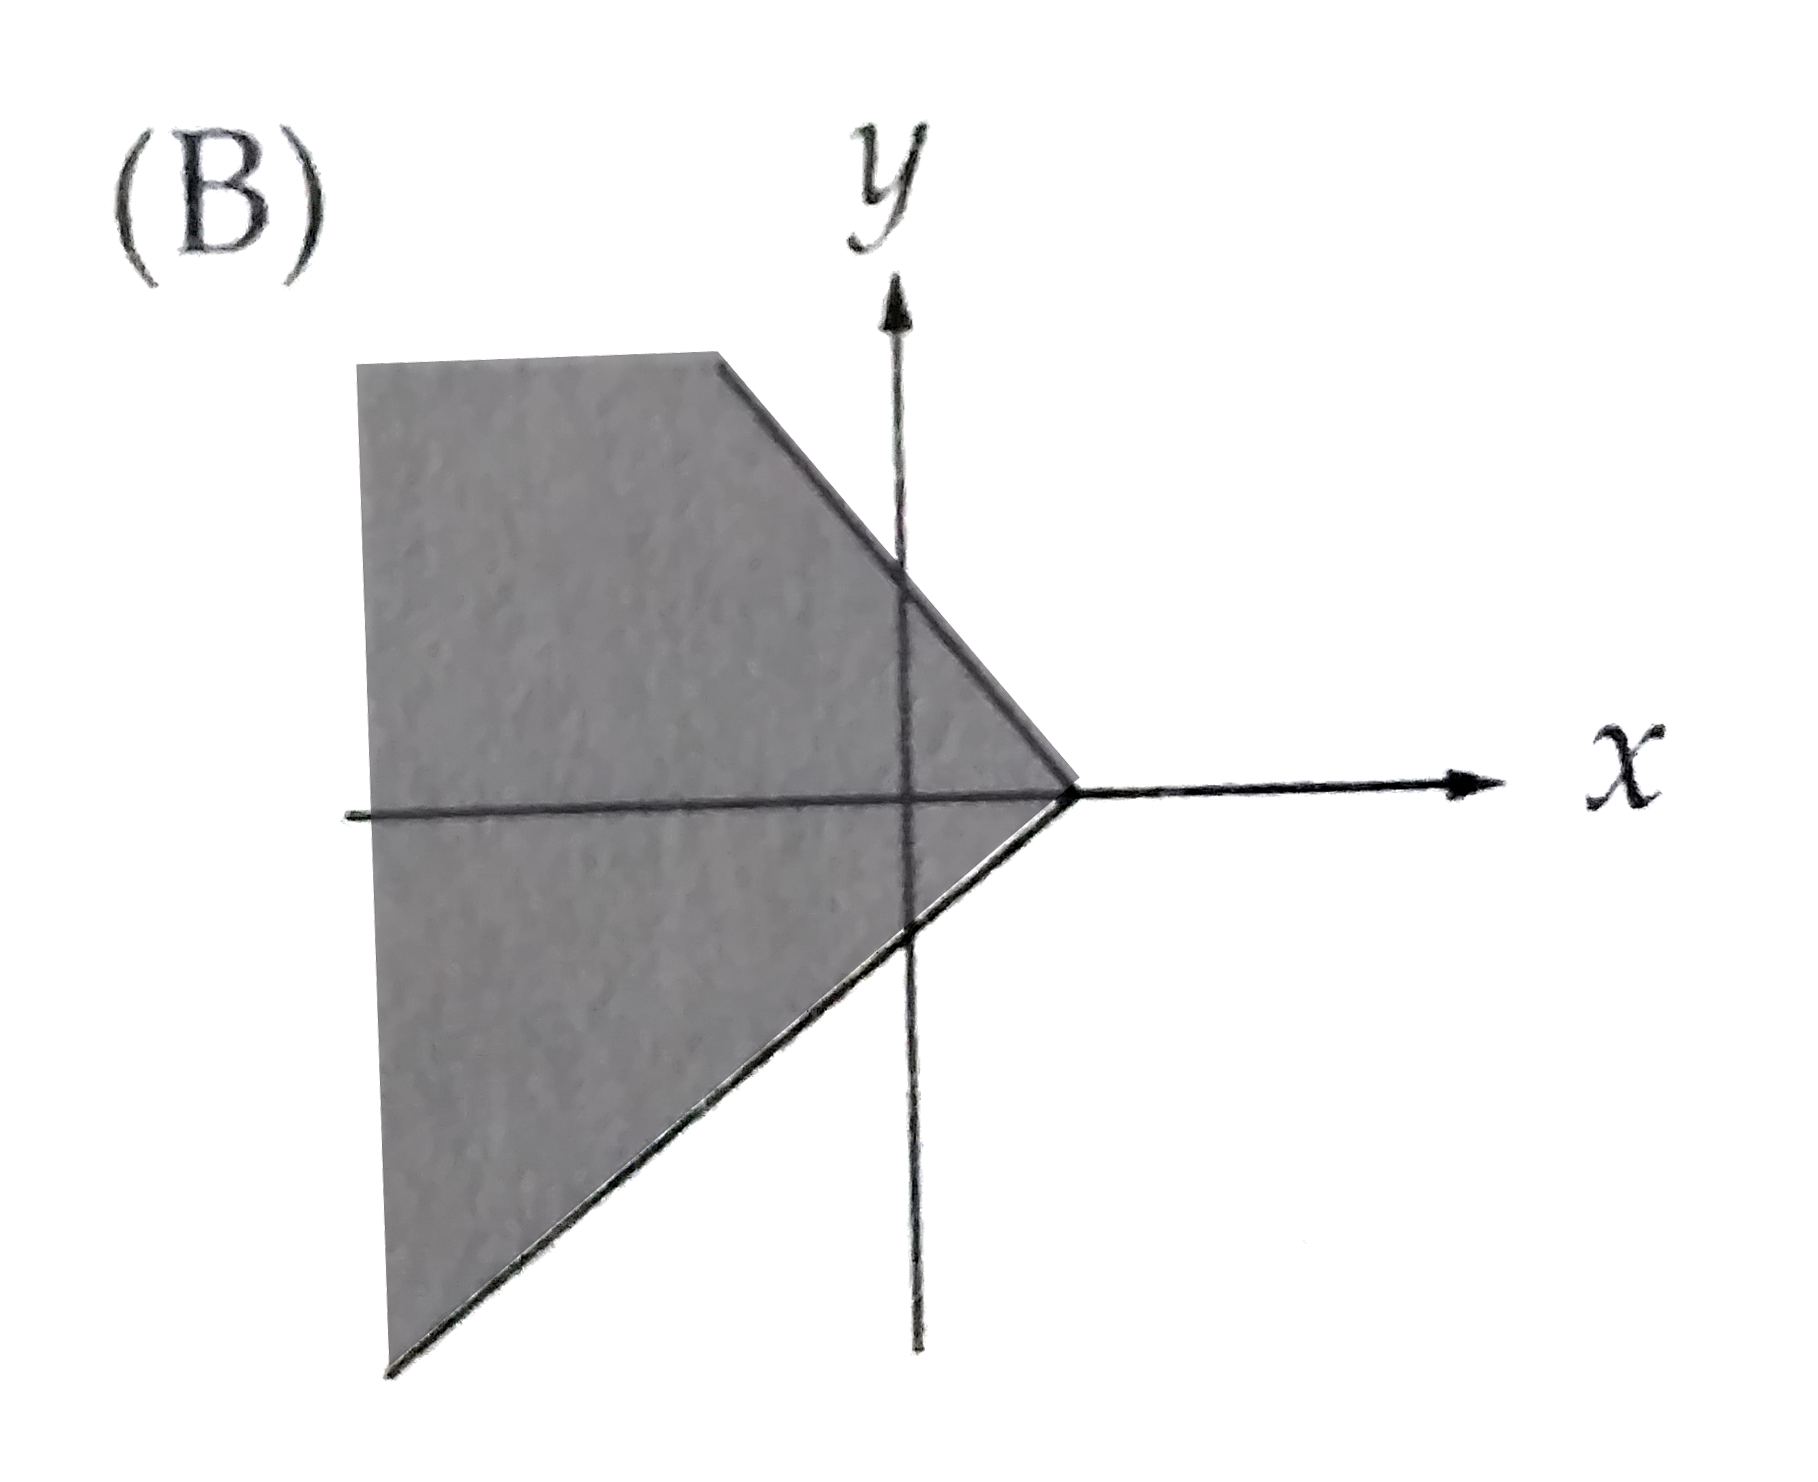 C
C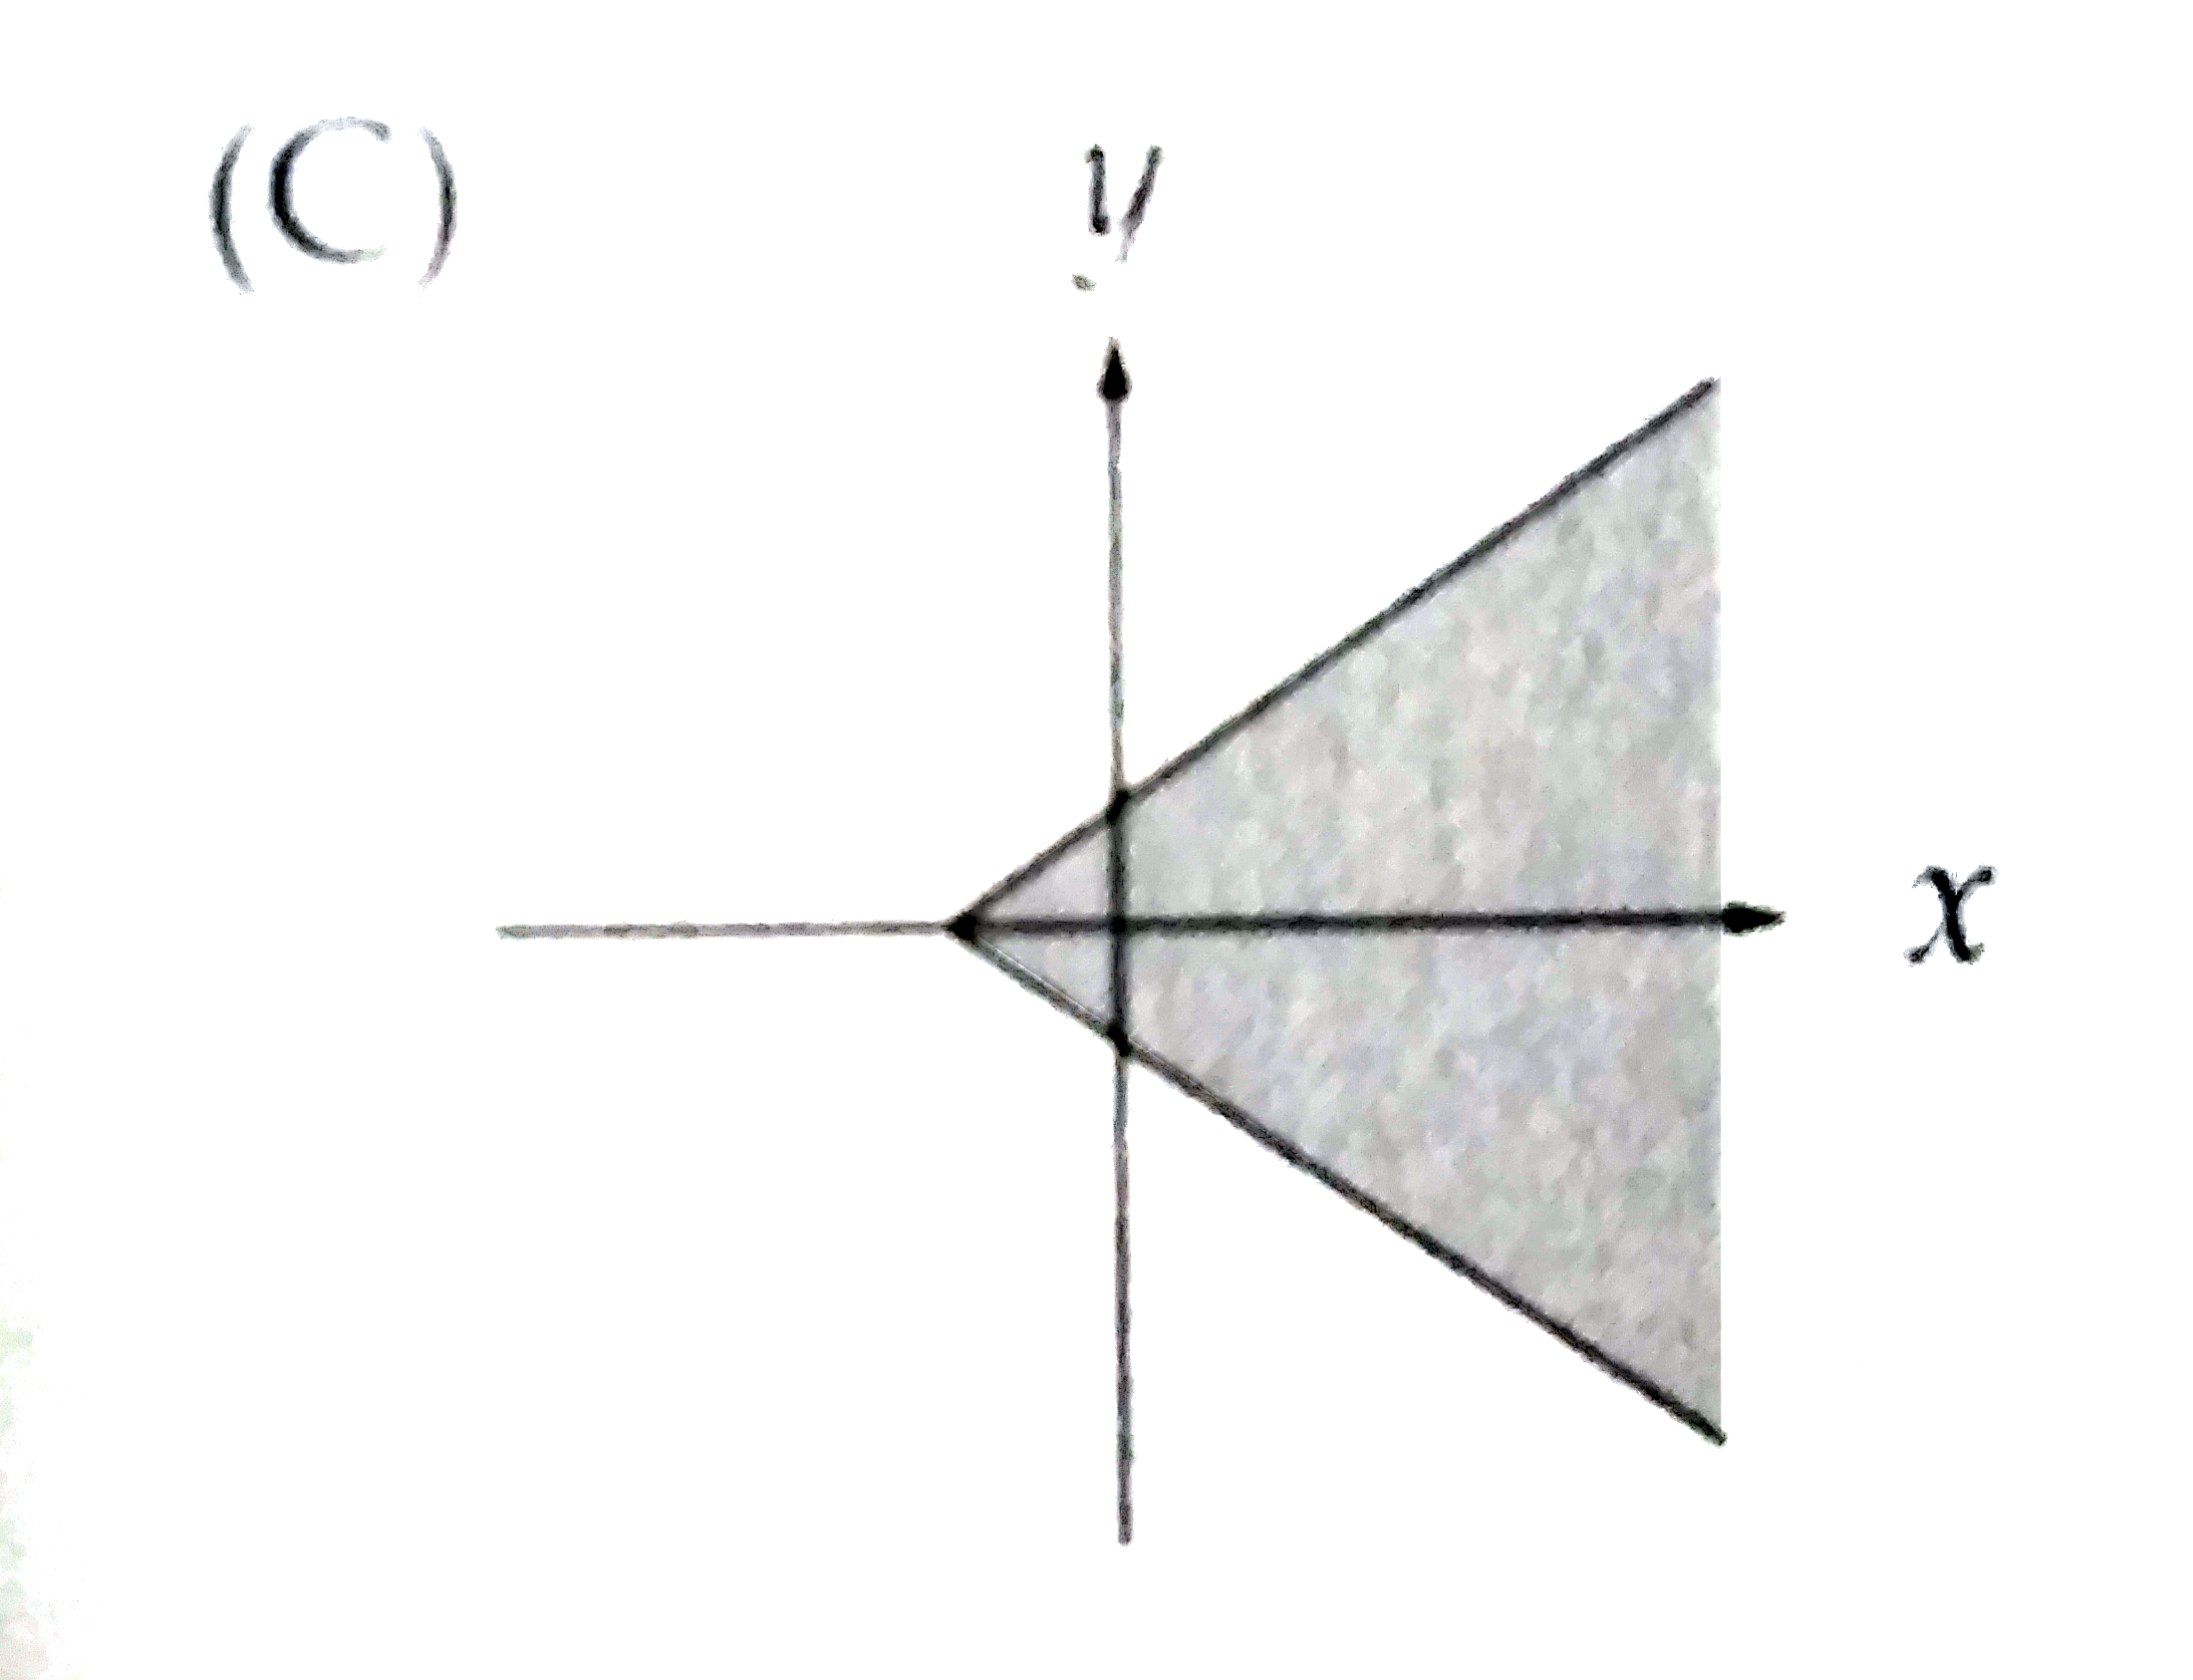 D
D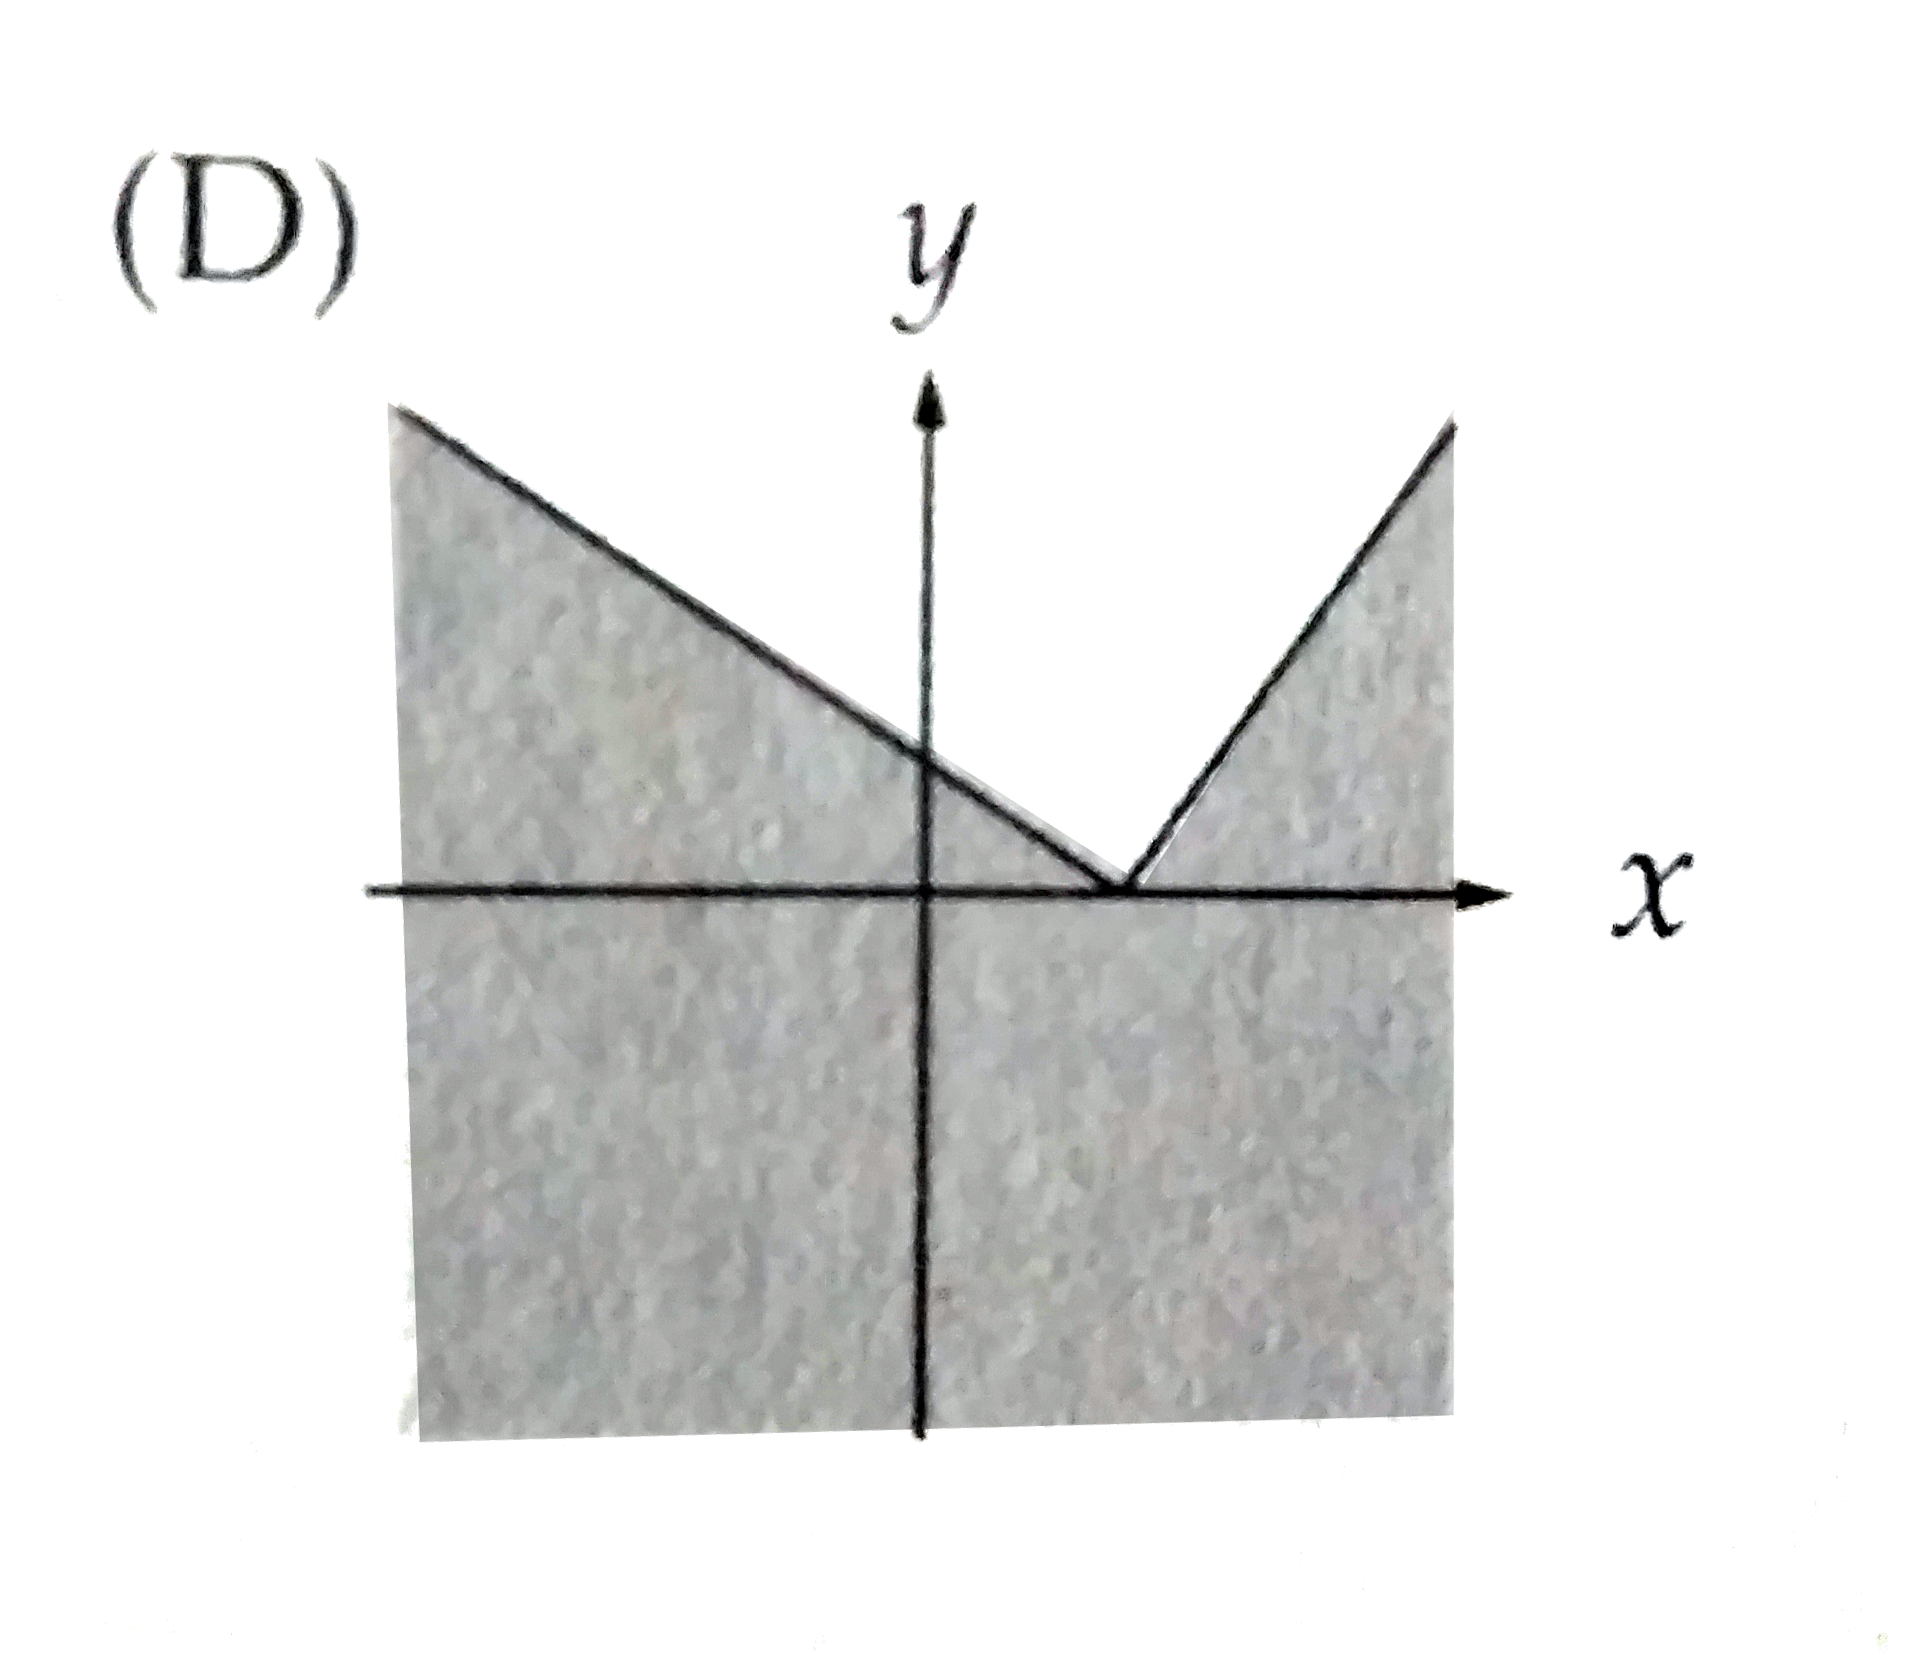
The current i in an induction coil varies with time according to the graph shown in figure. Which of the following graph shows induced emf in the coil with time:
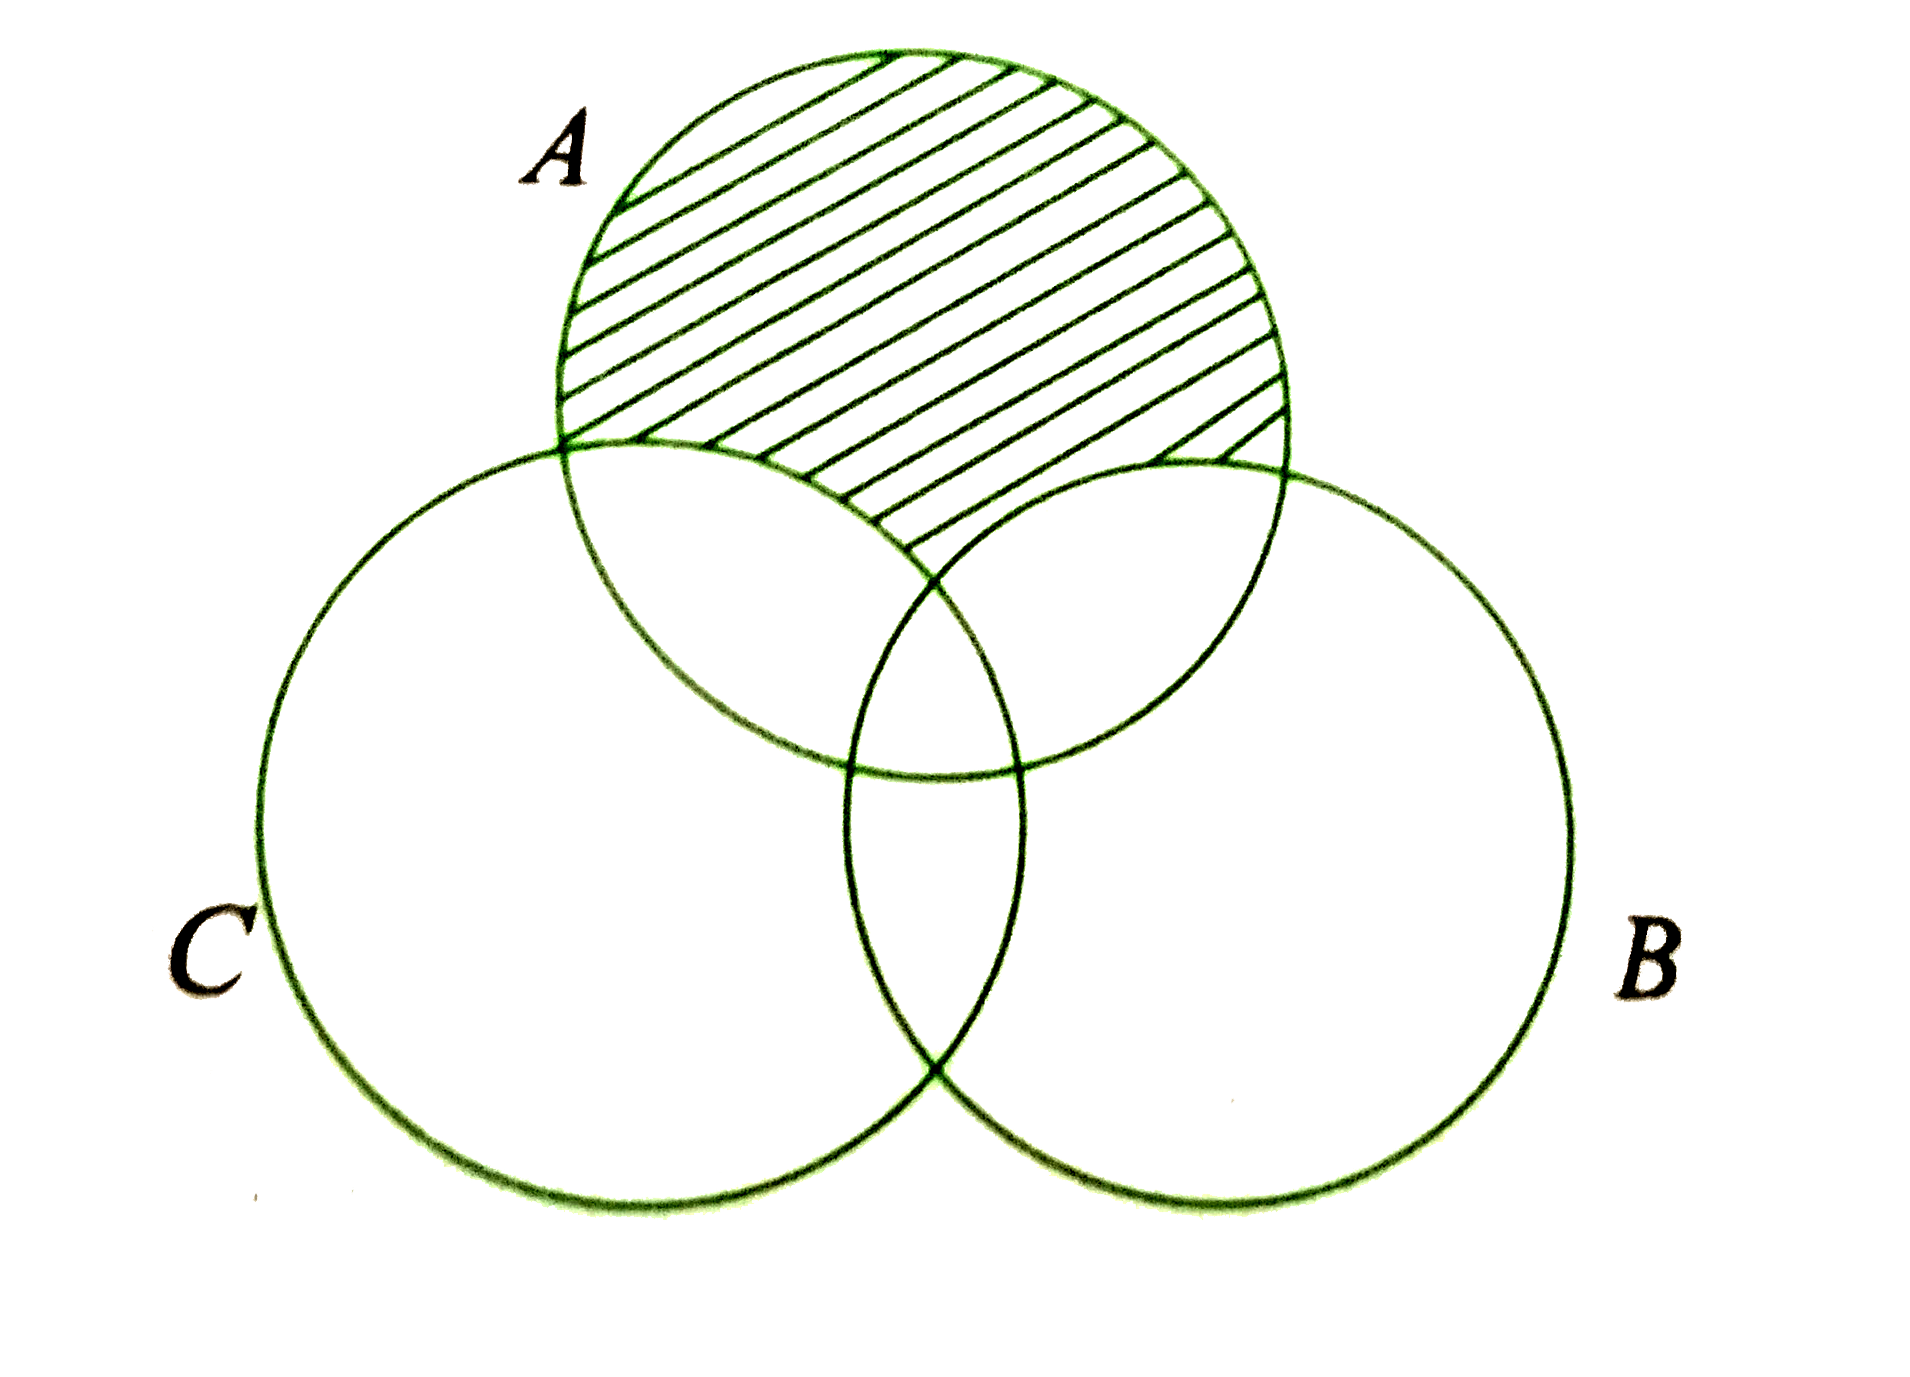
View SolutionThe shaded region in the given figure is
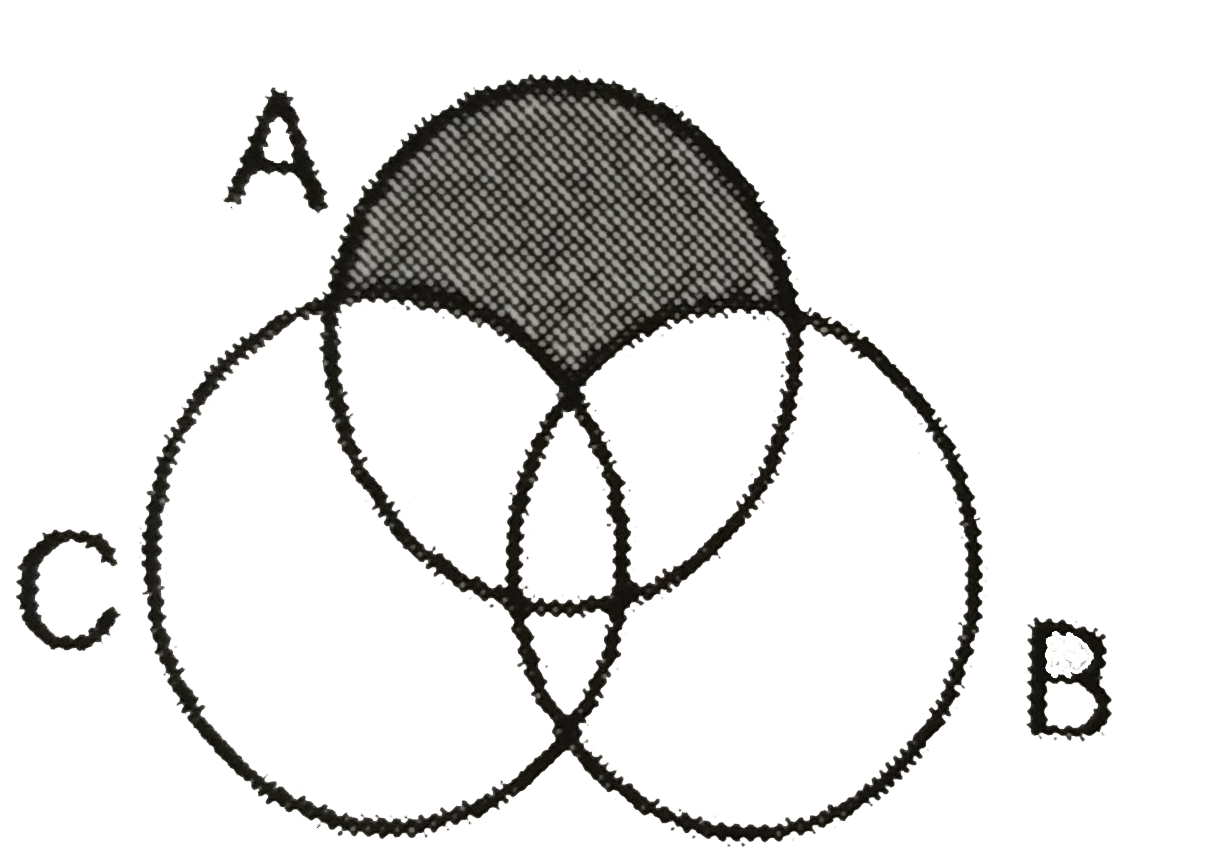
View SolutionThe shaded region in the given figure is
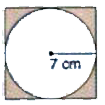
View SolutionFind the area of the shaded portion in each of the following diagrams :
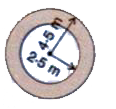
View SolutionFind the area of the shaded portion in each of the following diagrams :
View Solution

