Let i0 be the thermionic current from a metal surface when the absolute temperature of the surface is T0. The temperature is slowly increased and the thermionic current is measured as a function of temperature. Which of the following plots may represent the variation in (ii0) against (TT0) ?
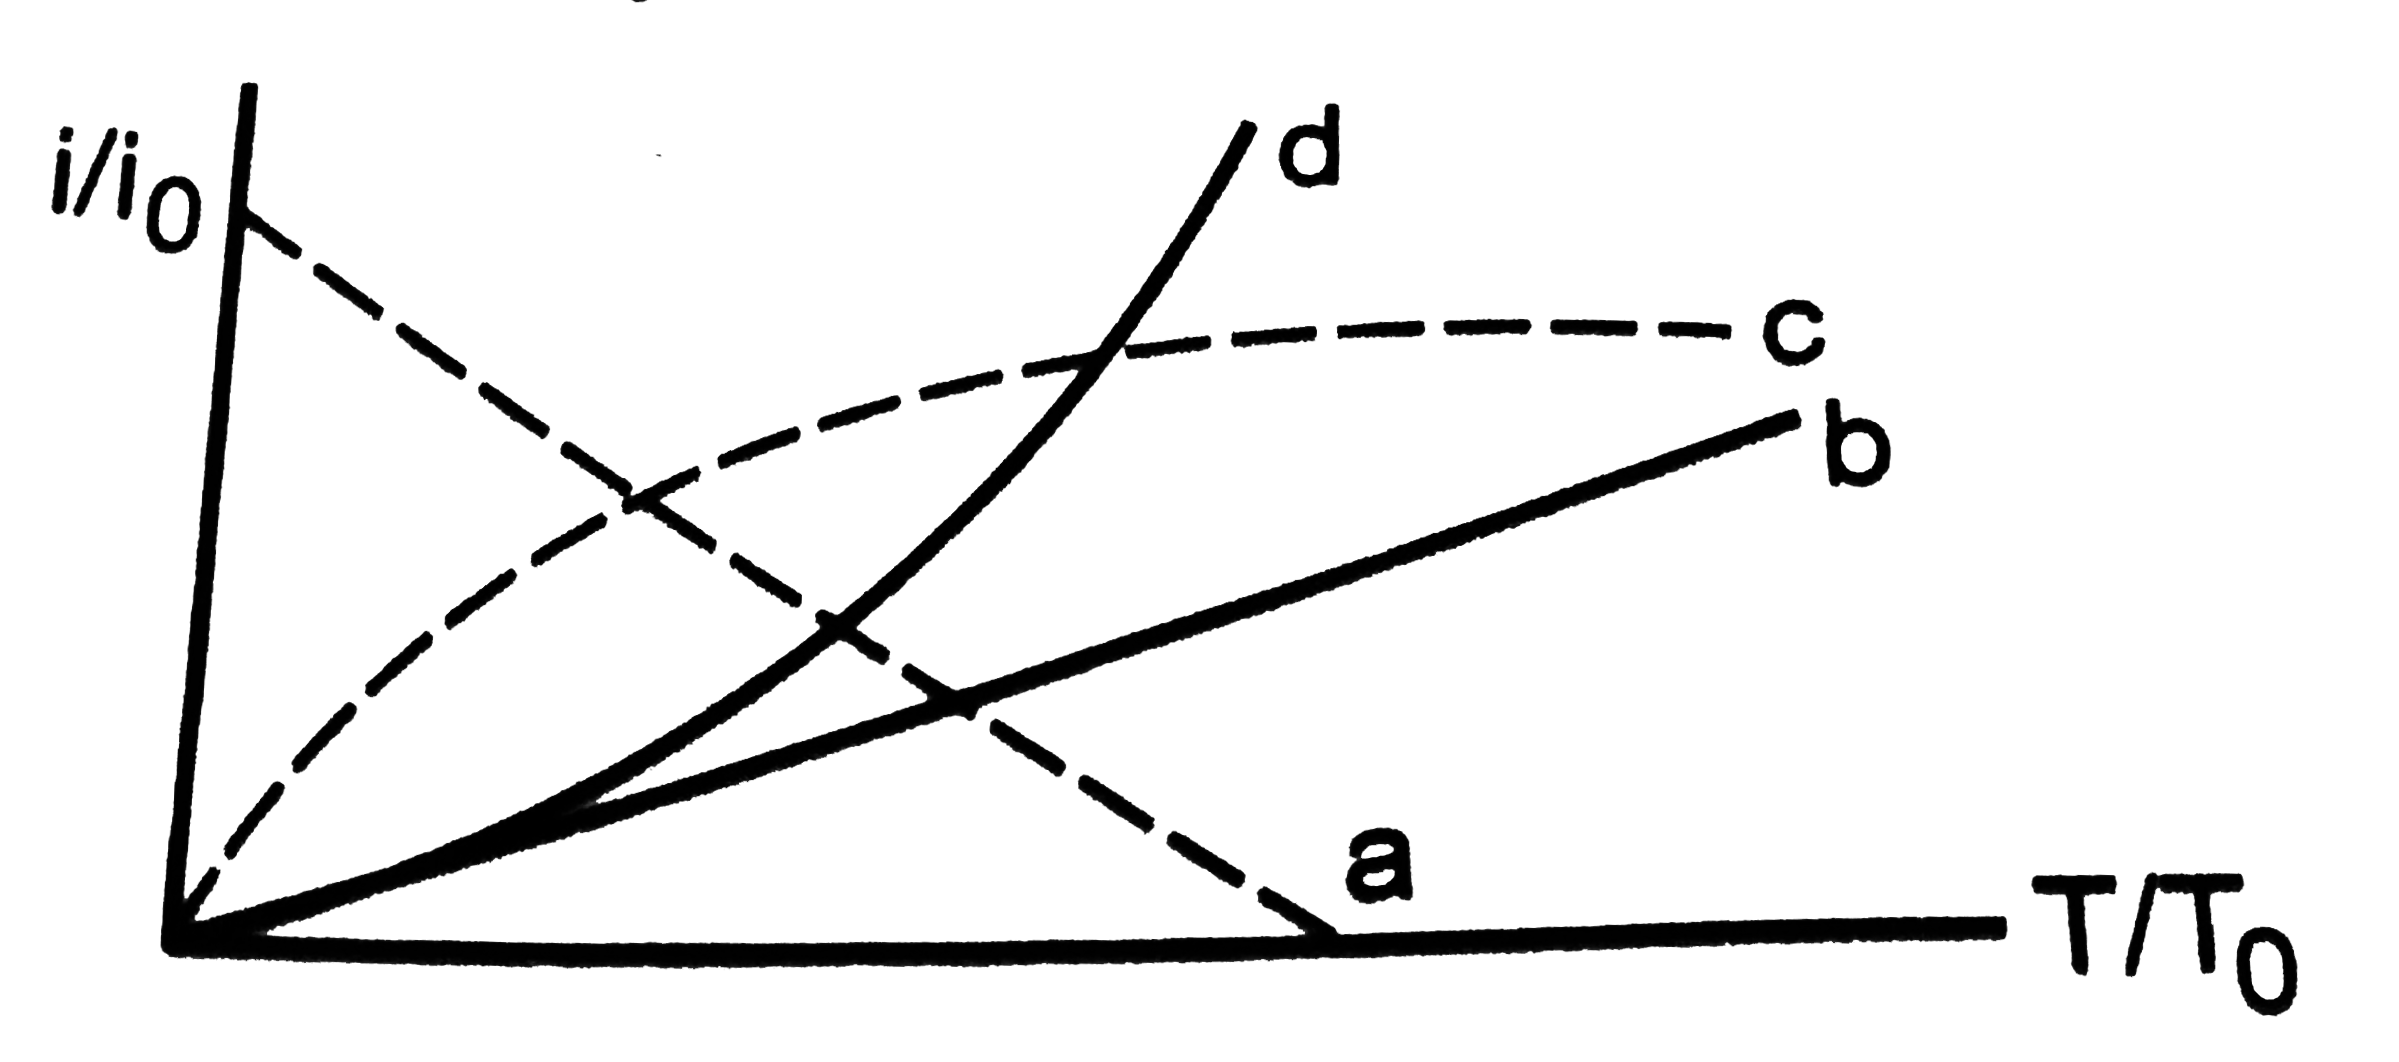
The correct Answer is:D
Step by step video & image solution for Let i_0 be the thermionic current from a metal surface when the absolute temperature of the surface is T_0. The temperature is slowly increased and the thermionic current is measured as a function of temperature. Which of the following plots may represent the variation in (i/i_0) against (T/T_0) ? by Physics experts to help you in doubts & scoring excellent marks in Class 12 exams.
Related Playlists
- BOOK - HC VERMA ENGLISHCHAPTER - ELECTRIC CURRENT THROUGH GASESEXERCISE - Objective 25videos
ELECTRIC CURRENT THROUGH GASES
- BOOK - HC VERMA ENGLISHCHAPTER - ELECTRIC CURRENT THROUGH GASESEXERCISE - Exercise23videos
ELECTRIC CURRENT THROUGH GASES
- BOOK - HC VERMA ENGLISHCHAPTER - ELECTRIC CURRENT THROUGH GASESEXERCISE - Worked out example9videos
ELECTRIC CURRENT THROUGH GASES
- BOOK - HC VERMA ENGLISHCHAPTER - ELECTRIC CURRENT IN CONDUCTORSEXERCISE - questions for short answer17videos
ELECTRIC CURRENT IN CONDUCTORS
- BOOK - HC VERMA ENGLISHCHAPTER - ELECTRIC FIELD AND POTENTIALEXERCISE - Objective 27videos
ELECTRIC FIELD AND POTENTIAL
Similar Practice Problems
- Question 1 - Select One
A hot liquid is kept in a bog room. Accoding to Newton's law of cooling rate of cooling liquid (represented as y) is plotted against its temperature T. Which of the following curves may represent the plot?
A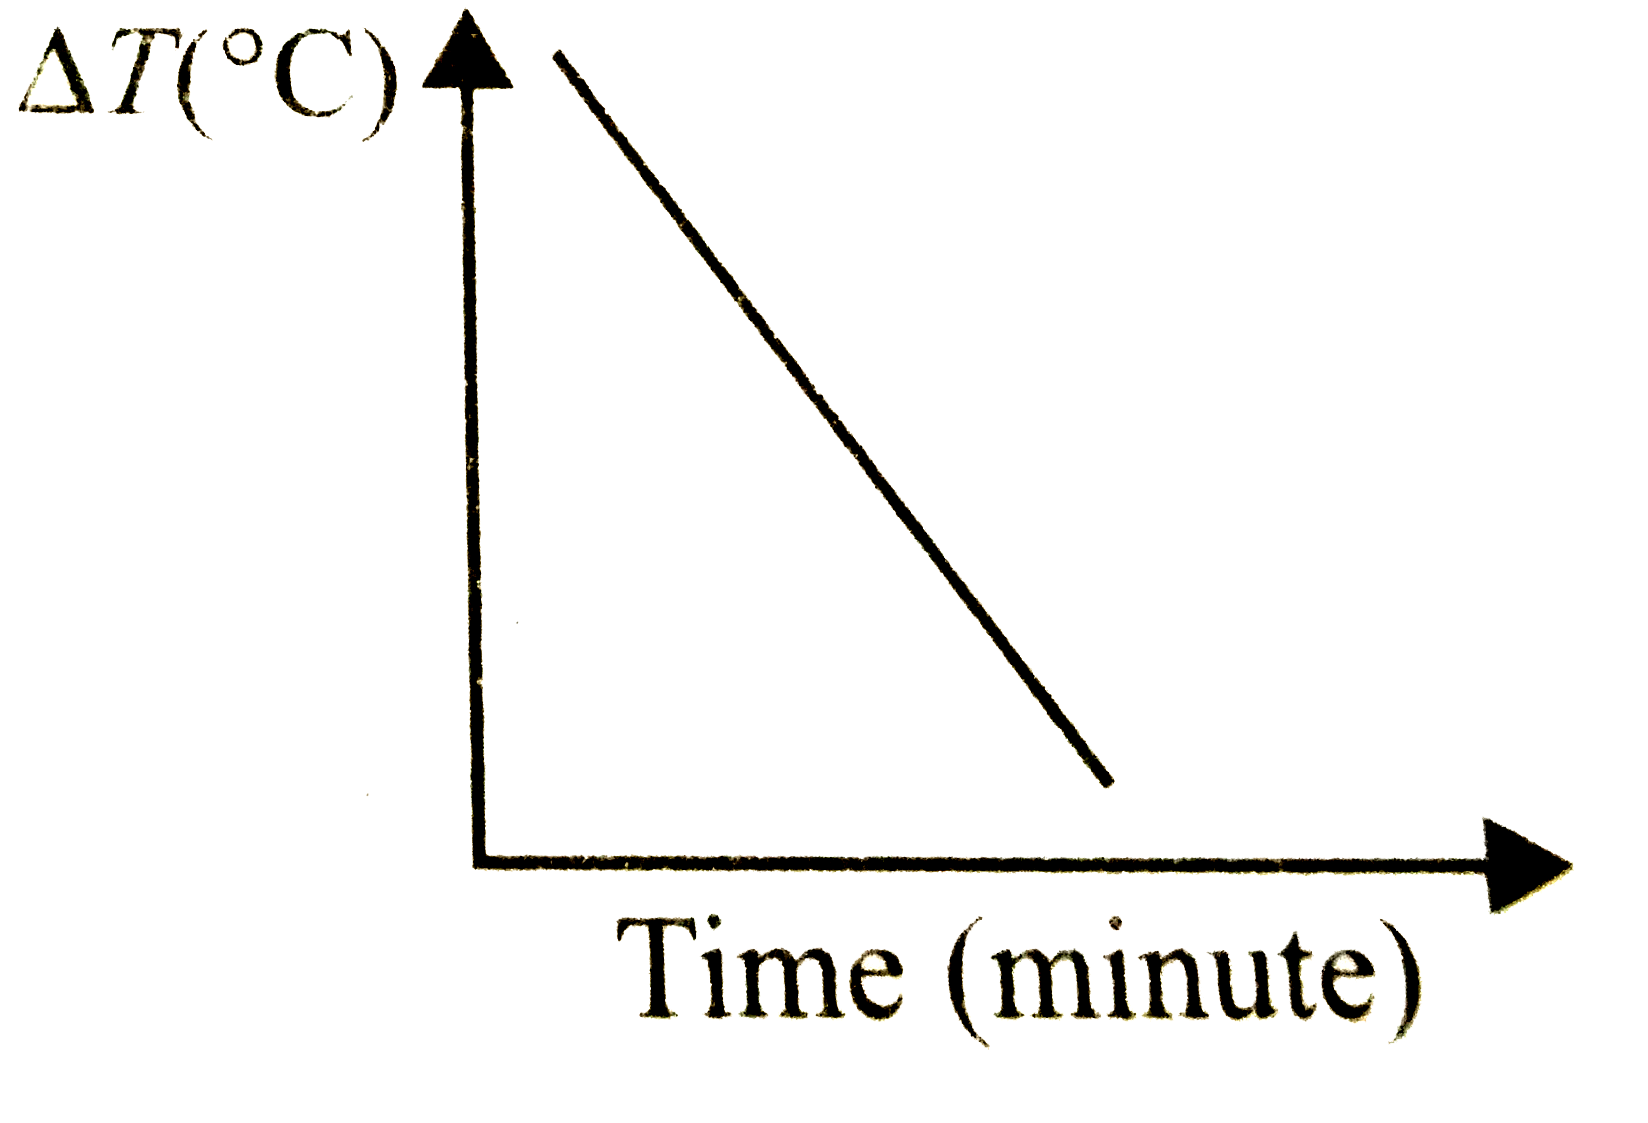 B
B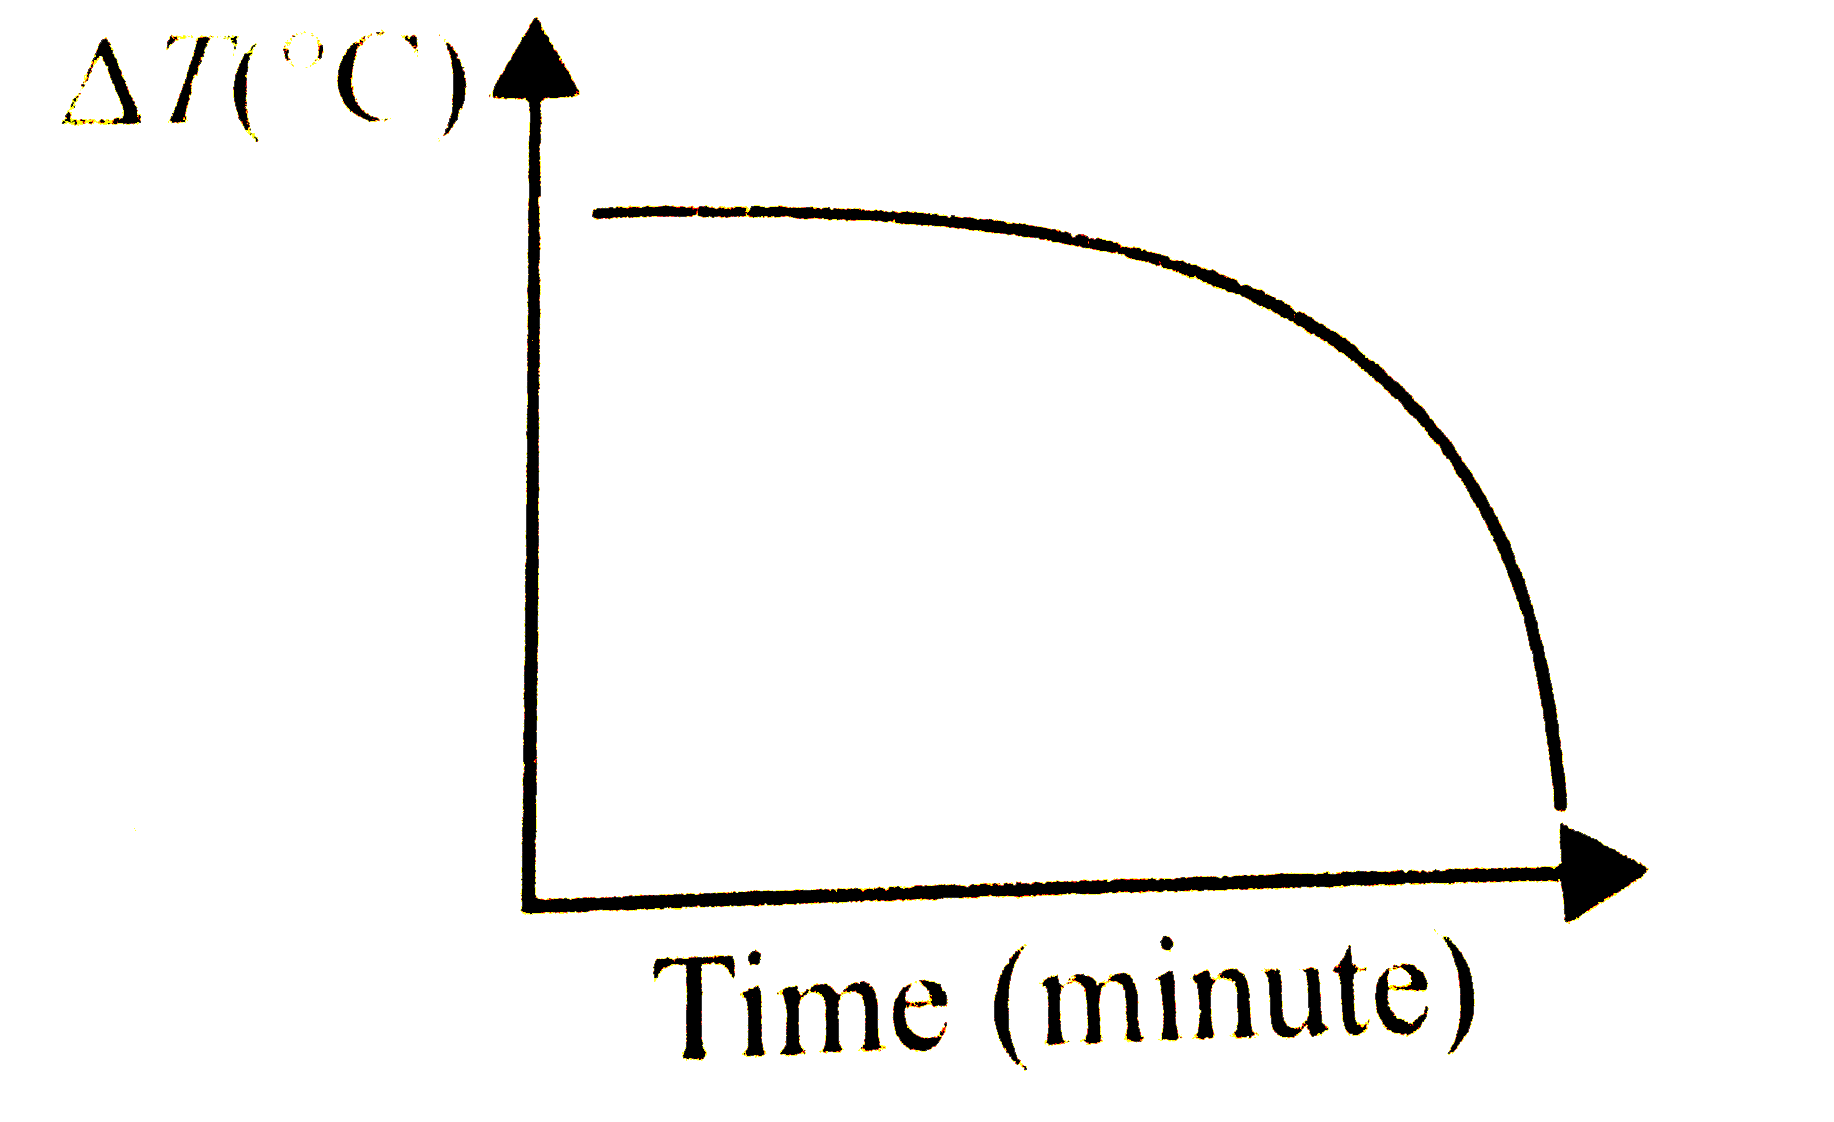 C
C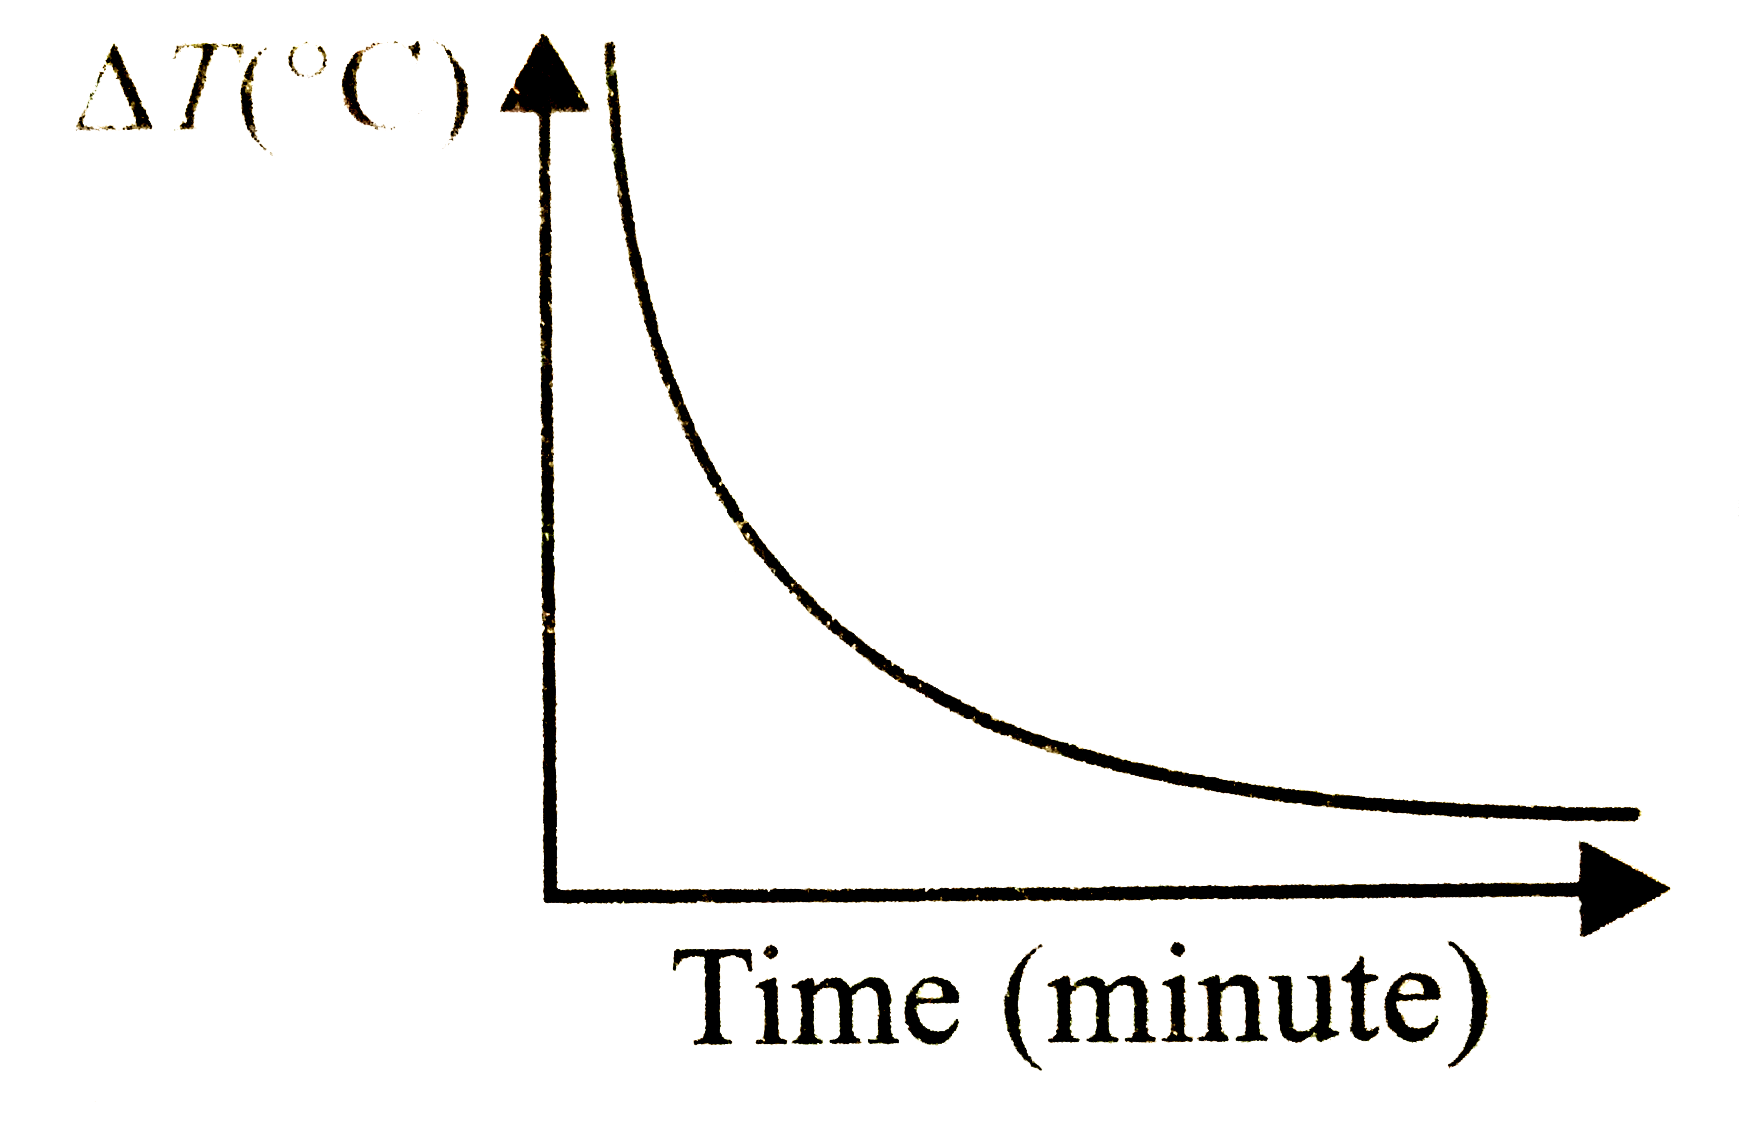 D
D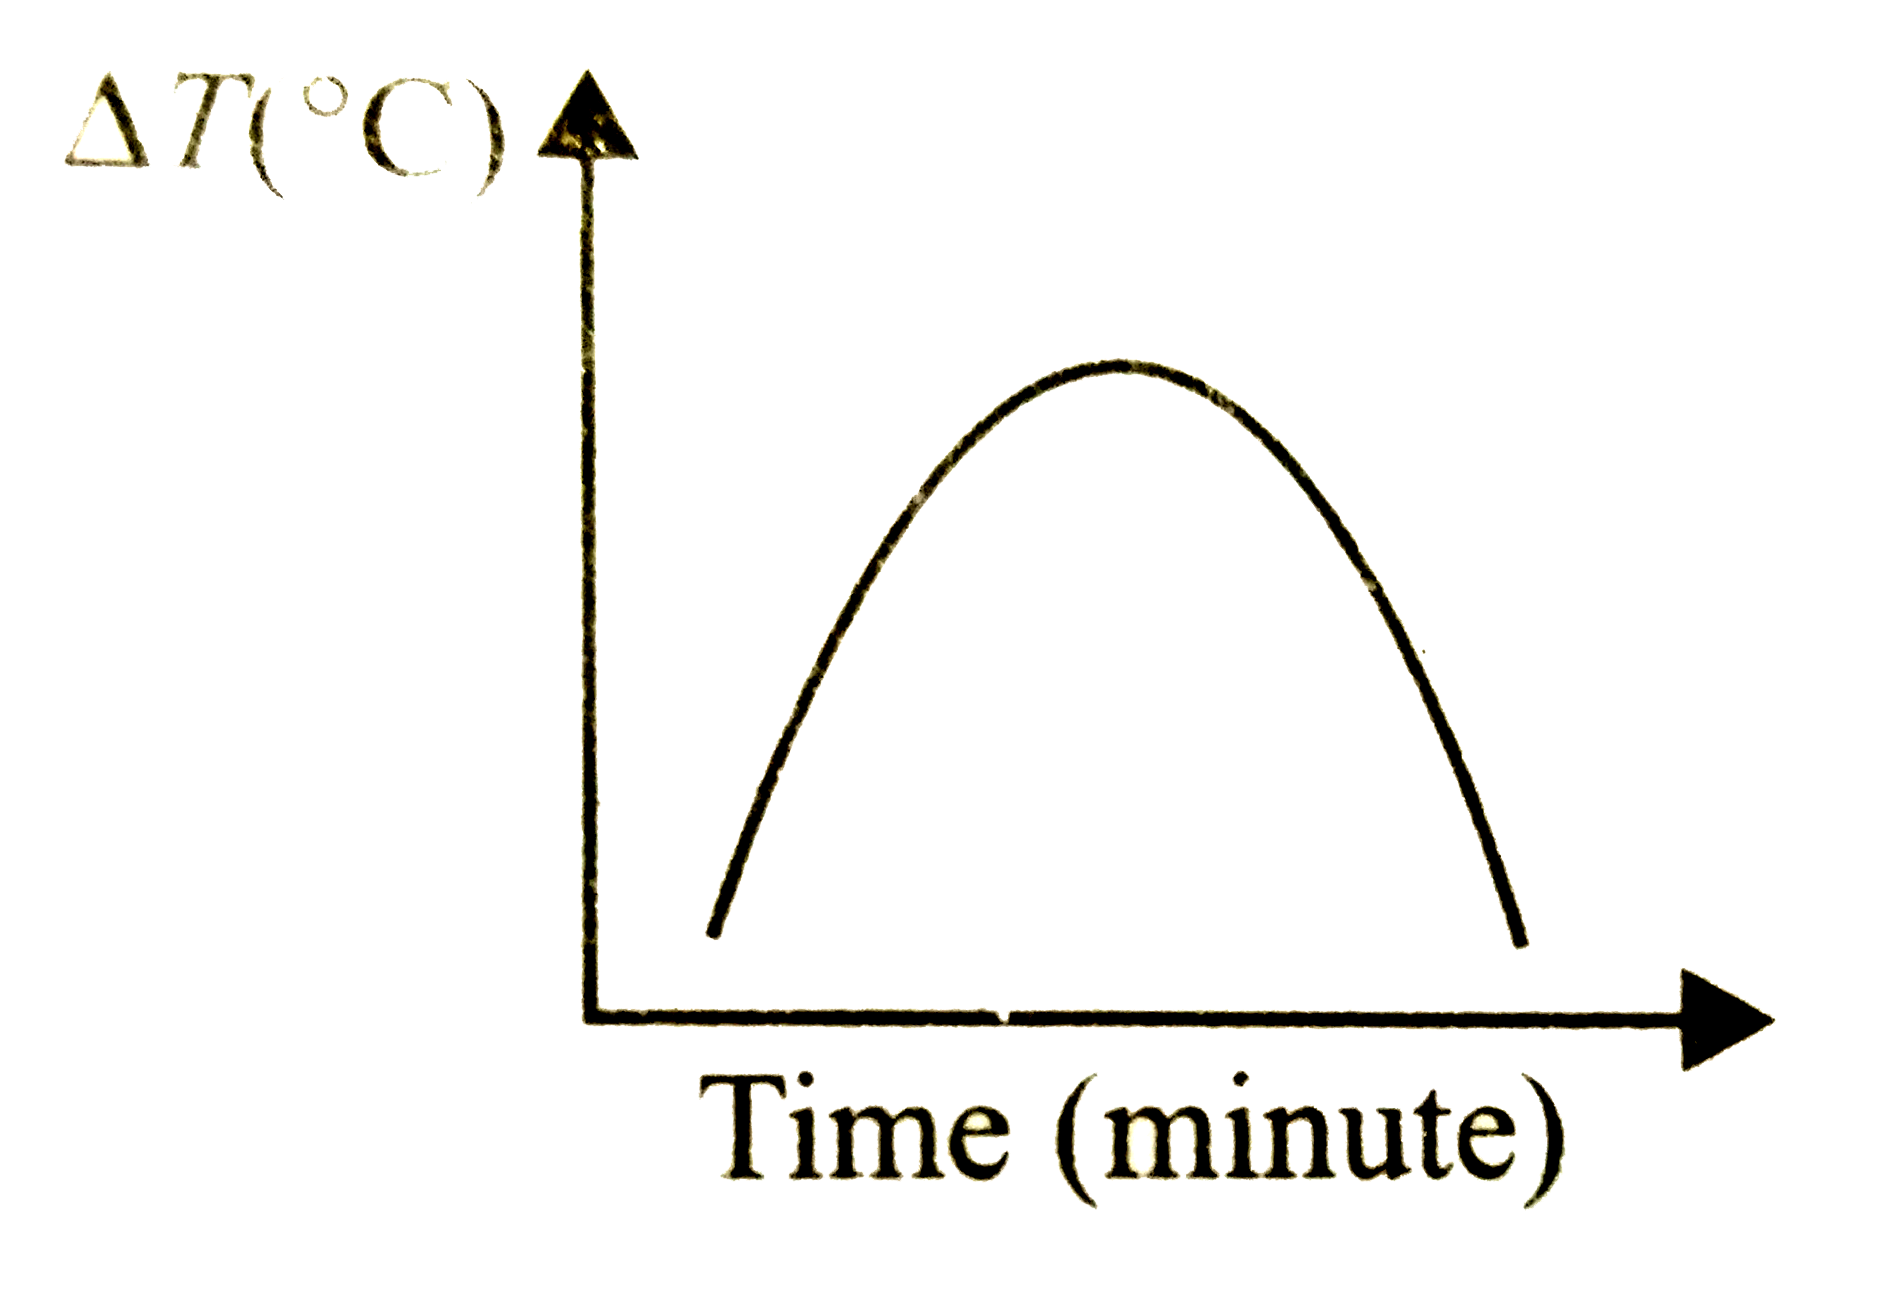
Similar Questions
Which of the following graph represents the variation of resistivity (ρ) with temperature (T) for copper?
View SolutionA hot liquid is kept in a big room. According to Newton's law of cooling rate of cooling liquid (represented as y) is plotted against its temperature T. Which of the following curves may represent the plot?
View SolutionWhen an electric heater is switched on, the current flowing through it ( i ) is plotted against time ( t ). Taking into account the variation of resistance with temperature, which of the following best represents the resulting curve
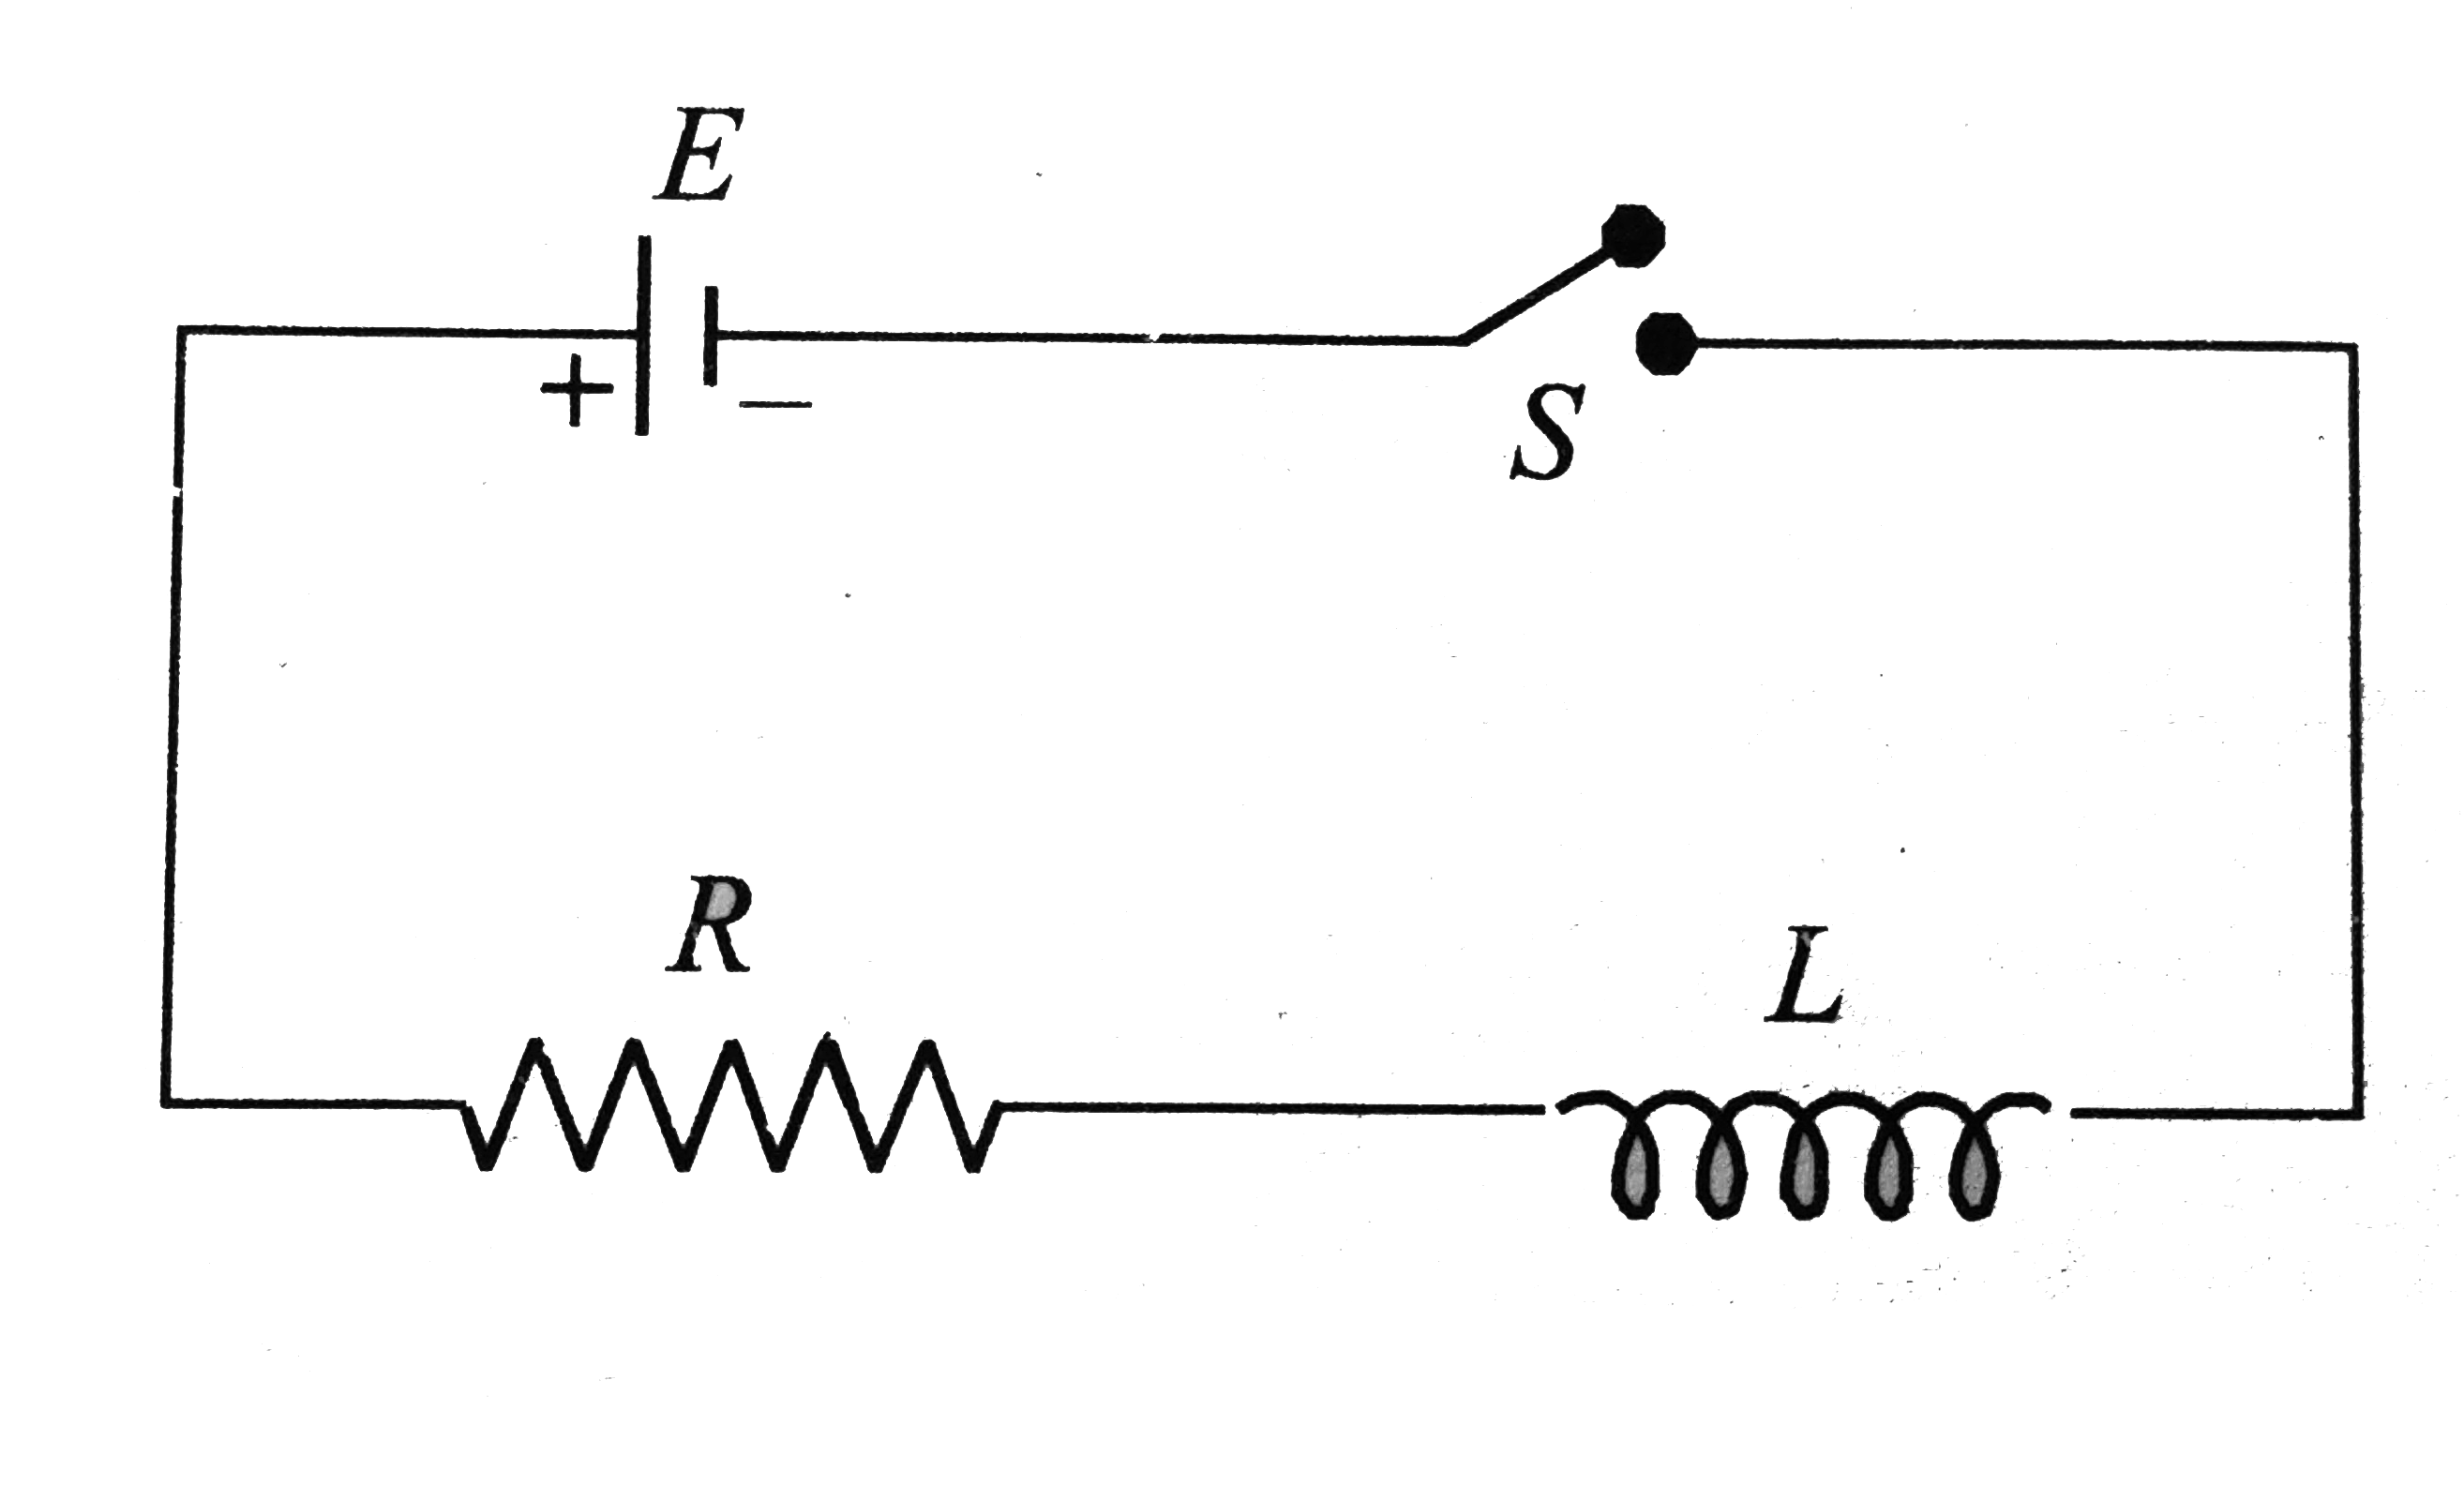
View SolutionSwitch S of the circuit shows in Fig. is closed at t=0. If e denotes the induced emf in L and i the current flowing through the circuit at time t, then which of the following graphs correctly represents the variation of e with i?
 View Solution
The surface temperature of the sun is T0 and it is at average distance d from a planet. The radius of the sun is R. The temperature at which planet radiates the energy is
View SolutionThe frequency of oscillation of current in the indcutor is
 View Solution
The work function of a thermionic emitter is 4.5eV. By what factor does the thermionic current increase if its temperature is raised from 1500K→2000K?
View SolutionIf a piece of metal is heated to temperature θ and the allowed to cool in a room which is at temperature θ0, the graph between the temperature T of the metal and time t will be closet to
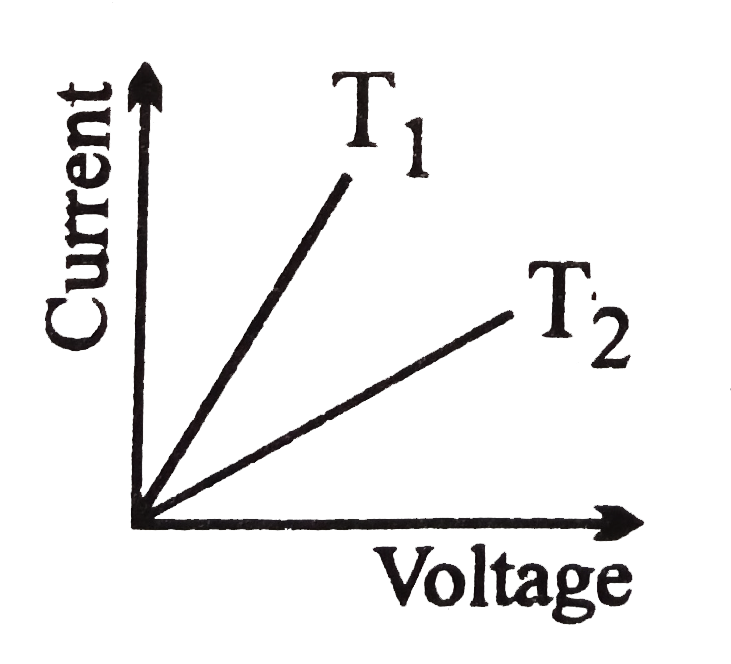
View SolutionThe current in a metallic conductor is plotted against voltage at two different temperatures T1 and T2. Which is correct
 View Solution

