Complete Solutions to ILLUSTRATION of chapter GRAPHICAL TRANSFORMATIONS of Class 12 book with complete answers and questions
| Class 12 | MATHS |
| Chapter | GRAPHICAL TRANSFORMATIONS |
| CENGAGE NEW | ILLUSTRATION |
| Number Of Questions | 78 |
| Academic Year | 2023-24 |
Plot `y=|x|,y+x-2|,a n dy=|x|2|`
02:50View SolutionDraw the graph of `y=sin^(-1)(x-3)`.
02:35View SolutionDraw the graph of `y="log"_(e)(x+3)`,
02:03View SolutionDraw the graph of `y=cot^(-1)x+sec^(-1)x+cosec^(-1)x`.
02:34View SolutionDraw the graph of `y=|x-3|+1`.
02:20View SolutionSolve `|x-1|-|x+3|lt6` graphically
04:23View SolutionFor `alt=0` , determine all real roots of the equation (1986, 5M) `x^2-2a|x-a|-3a^2=0`
04:31View SolutionConsider the function `f(x)={{:(x-[x]-(1)/(2),x !in),(0, "x inI):}` where [.] denotes the fractional integral function and I is the set of integers. Then find `g(x)max.[x^(2),f(x),|x|},-2lexle2.`
05:00View SolutionDraw the graph of `y=log_(e)3x` and compare with `y=log_(e)x`.
02:13View SolutionDraw the graph of `y=cos^(-1)(x//4)` and compare with `y=cos^(-1)x`.
04:56View SolutionDraw the graph of `y=0.5(x-1)^(2)` and compare with `y=(x-1)^(2)`.
02:58View SolutionPlot `y=sinxa n dy=sin2xdot`
03:10View SolutionIf `nsinx=log_(e)x` has exactly 1 root, then find the possible value of `n(ninN)`.
07:58View SolutionPlot the curve `y=(log)_e(-x)dot`
02:45View SolutionDraw the graph of `y=2^(-x)`.
02:41View SolutionDraw the graph of `y=cot^(-1)(-x)`.
01:53View SolutionDraw the graph of `y=-cot^(-1)x`.
02:15View SolutionDraw the graph of `y=-log_(e)x`.
01:43View SolutionDraw the graph of `y=2-|x-1|`.
03:21View SolutionDraw the graph of `y=sin^(-1)(cosx)`.
04:36View SolutionGiven the graph of `y=f(x)`.
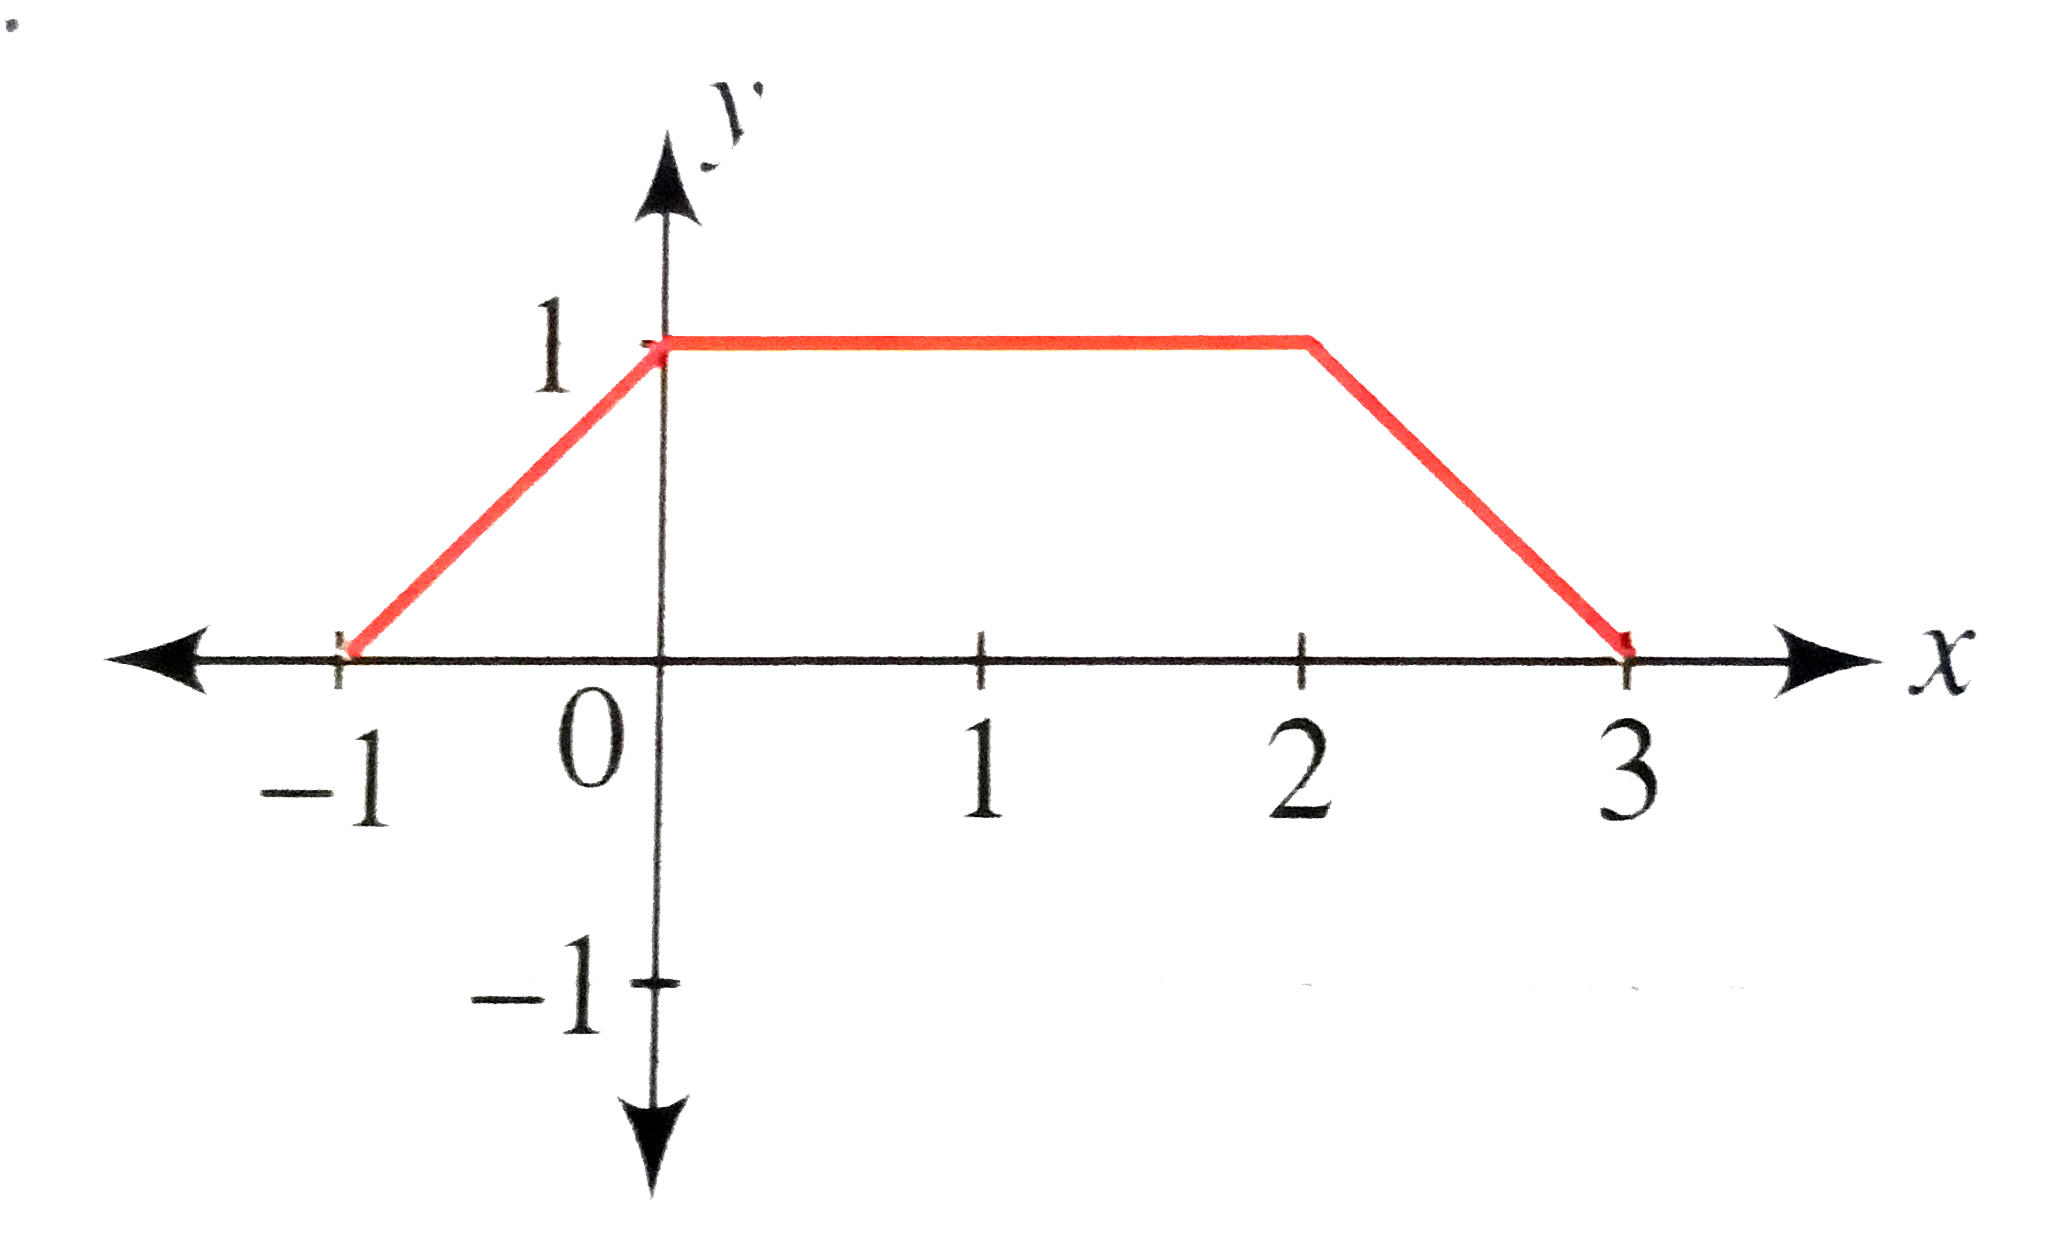
Draw the graphs of the followin.
(a) `y=f(1-x)` (b) `y=-2f(x)`
(c) `y=f(2x)` (d) `y=1-f(x)`08:08View SolutionDraw the graph of `y=|logx|`.
01:37View SolutionDraw the graph of `y=|sinx|` and hence the graph of `y=sin^(-1)|sinx|`.
02:35View SolutionDraw the graph of `y=f(x)=sqrt(1-cosx)`
03:05View SolutionDrew the graph of `y=|sinx-0.5|`.
03:10View SolutionThe number of solution of `2cosx=|sinx|` where `x in [0.4pi]` is/are
03:57View SolutionSolve `|x^2+4x+3|+2x+5=0.`
06:05View SolutionSolve `cos2xgt|sinx|,x in(-(pi)/(2),pi)`
04:15View SolutionProve that the equation `2 sin x=|x|+a` has no solution for `a in ((3sqrt(3)-pi)/3, oo)`.
03:31View SolutionSolve `|x^(2)-1|+|x^(2)-4|lt6` graphically.
07:17View SolutionDiscuss the differentiability of `f(x)=mim.{|x|,|x-2|,2-|x-1|}`.
03:30View SolutionIf the equation `|x^2+b x+c|=k` has four real roots, then a. `b^2-4c > 0` and `0 < k < (4c-b^2)/4` b. `b^2-4c < 0` and `0 < k < (4c-b^2)/4` c. `b^2-4c > 0` and `k > (4c-b^2)/4` d. none of these
03:43View SolutionSketch the curve `y="log"|x|`
01:43View SolutionDraw the graph of `y=sin|x|`.
02:19View SolutionDraw the graph of `y=[|x|]`, where `[.]` denotes the greatest integer function.
04:33View SolutionDraw the graph of `y=sin^(-1)|x|`.
01:24View SolutionDraw the graph of `y=tan^(-1)|x|`.
01:16View SolutionDraw the graph of `y={|x|}`, where `{.}` represents the fractional part function.
04:22View SolutionIf `y = x^3-3x + 2`, then draw the graph of the followings (i) `y=|x^3-3x + 2|`
01:59View SolutionDraw the graph of `y=|1-(1)/(|x|-2)|`.
09:45View SolutionDraw the graph of `|y|=|2^|x|-3|`.
04:42View SolutionFind the total number of solutions to `sinpi x=|ln|x||`.
02:27View SolutionFind the number of solutions to `7^|x|(|1-|x||)=1`.
02:53View SolutionThe graph of the function `y=f(x)` is shown.
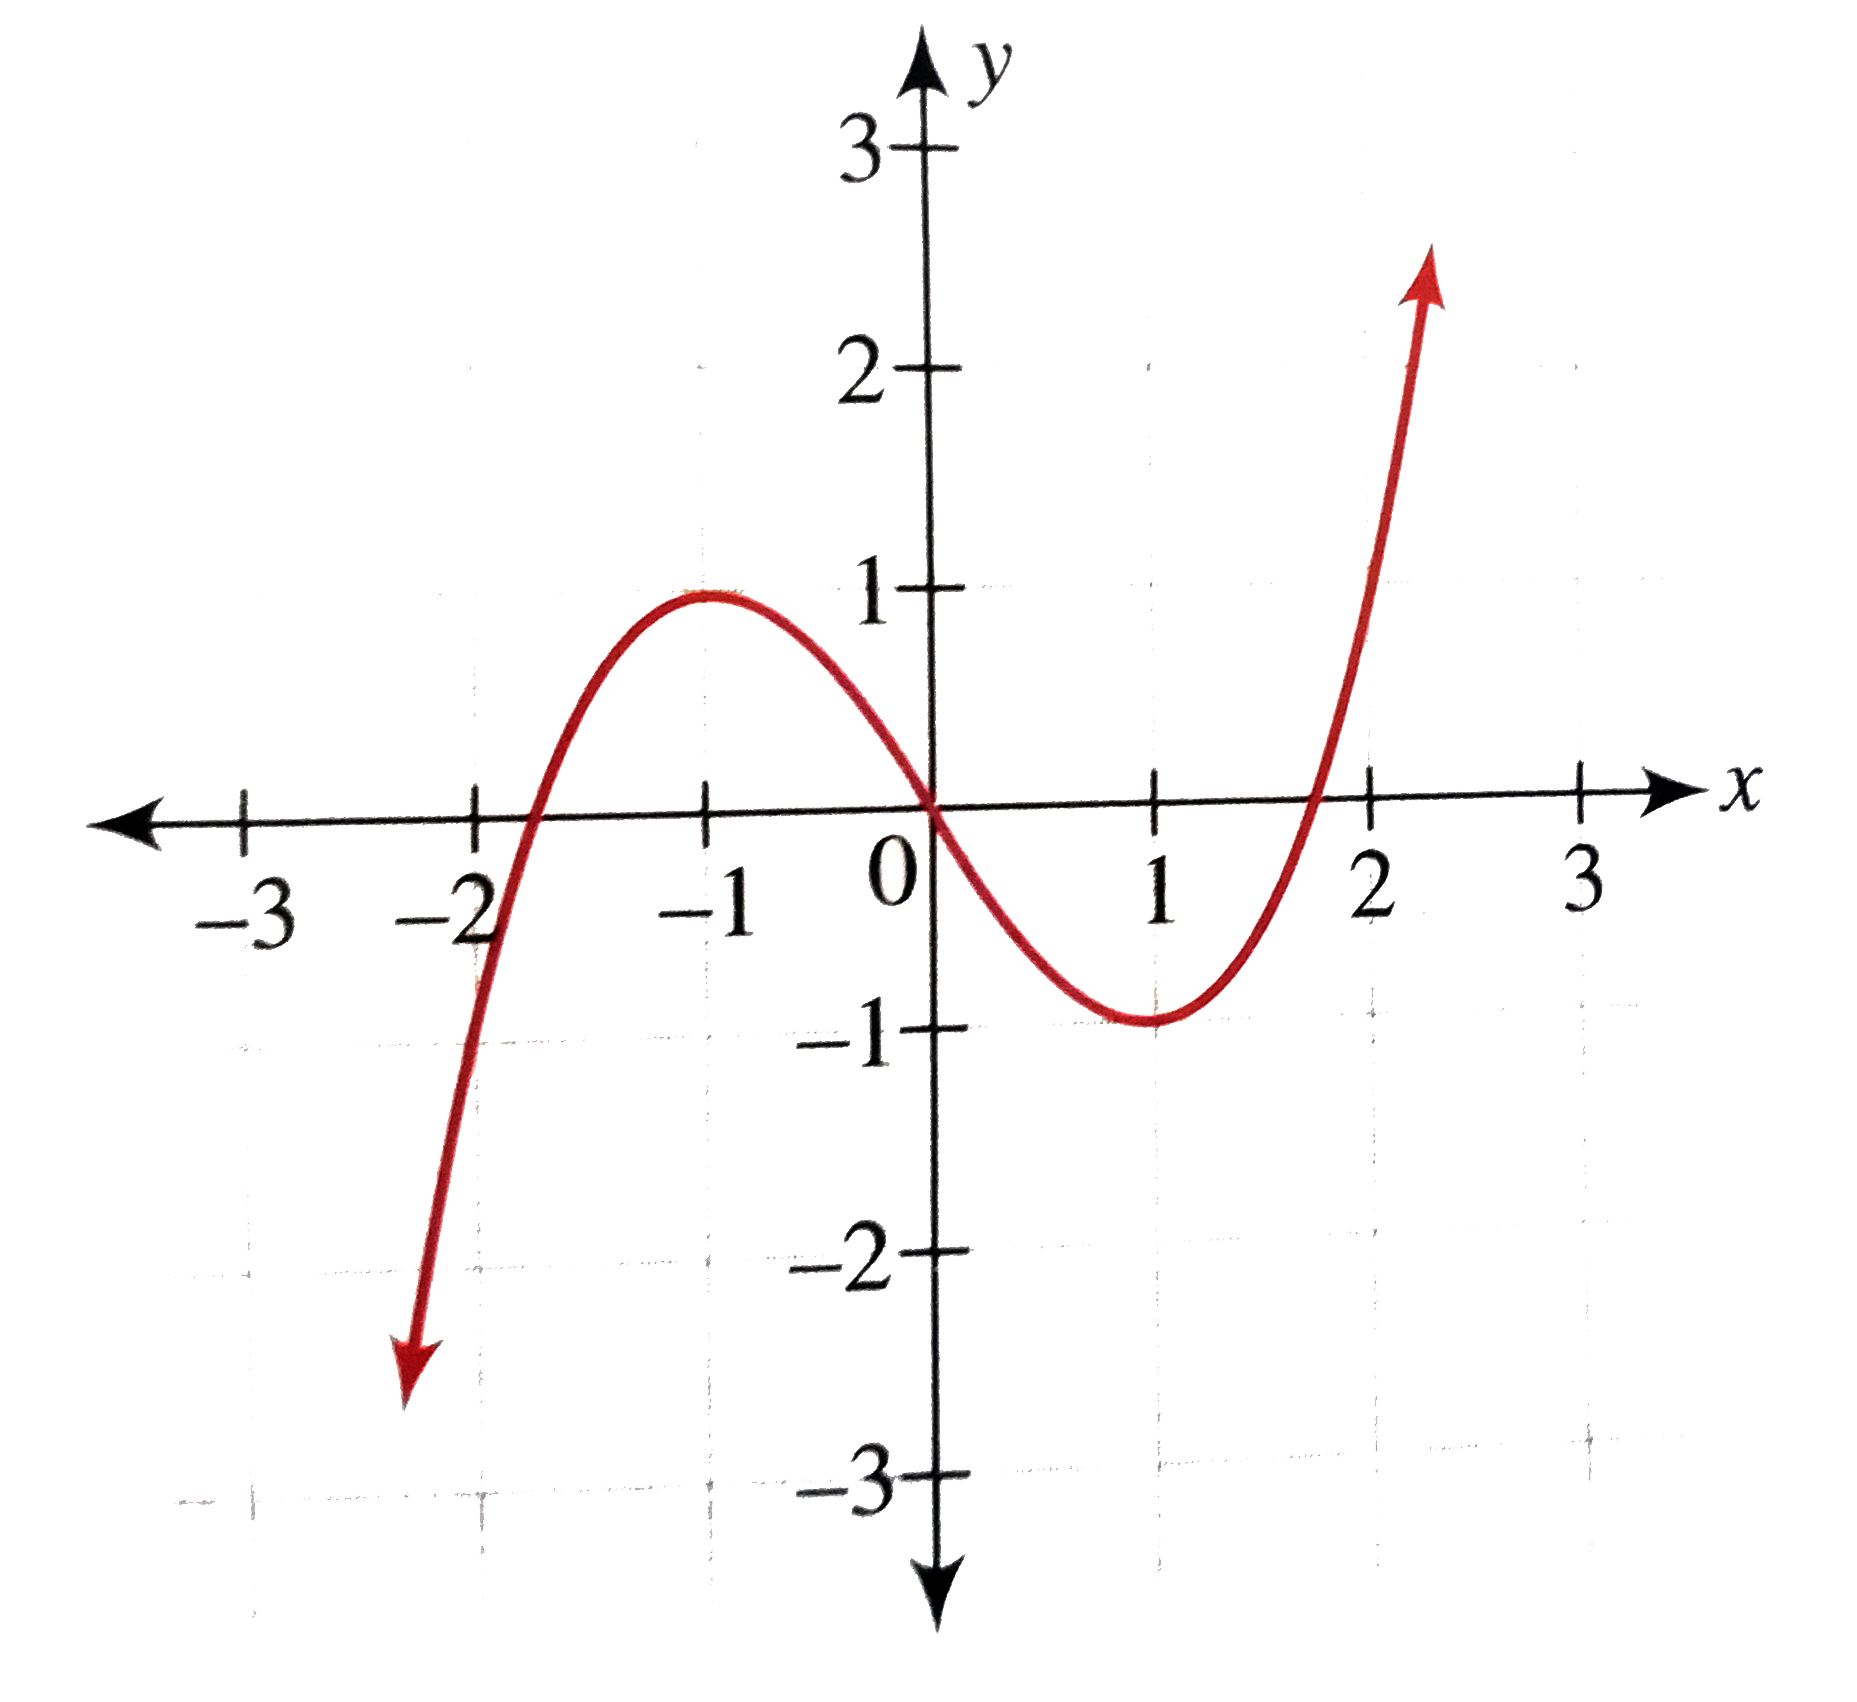
Find the number of solutions to the equation `||f(x)|-1|=(1)/(2)`.04:22View SolutionConsider the function `f(x)=x^(2)+bx+c,` where `D=b^(2)-4cgt0`, then match the follwoing columns.
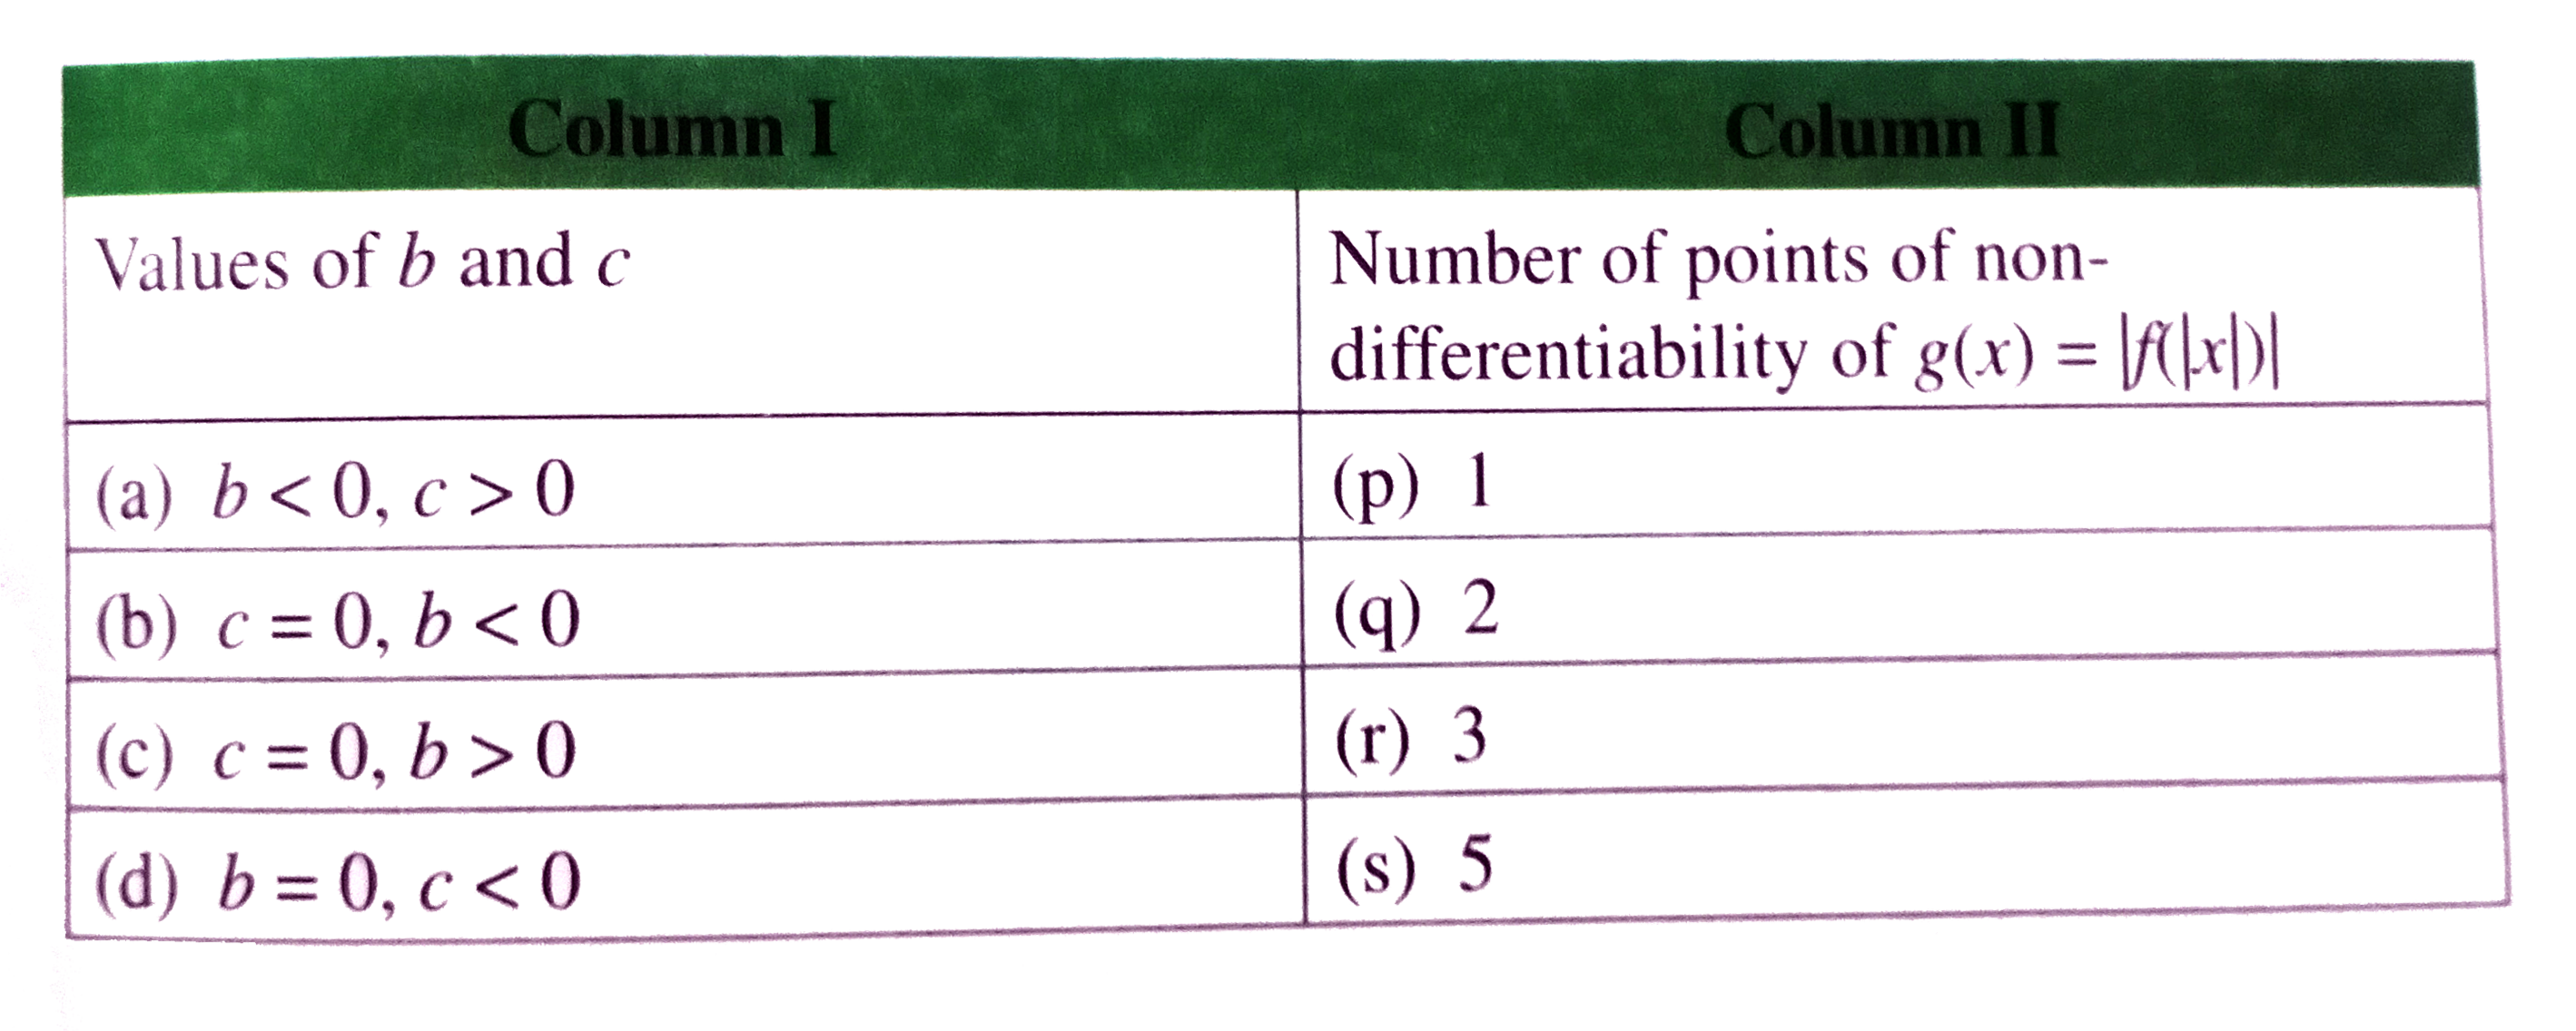 09:21View Solution
Draw the graph of `|y|=sinx`.
02:49View SolutionDraw the graph of `|y|=tanx`.
02:00View SolutionSketch the curve `|y|=(x-1)(x-2)dot`
01:36View SolutionDraw the graph of `|y|={x}`, where `{.}` represents the fractional part function.
02:08View SolutionDraw the graph of `|x|+|y|=1+x`.
02:25View SolutionDraw the graph of `|x|-|y|=2` using graphical transformation.
02:18View SolutionDraw the graph of `y=|2^(|x|)-3|`.
04:42View SolutionThe graph of the function `y=f(x)` is as shown in the figure.
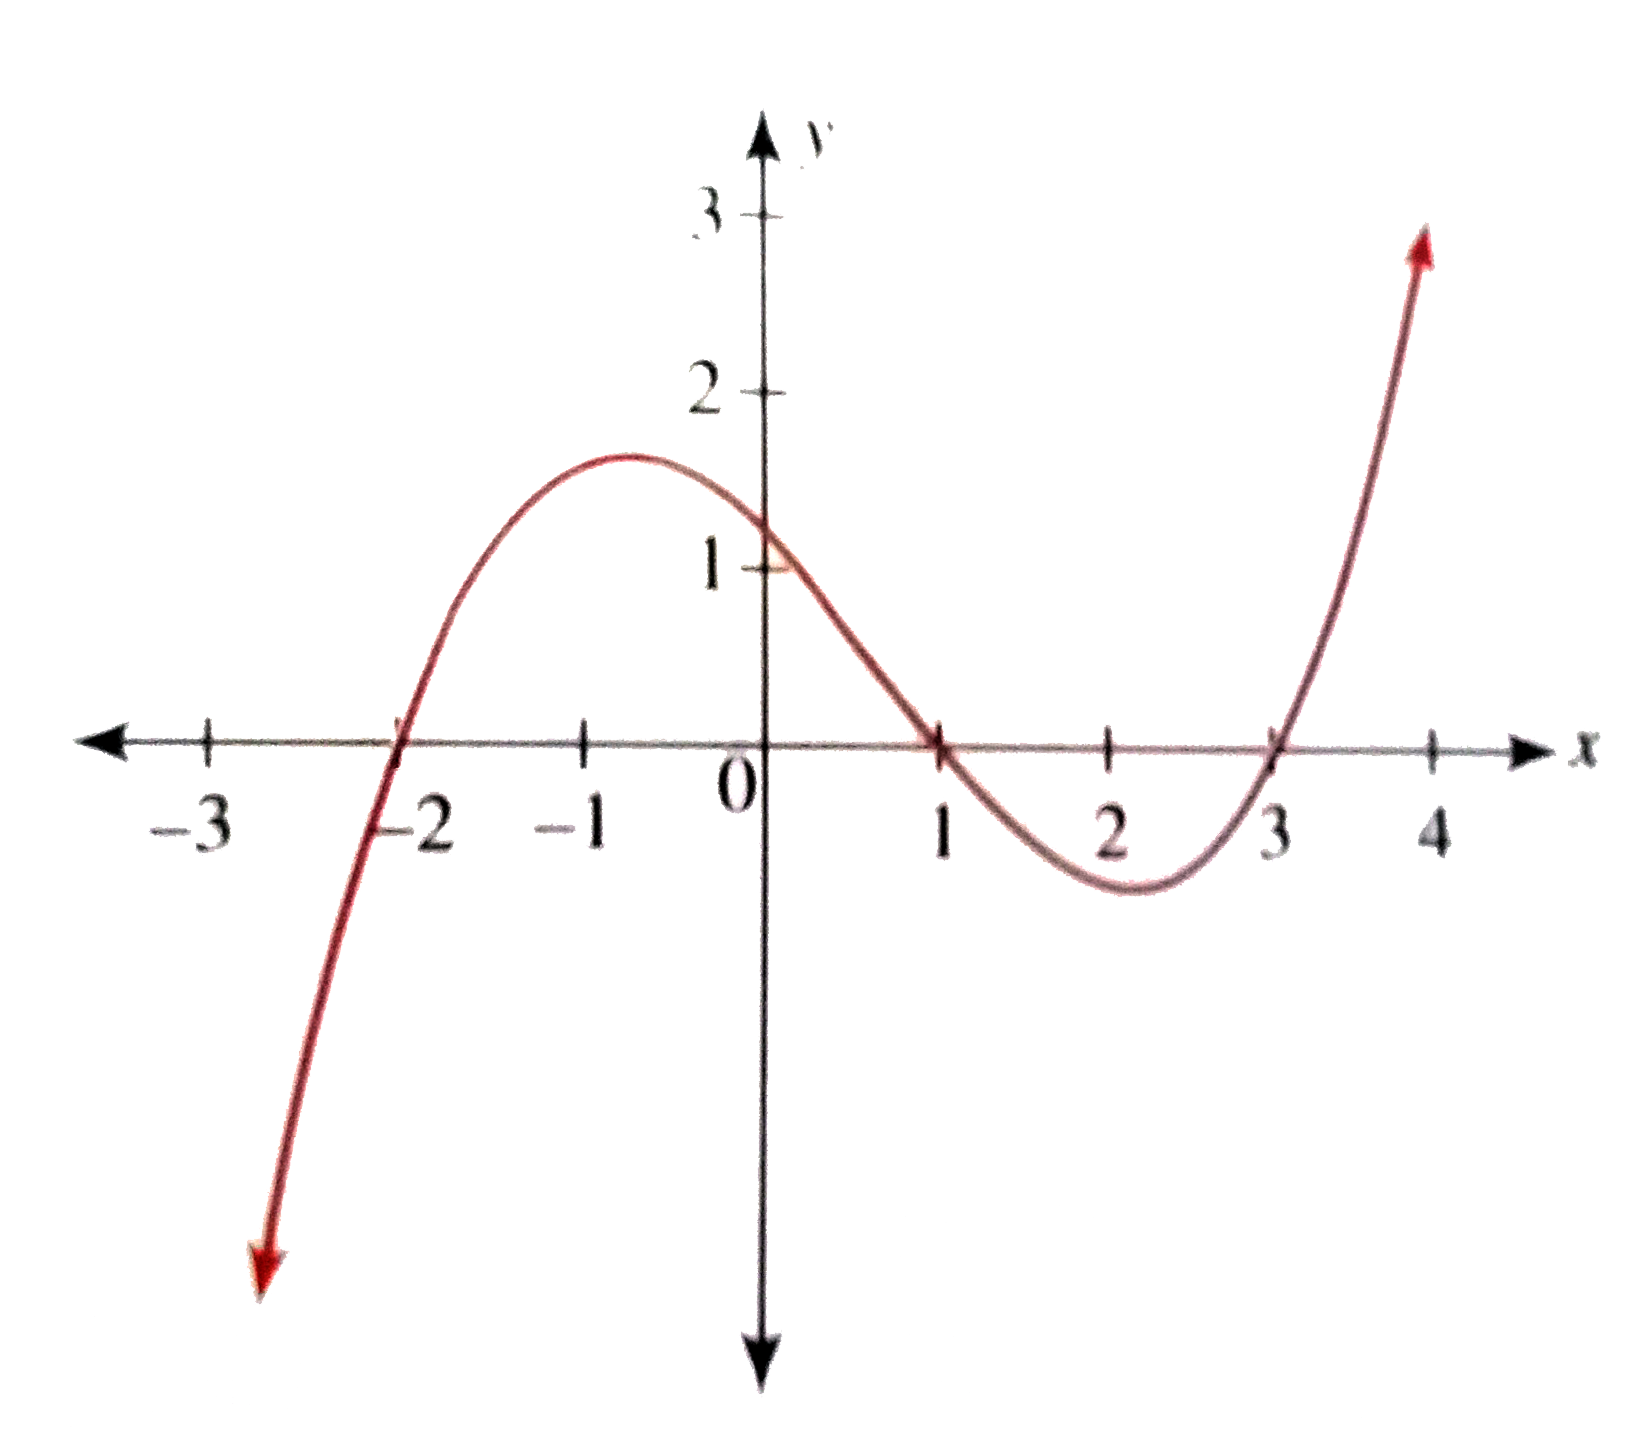
Then draw the graphs of
(i) `|y|=sgn(f(x))` (ii) `|y|=|f(x|)|`
(iii) `y=x^(sgn)(f(x))`12:56View SolutionDraw the graph and find the points of discontinuity `f(x) = [2cos x]` , `x in [0, 2pi]` . ([.] represents the greatest integer function.)
04:48View SolutionDraw the graph and discuss the continuity of `f (x) = [sin x + cos x], x in [0, 2pi),` where [.] represents the greatest integer function.
07:23View SolutionDraw the graph and find the points of discontinuity for `f(x)=[x^(2)-x-1],x in[-1,2]` ([.] represents the greatest integer function).
04:52View SolutionDraw the graph of `y=tan^(-1)x+cot^(-1)x`
01:23View SolutionDraw the graph of `y=|(1)/(|x|)-2|`.
01:30View SolutionDraw the graph of `y=tan^(-1)x+cos^(-1)x+sin^(-1)x`.
01:29View SolutionDraw the graph of `|y|=(x-1)(x-2)(x-3)`.
02:03View SolutionDraw the graph of `y=2sin^(-1)(x//3)`.
01:27View SolutionDraw the graph of `y=cot^(-1)|x|`.
00:59View SolutionDraw the graph of `y=sec^(-1)|x|`.
04:58View SolutionDraw the graph of `y=|log_(e)(x+3)|`.
01:47View SolutionDraw the graph of `y=|log_(e)|x||`.
01:28View SolutionDraw the graph of `y=|{x}-0.5|`, where `{.}` represents the fractional part function.
02:39View SolutionDraw the graph of `y=|sinx|+sin|x|`.
04:11View SolutionIf the graph of `y=|f(x)|` is as shown in figure
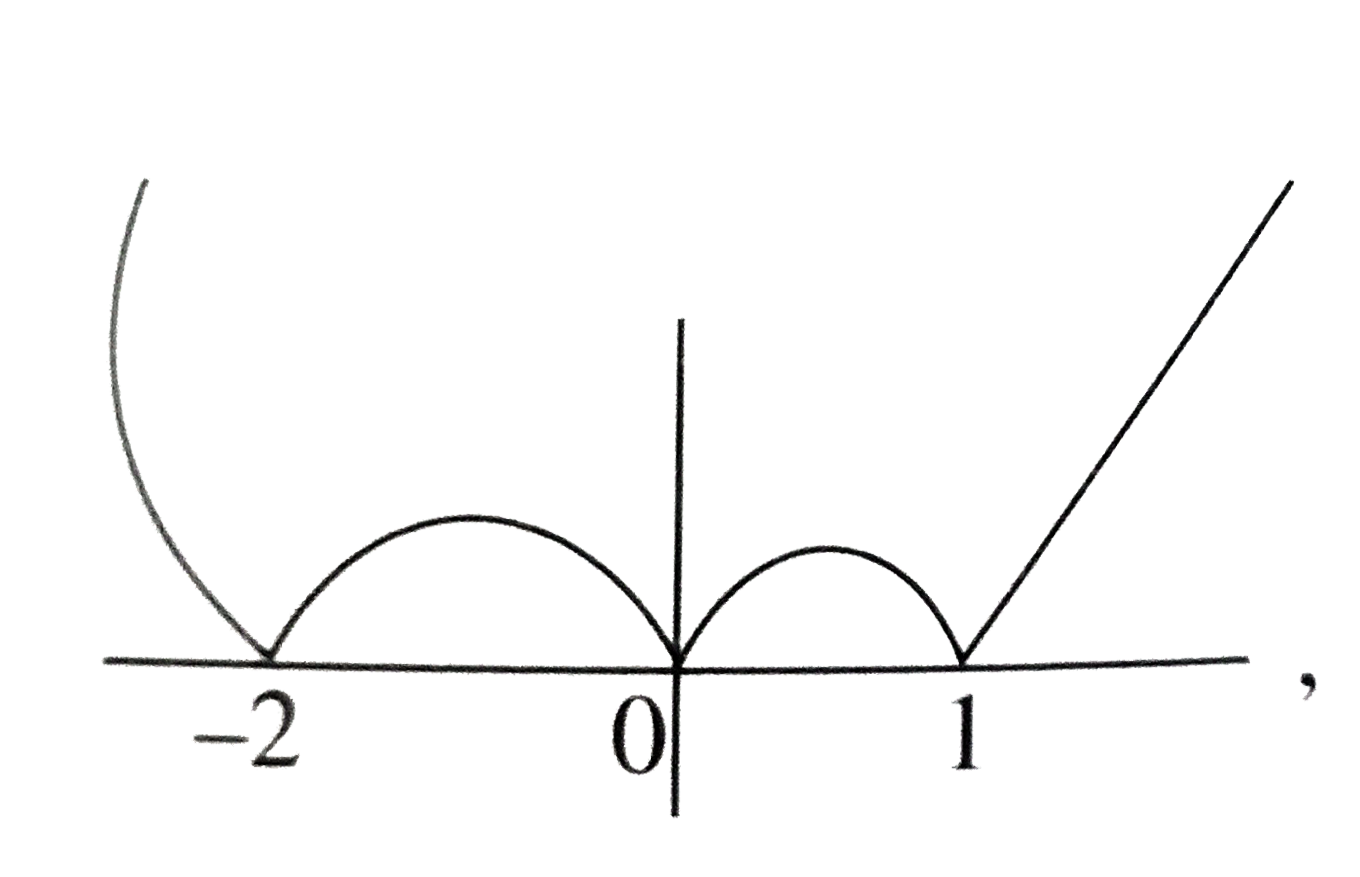 then the graph of `y=f(x)` may be 02:35View Solution
The number of real solutions of the equation `sqrt(1+cos2x)=sqrt(2)sin^(-1)(sinx),-pilt=xlt=pi` is 0 (b) 1 (c) 2 (d) infinite
04:34View SolutionFind the number of real solutions to the equation `log_(0.5)|x|=2|x|`.
02:39View SolutionFind the number of points where the function `f(x) = max(|tanx|,cos|x|)` is non-differentiable in the interval `(-pi,pi)`.
03:25View SolutionFind the number of points of non-diferentiability for `f(x)=max{||x|-1|,1//2}`.
05:29View SolutionLet `f(x) = max. {|x^2 - 2| x ||,| x |}` then number of points where `f(x)` is non derivable, is :
05:29View SolutionDraw the graph of `|y|=[x]`, where [.] represents the greatest integer function.
02:00View SolutionDraw the graph of `|2x|+|y|=2` using graphical transformation.
03:45View SolutionConsider the function `f(x)={2x+3, x le 1 and -x^2+6, x > 1}` Then draw the graph of the function `y=f(x), y=f(|x|) and y=|f(x)|.`
04:38View SolutionThe graph of `y=f(x)` is as shown in the following figure. Draw the graph of `y=[f(x)]`.
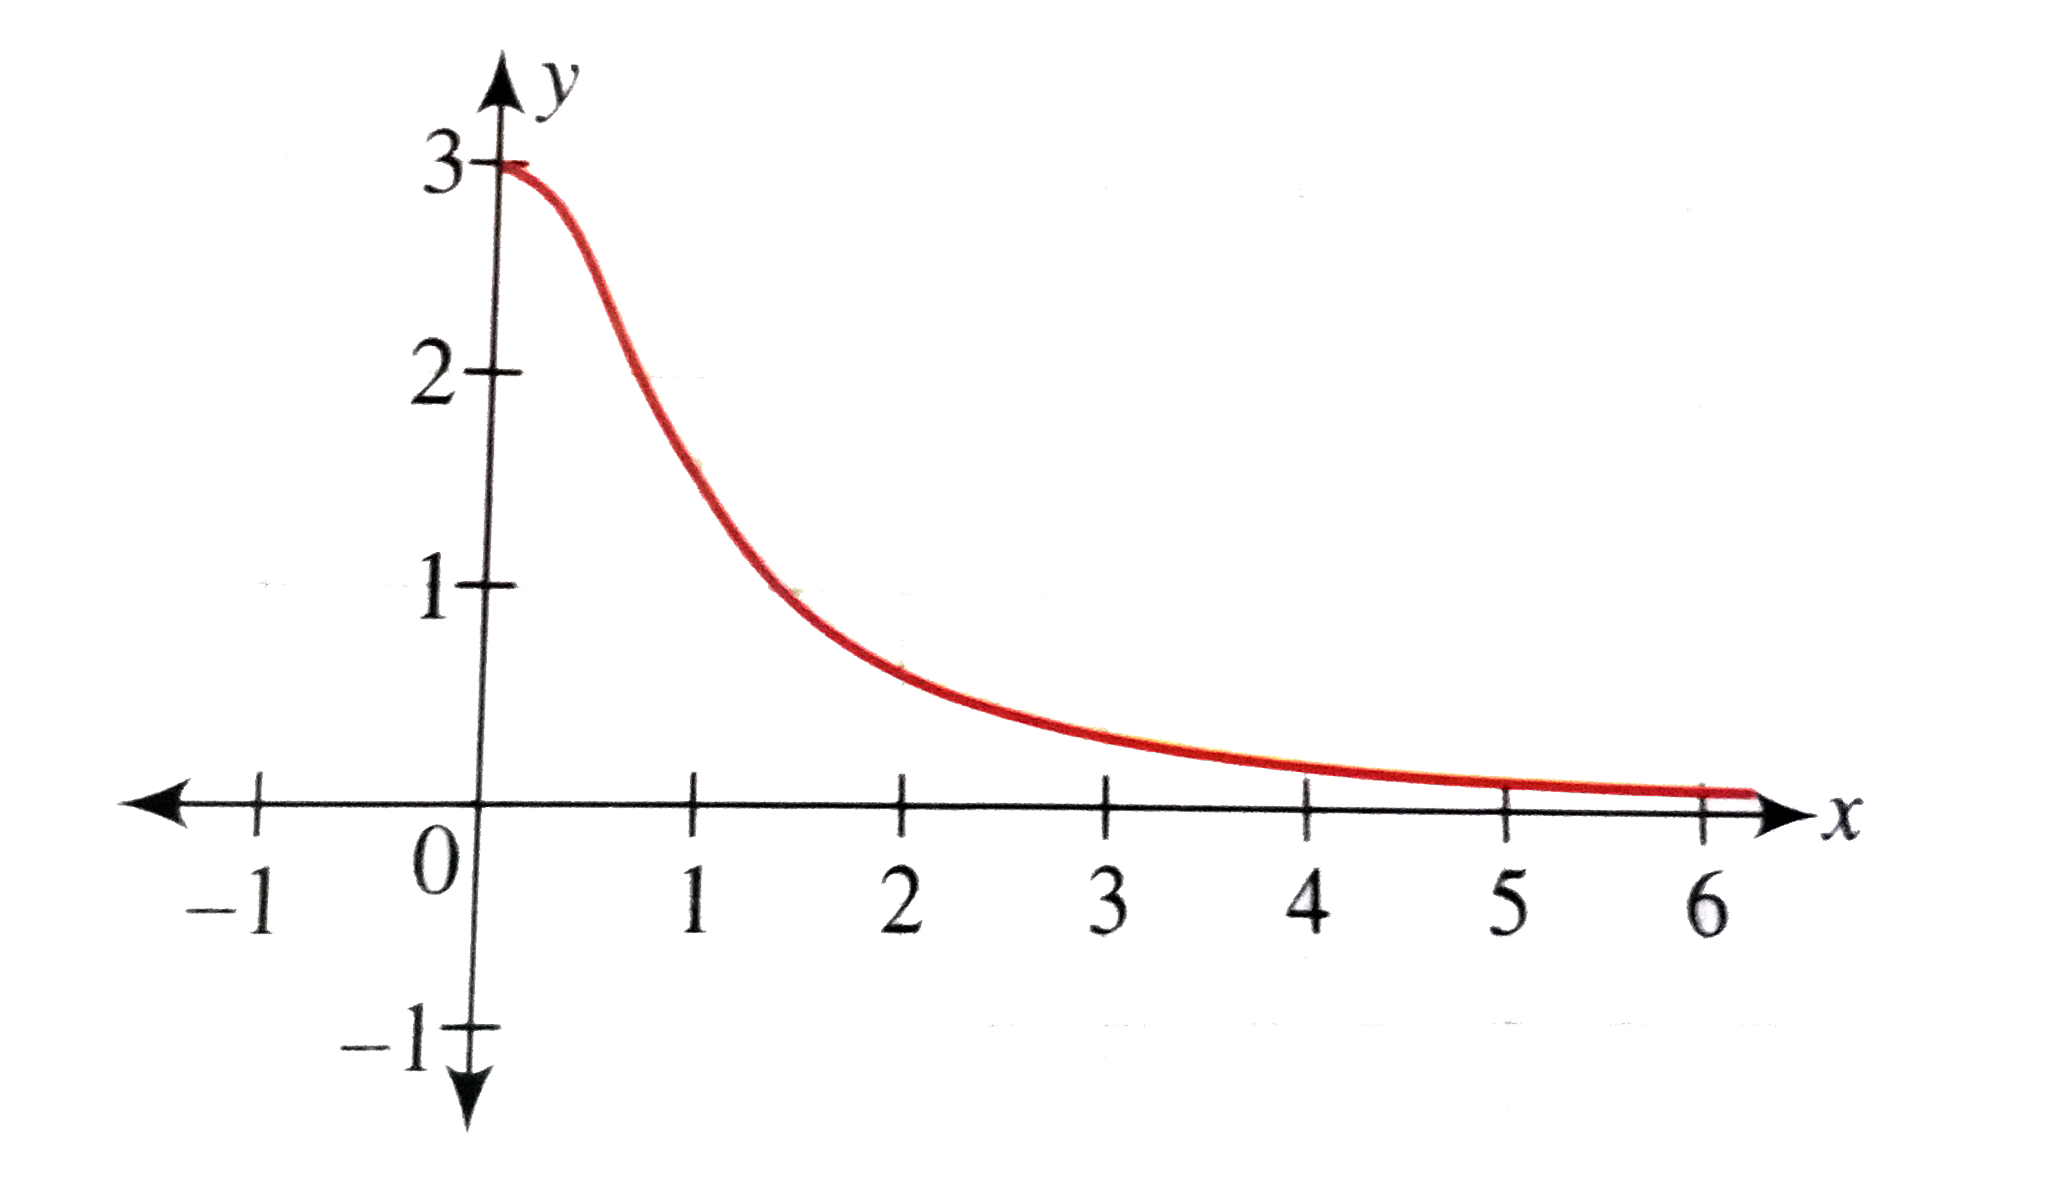 02:51View Solution
Draw the graph of `y=[4-x^(2)],|x|le2`, where `[.]` represents the greatest integer function.
03:57View Solution
ILLUSTRATION questions and complete solutions for chapter GRAPHICAL TRANSFORMATIONS of CENGAGE MATHS (ENGLISH) of Class 12
